THE CONTRIBUTION OF EARTH OBSERVATION TECHNOLOGIES TO
MONITORING STRATEGIES OF CULTURAL LANDSCAPES AND SITES
B. Cuca a*
a
Dept. of Architecture, Built Environment and Construction Engineering, Politecnico di Milano, Via Ponzio 31, 20133 Milan, Italy – [email protected]
KEY WORDS: Cultural landscapes, Earth Observation, satellite remote sensing, GIS, Cultural Heritage policy, geo-hazards
ABSTRACT:
Coupling of Climate change effects with management and protection of cultural and natural heritage has been brought to the attention of policy makers since several years. On the worldwide level, UNESCO has identified several phenomena as the major geo-hazards possibly induced by climate change and their possible hazardous impact to natural and cultural heritage: Hurricane, storms; Sea-level rise; Erosion; Flooding; Rainfall increase; Drought; Desertification and Rise in temperature. The same document further referrers to satellite Remote Sensing (EO) as one of the valuable tools, useful for development of “professional monitoring strategies”. More recently, other studies have highlighted on the impact of climate change effects on tourism, an economic sector related to build environment and traditionally linked to heritage. The results suggest that, in case of emergency the concrete threat could be given by the hazardous event itself; in case of ordinary administration, however, the threat seems to be a “hazardous attitude” towards cultural assets that could lead to inadequate maintenance and thus to a risk of an improper management of cultural heritage sites. This paper aims to illustrate potential benefits that advancements of Earth Observation technologies can bring to the domain of monitoring landscape heritage and to the management strategies, including practices of preventive maintenance. The attempt here is to raise awareness on the importance of integrating satellite remote sensing imagery and the deriving products with other geospatial information (even geo-referenced historic maps) for a more complete insight on the environmental dynamics of landscapes. geo-hazards possibly induced by climate change and their possible hazardous impact to natural and cultural heritage: Hurricane, storms; Sea-level rise; Erosion (both wind and water driven); Flooding; Rainfall increase; Drought; Desertification and Rise in temperature. The same document further referrers to satellite Remote Sensing (EO) as one of the valuable tools, useful for development of “professional monitoring strategies”. More recently, in 2016, another study gave insights on the impact of climate change effects on the economic sector related to build environment and traditionally linked to heritage – the tourism sector. “World Heritage and Tourism in a Changing Climate” reports that in the period of 1979 till 2013 the highest numbers of cases have identified a specific factor negatively affecting the outstanding universal value of the property in “Management threat seems to be a “hazardous attitude” towards cultural assets that could lead to inadequate maintenance and thus to a risk of an improper management of cultural heritage sites. The study here proposed aims to illustrate, through
selected case studies, some possible benefits that advancements of EO technologies can bring to the domain of monitoring landscape heritage and hence possibly to the management strategies, including practices of preventive maintenance.
2. EARTH OBSERVATION FOR HERITAGE MONITORING
(Agapiou et al., 2016; Cigna et al., Cuca et al., 2016). This paper focuses on two cases found in different climatic conditions that experience different threats potentially linked to the effects of the global climate change. Namely, the risks addressed are those caused by flooding events in the town of Albenga and the delta of Centa River and the pressure of soil erosion exerted on the landscapes and archaeological sites found in the Paphos District in Cyprus.
3. CASE STUDY CASE STUDY: ALBENGA AND CENTA RIVER DELTA
The archaeological site of Albenga in Italy (Liguria Region) is an area composed of significant historic layers, located within the boundaries of Centa riverbed. The church of San Clemente, situated on the right bank of the river is mostly out of water, but becomes partially or even totally submerged in case of great floods. Such extreme events exert constant pressure to the structures and to the surrounding landscapes, deprived of any kind of protection devices. Experts evaluate that this area, that has been a subject of only occasional studies, is still missing an accurate analysis linked with its surroundings and within a context of precarious environmental balance.
In 2015, Barazzetti et al., have illustrated how multi-source data integration, including UAV imagery and historic maps, could provide a more holistic working environment to archaeologists and other specialists in the field interested in the dynamics of this case study inserted in such a specific context. More recent in-depth studies (Van Meerbeek, 2017) establish a stronger link between the global climate change and increase of critical weather events with the threats that potential moderate to very high flooding episodes could cause to a delicate landscape such as that of Albenga.
3.1 Datasets
The main data used to observe the riverbed changes of Centa River were freely available satellite imagery Landsat 8 (L8), accessed and downloaded from the geo-portal of the Geographical Survey of United States (USGS).
Year
Table 1. Satellite imagery used for Albenga case study
Calibrated and cloud free above the area of interest, the two satellite images regard distinct moments in the year 2016 – end of May 2016 (start of the summer season) and end of November 2016. The latter one was the first available image after the last major flood event that has shook this Liguria locality has occurred, between 24th and 25th of November 2016, as testified by numerous national and local newspaper articles. The images were used to observe expected changes of the river flow and of the mud deposit in the area, due to the recent flooding event. Images used are described in details in Table 1.
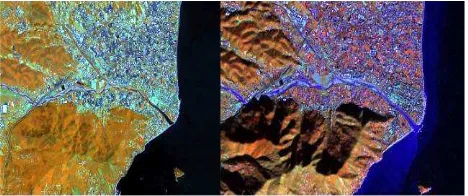
Figure 1 shows delta of Centa River and Albenga locality on Nov 29th 2016, observed in a multi-spectral image through different band combinations.
Figure 1. Town of Albenga and delta of Centa River on Nov 29th, 2016: (left) Red – Green – Blue (RGB) true colour composite i.e. the band combination that corresponds to the human vision; and (right) in NIR – green – blue pseudo colour composite that enhances the presence of vegetation (in red).
3.2 Methodology applied for detecting the changes in Centa river flow
In order to evaluate the changes around the riverbed of Centa river, the author has conducted the following steps:
1) Step 1: Visual investigation of the imagery examining different band composites, in particular SWIR NIR -red pseudo colour band combination;
2) Step 2: Calculation of the Normalized Difference Vegetation Index (NDVI) for both images, before and after the flood event;
3) Step 3: Estimation of water component in the two images using thresholding of the NDVI images;
4) Step 4: Comparison between the areas impacted by the water before and after the flood event.
These steps are illustrated here bellow confronting the images obtained. Figure 2 and Figure 3 show the area of the study in SWIR- NIR - red pseudo colour composite that offers added definition of land-water boundaries and enhances details not easily recognizable in the visible bands alone (USGS, 2016). The area depicted in the white square (Fig. 4) refers to the larger context of Albenga partially submerged archaeological site.
Figure 3. A close-up on the town of Albenga and delta of Centa River seen in SWIR – NIR – red pseudo colour composite on Nov 29th 2016. Visual interpretation allows us to identify some significant mud deposit, probably due to the recent flood event (area within the white square).
Successively, the two multi-spectral pan-sharpened L8 OLI image were used to calculate the NDVI values of the case study area in months of May and in November, just after the flooding event (Figure 4).
Figure 4. The calculation of NDVI on area of study in May and Nov 2016 (above); close-up on the NDVI results in May 2016 (center) and close-up on the NDVI results in Nov 2016 (below).
From a visual inspection, it can be easily noted that the area covered by water (black colour) has significantly increased in the width, approaching thus the shore of the riverbed and the inhabited areas around it.
In particular, a threshold filter of pixel value below 0 was applied in order to distinguish between areas with major water component (i.e. areas with pixel values below zero).
The result in fact show a significant change in the area covered by water (wet areas) and the it enhances the difference in the situation occurring in summer season and few days after the last major flooding event affecting the area (Figure 6).
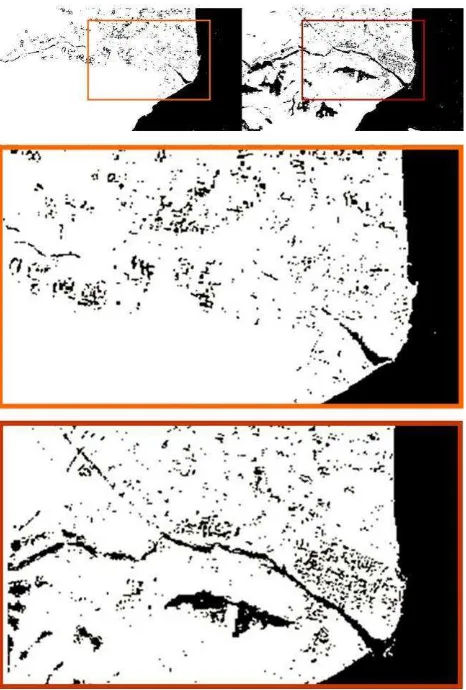
Figure 5 Normalization of significant areas for threshold of zero (0): the mage was classified for water applying the value of 0 to all negative NDVI values and the value of 1 to all positive results. The results show images of the area in May and Nov 2016 (above) and close-ups on the results in May 2016 (centre) and in Nov 2016 (below).
3.3 Comparison of the results and discussion
Figure 6 NDVI difference between May and Nov 2016 (above); NDVI difference superimposed to the RGB composite of the LS-8 image taken on Nov 29th 2016.
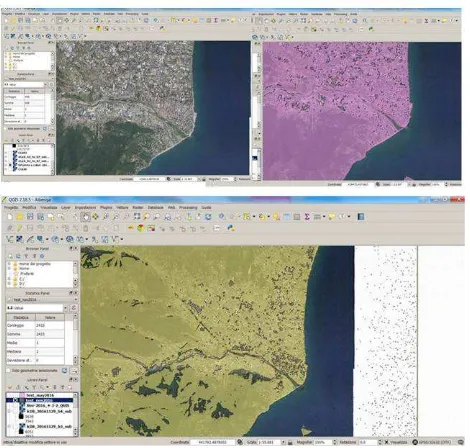
Figure 7 Orthophoto of Liguria region provided as a Web Map Service (WMS) by local authorities (above left); Vector values of NDVI results in May 2016 superimposed to orthophoto (above right); Vector values of NDVI results in Nov 2016 superimposed to orthophoto (below).
In addition, NDVI normalised results were vectorised and superimposed to an orthophoto of the Liguria Region provided as a Web Map Service (WMS), Figure 7. This procedure, done within an open source QGIS has allowed to directly connect the results deriving from complex elaborations done on satellite imagery directly with Open geospatial data provided by the
local authorities. This method was chosen also because, due to its characteristics, satellite remote sensing imagery is particularly compatible and easily integrated with other geospatial data sources within common geospatial infrastructure system environments (Agapiou 2016, Franci 2016).
4. CASE STUDY PAPHOS DISTRIC, CYPRUS
As illustrated in a previously conducted work (Cuca B. and A. Agapiou, 2017), another threat connected to effects of climate change, namely soil erosion, can strongly influence entire portions of cultural landscapes. The study performed on Paphos District in Cyprus has illustrated the application of RUSLE method that supports use of satellite imagery. The results have shown how optical satellite imagery, even from different satellite missions, can be combined and integrated with other geospatial information to provide important indications on soil erosion analysis. More specifically, the factor of land cover change, called C-factor, was examined in order to evaluate the impact that such changes and probably land use changes have on the amount of soil loss.
Particular attention was given to the areas sensitive to land cover change such as cultural landscape rich of archaeological remains in the District of Paphos. It is interesting to mention that for the purposes of this analysis, authors have used only freely available imagery (from US Landsat and European Copernicus missions) and mostly freely available software applications, in particular SNAP Tool provided by European Space Agency (ESA) and open source QGIS software. The main findings suggest that, as shown in Figure 8, some significant changes in the land cover did occur between 80s of the last century and today. Such alterations are probably linked with the urban expansion of the city and they have had a major impact to the C factor. It was also to be observed how these areas are situated in a very high proximity of important World Heritage Sites.
Figure 8 Difference in C-factor over nearly last 30years observed false colour: the more significant changes potentially impacting the erosion of the soil in Paphos District are highlighted in blue and dark blue colour.
5. DISCUSSION
in detail giving some indications on the possible trends and magnitude of the hazard. As shown in Figure 7, the water contents in the archaeological area of Albenga has significantly changed between the two instances in 2016. Given that the site is considered to be of high cultural importance by the experts in the field, the assessment of risks due to the past hazardous flooding events and simulation of the future ones could possibly give important insight for a more sustainable management of such areas that are found within an endangered ecosystem. In case of Paphos District, the Figure 8 shows how significant changes in land cover have occurred over the past 30 years. Such changes are most probably to be connected to urban development that, if unplanned, can leave the most vulnerable areas without appropriate protection and hence more subject to threats of geo-hazards, including soil erosion.
6. CONCLUSIONS
The paper illustrates two examples examining specifically if and how the availability and facilitated access to satellite imagery can incite a more systematic use of these later ones in protection and maintenance practice of heritage assets. In Europe, for example, the results of Open Government Data initiative (specifically for the category of geospatial data) and of Directives PSI and INSPIRE are already tangible and they foster a more systematic and efficient use of geospatial information in general. Further, some specific policy recommendations for Cultural Landscape and their possible implications are considered - European Commission has recently stated its strong commitment on collaboration with other countries when it comes to protection of cultural heritage and it has identified Copernicus Emergency Management Service (EMS) as one that should majorly support this action (EC, 2016). Satellite imagery of cultural heritage sites at risk are to be provided timely by this service in order to evaluate damage and to plan possible subsequent interventions. Such attempt seems to be the first official example and a direct link between a systematic service of an EO programme (and hence potential services and products deriving from satellite remote sensing technologies) with the domain of monitoring, protection and risk assessment of heritage sites.
The examples illustrated by this paper are inserted in such a dynamic framework and they propose a method for integrating (or at least not excluding) satellite remote sensing imagery in processes that regard geometric documentation and monitoring of cultural heritage landscapes and sites. Special focus is given by the author to freely available and accessible remote sensing satellite imagery and their integration with other types of open geospatial data, such as ortophotos, cartography or even historical maps within Spatial Data Infrastructure. Author suggests that the use of EO products in such a larger holistic framework can be useful to indicate trends of the observed phenomena, both rather short in time of action but with high hazardous impact (such as flooding episodes) as well as long-term risks that cause gradual but substantial damage of original values of our landscapes (such as soil erosion and soil loss). The main attempt of the paper was to raise awareness on the benefits of advancements in EO technologies and of deriving products can bring to a more complete analysis of complex natural and cultural ecosystems. Author suggests that such practice could lead to more informed decision making processes when tackling the emergency situations as well as in cases of ordinary management of cultural landscapes.
ACKNOWLEDGEMENTS
This work has been supported by the GAMHer project: Geomatics Data Acquisition and Management for Landscape and Built Heritage in an European Perspective, PRIN, Progetti di Ricerca di Rilevante Interesse Nazionale – Bando 2015, Prot.
2015HJLS7E. Furthermore, the author makes a reference to
results of previously conducted research activities that have been partially funded within the project CLIMA (Cultural Landscape risk Identification, Management and Assessment), in the framework of Joint Programming Initiative for Cultural Heritage (JPI CH), agreement number KOINA/ΠΚΠ-HERITAGE PLUS/0314/07. The author acknowledges the Research Promotion Foundation of republic of Cyprus which has financed the project.
REFERENCES
Agapiou, A., Lysandrou, V., Themistocleous, K., Hadjimitsis, D.G., 2016. Risk assessment of cultural heritage sites clusters using satellite imagery and GIS: the case study of Paphos District, Cyprus, Nat. Hazards, 2016, Vol. 83, Num. 1, pp. 5.
Cigna F, Harrison A, Tapete D, Lee K., 2016. Understanding geohazards in the UNESCO WHL site of the Derwent Valley Mills (UK) using geological and remote sensing data. Proc. SPIE 9688, Fourth International Conference on Remote Sensing and Geoinformation of the Environment (RSCy2016), 4-8 April 2016, Paphos, Cyprus, Paper 96881V, 10 pp. doi: 10.1117/12.2240848
Colette A. (edited by), 2006. Climate Change and World Heritage. Report on predicting and managing the impacts of climate change on World Heritage and Strategy to assist States Parties to implement appropriate management responses, World Heritage Reports 22, World Heritage Centre UNESCO.
Cuca B. and A. Agapiou, Impact to the soil erosion estimation for cultural landscapes: case study of Paphos District in Cyprus., Int. Arch. Photogramm. Remote Sens. Spatial Inf. Sci., XLII-5-W1, 25-29, https://doi.org/10.5194/isprs-archives-XLII-5-W1-25-2017, 2017
Cuca B. and D. G. Hadjimitsis, 2016. Space technology meets policy: An overview of Earth Observation sensors for monitoring of cultural landscapes within policy framework for Cultural Heritage, Journal of Archaeological Science: Reports (online), https://doi.org/10.1016/j.jasrep.2017.05.001
Cuca B., Tzouvaras M., Agapiou A., Lysandrou V., Themistocleous K., Nisantzi A., Hadjimitsis D.G. (2016), Earth Observation technologies in service to the Cultural Landscape of Cyprus: risk identification and assessment, Proc. SPIE 9688, Fourth International Conference on Remote Sensing and Geoinformation of the Environment (RSCy2016), 96880Y (August 12, 2016); doi:10.1117/12.2241669;
Franci, F., Bitelli, G., Mandanici, E., Hadjimitsis, D., Agapiou, A., 2016. Satellite remote sensing and GIS-based multi-criteria analysis for flood hazard mapping, Natural Hazards, 2016, Vol. 83, Num. 1, pp. 31.
Markham, A., Osipova, E., Lafrenz Samuels, K. and Caldas, A., 2016. World Heritage and Tourism in a Changing Climate. United Nations Environment Programme, Nairobi, Kenya and United Nations Educational, Scientific and Cultural Organization, Paris, France.
European Commission, 2016. Joint Communication to the European Parliament and the Council “Towards an EU strategy for international cultural relations”, accessed via
http://eur-lex.europa.eu/legal-content/EN/TXT/?uri=JOIN%3A2016%3A29%3AFIN
USGS (U.S. Geological Survey), Potential Information
Content, last accessed in May 2017 via