www.elsevier.com / locate / econbase
More on tax perception and labour supply: the Spanish case
a a b ,
*
´
´
´
Marıa Arrazola , Jose de Hevia , Jose F. Sanz
a
Department of Economics, Universidad Europea de Madrid (UEM-CEES), Campus de Villaviciosa, Villaviciosa de ´
Odon, 28670 Madrid, Spain
b
Department of Public Finance, Universidad Complutense de Madrid, Campus de Somosaguas, 28223 Madrid, Spain
Received 5 May 1999; accepted 29 September 1999
Abstract
We estimate the marginal tax rate perceived by married Spanish males. The results suggest the existence of prominent divergences between subjective perception and formal income tax rules. The efficiency and welfare implications of this tax rate gap are also assessed. 2000 Elsevier Science S.A. All rights reserved.
Keywords: Labour supply; Tax perception; Welfare; Excess burden
JEL classification: D60; H24; H30; J22
1. Introduction
The vast majority of empirical work on labour supply is formulated under the assumption that taxpayers use the statutary marginal tax rates formally set up in the personal income tax schedule and in the social security contributions. However, against this view, authors such as Rosen (1976), Fujii and Hawley (1988) and Bartolome (1995) suggest that, in evaluating the proper connections between taxes and labour supply, analysts should differentiate between formal and perceived marginal tax rates. If these two tax rates are divergent, then the latter should be the relevant one in economic analysis.
This paper investigates the tax perception of the married Spanish man using a method proposed in a ¨ ¨
recent paper by Brannas and Karlsson (1996) (hereafter BK). However, we depart from BK’s paper in some points. Firstly, in formulating the perceived tax scale we allow for individual heterogeneity.
*Corresponding author. Tel.: 191-394-24-30; fax: 191-394-24-31. E-mail address: [email protected] (J.F. Sanz)
Secondly, we estimate the model by implementing the generalized method of moments (GMM). In addition, the paper is expanded to evaluate the welfare impact of the fact that the perceived tax scale may not coincide with that legally imposed.
2. The empirical model
Following BK, we approximate tax perception using a labour supply model. This model incorporates some parametric assumptions about the characteristics of the perceived tax scale, which allows to estimate simultaneously the relevant parameters for the labour supply function and for the perceived tax schedule. We suppose that individual preferences are such that the labour supply function can be expressed as:
hi5m1avi1byi1gzi1´i (1)
where h represents the actual yearly working hours;i vi5(12t9)W denotes the hourly net wagei
9
obtained from the gross wage per hour W and the perceived marginal tax ratei t9; yi5Vi2ti1tiW hi i is the virtual income defined in terms of non-labour income V and total perceived tax liabilityi t; z is a vector of socioeconomic variables influencing labour supply; and ´ is a random variable normally distributed, with a zero mean and constant variance, which shows preference heterogeneity among individuals. Non-labour income, V , is defined as the sum of gross capital income (VK ) and the incomei i of the other members living in the same household (VN ).iTo estimate (1), a modified logistic function is imposed for the perceived tax scale,t9:
du
individual heterogeneity in tax perception. This random term, ni, is supposed to follow a normal distribution with mean zero and constant variance and to be independently distributed from ´, and from the rest of the variables in the model. The constraints ondu and ond2 ensure thatt9is consistent with tax progressivity. By substituting (2) into (1), we get the model to be estimated:
9
9
and
ui5´i2aniWi1b (niWi2ni iI )
T expresses the part of the total tax liability perceived by the worker which is not linked to perceptioni heterogeneity.
3. Results for the Spanish case
The sample used consists of a number of working husbands drawn from the European Household Panel (PHOGUE). This survey contains information on income and labour status for 17 908 Spanish individuals. The selection procedure resulted in a final sample with 1406 working married men.
The variables used in the analysis are: the number of working hours per year (h), the hourly gross wage expressed in Spanish pesetas (W ), the annual individual’s gross capital income (VK ) and the net income belonging to the rest of the household members (VN ); both of them, expressed in tens of thousands of Spanish pesetas. The age of the individual and the number of children living in the household are the two variables included in the vector z of socioeconomic variables.
To estimate (3) GMM is implemented. This estimation method accounts for non-linearity, for endogeneity of W, VK and VN and for the heteroscedasticity involved in the model. The results of the
2
estimation are presented in Table 1. This table reveals that neither the age nor the number of children seems to affect the number of working hours supplied. Hence, in column II, Table 1 also reports the results after eliminating these two regressors.
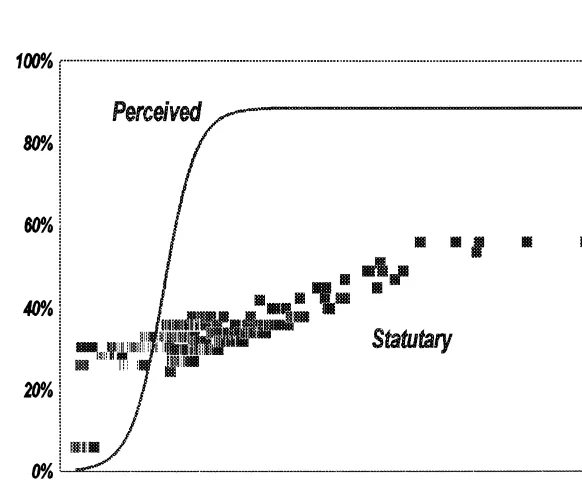
According to the estimated parameters reported in Table 1 (column II), the perceived marginal tax rate is imputed to every individual in the sample. Fig. 1 depicts these estimated marginal tax rates together with the corresponding legal marginal tax rates existing in 1994, taking into account the most advantageous tax-return filing option (jointly or separately).
As Fig. 1 shows, contrary to what BK obtain for the Swedish case, we get extensive discrepancies between formal and perceived marginal tax rates in the Spanish case. BK suggest that the origin of this divergence might be in the misperception of legal marginal tax rates. However, from our view, it is an oversimplification simply to note that taxpayers make systematic mistakes with respect to how they perceive the existing tax-transfer structure. In fact, apart from errors in perception, individuals, acting in a rational manner, may bring to bear past experiences, prior beliefs and reference points to think about their actual marginal tax liability. Namely, facts such as shifting of taxes and social security contributions, implicit taxation due to withdrawal of means-tested benefits and progressivity of transfer programmes may be accurately perceived by the taxpayers who can incorporate them in their decision-making processes in order not to be deceived by appearances. Nevertheless, this second
2
Table 1
Parameter estimates of Eq. (3) by GMM witht9defined in terms of plaind parameters (Eq. (2))
Parameter I II
du 0.863* 0.886*
(21.178) (19.552)
d1 7.147** 6.230**
(1.852) (1.747)
d2 20.024* 20.021*
(1.966) (1.923)
m 2962.20* 2826.70*
(18.828) (18.255)
a 21.059* 20.994*
(3.985) (3.303)
b 20.363* 20.326**
(2.125) (1.860)
Age 21.540
(1.537)
Nkids 24.005
(0.0467) ˆ
su 357.15 354.41
Hansen test 25.356 27.575
P value (0.974) (0.967)
Degrees of freedom 41 43
Absolute t values in brackets. Significant at *95%; **90%.
source of divergence between legal and perceived tax rates may lead to an improvement in the knowledge of true marginal tax liability by eliminating potential fiscal illusion.
In order to disregard the suspicion that individuals could perceive their tax status differently according to personal peculiarities, we re-estimate the model allowing for individual variation in the
9
perception of taxes. By making the d parameters hinge on individual characteristics, ti becomes:
9
and the model to be estimated remains (3) but with T equals:i
9
9
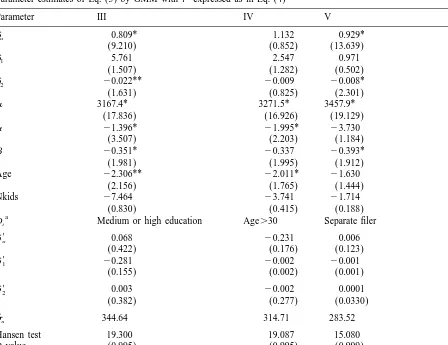
where D is a dummy variable controlling for individual characteristics such as education, age or typei of tax return. Table 2 shows that the outcomes of this re-estimation did not show any evidence to reject equality in tax perception regardless the age of the individual, his educational attainment or the type of tax return filed by the couple. This result supports our interpretation.
4. Tax perception and welfare
We can expect that the efficiency and welfare implications of public policies based on formal personal income tax schedules and legal social security contributions may be biased in comparison with the same analysis when actually perceived tax rates are used.
To illustrate this point, we provide some insights into the welfare implications of this tax rate gap. In order to do this, we define two alternative tax scenarios: a benchmark scenario (E ) and a final0 scenario (E ). The former, E , assumes that workers take labour supply decisions according to the1 0
9
marginal tax rates they actually perceive (t0); in the latter, E , in contrast, workers are supposed to1
9
use formal tax rates (t1) ‘as if’ these were the true marginal tax rates.
The welfare effects of the transition from E to E (E0 1 0→E ) can be analyzed using traditional1 methods. Therefore, the so-called equivalent variation (EV), compensating variation (CV) and deadweight loss (DWL) entailed in (E0→E ) are calculated.1
Table 2
Parameter estimates of Eq. (3) by GMM witht9expressed as in Eq. (4)
Parameter III IV V
Di Medium or high education Age.30 Separate filer
9
Degrees of freedom 38 38 38
a
Dummy variable 0 / 1 (1 when the characteristic applies to the observation, 0 otherwise). Absolute t values in brackets. Significant at *95%; **90%.
Table 3
Summary of the effects on the labour supply, on welfare and on the excess burden variation involved in the transition E0
→E1
Aggregate effects
Labour supply Equivalent variation Compensating variation =DWL
a b c b c b d
change (%) Aggregate Mean Gainers (%) Aggregate Mean Gainers (%) Aggregate Change (%)
25.92 2357.05 2254 8.11 2358.48 2255 8.11 2294.83 250.41
a
Change of labour supply in percentage of the labour supply offered with perceived marginal tax rates.
b
Million pesetas / year.
c
Thousand pesetas / year.
d
Acknowledgements
Finance for this research has been provided by FUNCAS. This funding is gratefully acknowledged.
References
Bartolome, C.A.M., 1995. Which tax rate do people use: average or marginal. Journal of Public Economics 56, 79–96. ¨ ¨
Brannas, K., Karlsson, N., 1996. Estimating the perceived tax scale within a labor supply model. Economics Letters 52, 75–79.
Fujii, E.T., Hawley, C.B., 1988. On the accuracy of tax perceptions. The Review of Economics and Statistics 70 (2), 344–347.