www.elsevier.com / locate / econbase
Can tax policy help explain state-level macroeconomic growth?
*
Steven Yamarik
Department of Economics, The University of Akron, Olin Hall, Akron, OH 44325-1908, USA Accepted 21 December 1999
Abstract
This paper empirically tests the role of tax distortions in explaining state-level economic growth through the estimation of disaggregated personal income, general sales and property tax rates. The results show that these disaggregated tax rates generate predictions more consistent with growth theory. 2000 Elsevier Science S.A. All rights reserved.
Keywords: Regional growth; Marginal tax rates
JEL classification: O47; H71
1. Introduction
The theoretical growth literature argues that increases in distortionary taxation lower the growth rate of output. Distortionary taxes are defined as those tax rates that alter the price of an accumulated factor of production — physical capital, human capital and technology. In the neoclassical growth model, Turnovsky (1996) shows that only increases in marginal tax rates on physical and human capital lower the transitional growth rate. Likewise, in two-sector endogenous growth models, Stokey and Rebelo (1995) show that increases in marginal tax rates on physical and human capital lower the steady-state growth rate.
However, the empirical growth literature typically does not distinguish between taxes paid on income, consumption or property, but rather lumps all distortionary taxation into one or two overall tax rates. For example, in cross-country studies, Koester and Kormendi (1989) and Easterly and Rebelo (1993) include one overall measure of tax distortion in their growth regressions. Similarly, in studies of US states, Mullen and Williams (1994) and Becsi (1996) include one estimate of the total effective marginal tax rate in their growth regressions. Given the gap between the theoretical
*Tel.:11-330-972-8491; fax: 11-330-972-5356.
E-mail address: [email protected] (S. Yamarik)
predictions and the tax variables used in the above studies, it is not surprising that the empirical results have been mixed over the effects of taxation on growth. In fact, Robert Barro argues that tax distortions ‘are likely to be important for growth . . . but further measurement and investigation is
1 important for obtaining reliable results.’
This paper takes Barro’s statement to task by empirically testing the role of tax distortions in explaining state-level growth in the US. Unlike previous work, the effects of taxation are disentangled by estimating disaggregated personal income, general sales and property tax rates. These disaggre-gated tax rates are then included in Barro-type growth regressions to estimate their impact on growth in total production, average productivity, investment and labor. The empirical results show that these disaggregated tax rates enter more often with the correct sign and significance than the aggregate measures used in the empirical literature. Therefore, this paper indicates that the current gap between the theoretical and empirical growth literatures may be closed by the use of improved estimates of marginal tax rates.
2. Theoretical predictions
The neoclassical and endogenous growth models show that growth in output per worker is driven by accumulation in the reproducible factors of production: human and physical capital. In the neoclassical growth model, capital accumulation only influences the transitional growth rate since steady-state growth is determined by exogenous technological progress and population growth. Therefore, the neoclassical model predicts conditional convergence: economies who start with lower output per worker will grow faster during the transition conditioned upon population growth rates, fiscal policy and investment rates. In the endogenous growth models, increases in physical and human capital accumulation, public infrastructure and innovation lead to faster steady-state growth rates.
Since the majority of taxes affect households’ decisions, the growth implications of taxation are similar in that tax rates that lower the transitional growth rate in the neoclassical growth model will lower the steady-state growth rate in endogenous growth models. For income taxation, Xu (1994) and Turnovsky (1996) show that increases in marginal tax rates on income lowers the growth rate of output, average productivity, investment and labor. For most production specifications, income tax rates lower the return on reproducible capital and thus decrease investment. This decrease in investment in turn decreases the growth rate of output, labor and productivity. For consumption or sales taxation, Stokey and Rebelo (1995) show that under most circumstances a consumption tax does not affect the return on capital and thus has no effect on investment, output and productivity. Property taxation, however, lowers the return on reproducible physical capital and on non-reproducible land. Therefore, increases in property tax rates that lower the return on capital will reduce growth in investment, output and productivity.
3. Estimated tax rates
There are five tax rates included in the growth regressions. First, the average tax rate with respect to gross state product (GSP) is measured as the ratio of total state and local tax receipts to GSP.
1
Similarly, the average tax rate with respect to property is measured as the ratio of state and local 2
property tax receipts to the net assessed value of property. The procedure of Koester and Kormendi (1989) is used to produce the remaining three tax rates: average effective marginal tax rates with respect to total production (GSP), personal income and general sales. For each state, the following regression is estimated over the 1977–1995 period
Revenuet5lumpt1MTR?Baset (1)
where Revenue is tax revenue collected, lump is lump-sum taxes that do not affect individualt t decisions, MTR is the marginal tax rate and Base is the tax base.t
4. Estimation results
´
This paper follows the work of Barro and Sala-ı-Martin (1995) and others in the regional growth literature and estimates the following equation:
2bT
(1 /T )?ln y /yf iT i 0g5a2(12e ) /T?ln yf i 0g1other variables1´i 0,T (2)
where T is the length of the interval (19 years). The dependent variable is measured either as (i) the average growth rate in real GSP, (ii) the average growth rate in real GSP per worker (average productivity), (iii) the average growth rate in the quantity of labor, or (iv) the average ratio of real investment to gross state product (I / GSP). ln yf i 0g represents the initial level of GSP per worker (or GSP for the labor growth equation) and is included for the neoclassical prediction of convergence. When GSP or labor is the dependent variable, other variables consist of taxation measures. When average productivity or I / GSP is the dependent variable, other variables consist of human capital and taxation measures. These specifications are consistent with the cross-country work of Koester and Kormendi (1989) and Easterly and Rebelo (1993). Lastly, the ´i 0,T term represents the average of error terms between dates 0 and T.
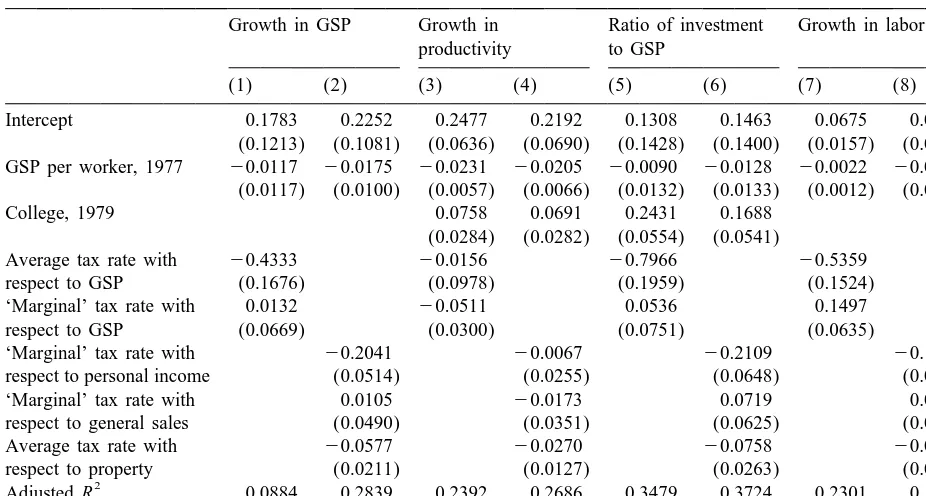
Table 1 presents the estimation results. The data for each of the 48 contiguous US states are pooled into a single observation. Each regression is estimated using ordinary least squares (OLS) where the standard errors have been corrected for heteroskedasticity using the method of White (1980). Columns 1–4 indicate that the neoclassical prediction of convergence in GSP and average productivity holds for the 1977–1995 period. The marginal tax rate with respect to GSP enters in positively in column 1, but negatively in column 3. The average tax rate, on the other hand, enters in negatively in both regressions. However, in column 2 and to a lesser degree, column 4, the results show that the disaggregated tax rates are more consistent with growth theory. First, personal income and property tax rates enter in negatively and are significant, while the sales tax rate is insignificant. Second, the adjusted R-squared increases from column 1 to 2 and from column 3 to 4.
Columns 5–8 present the estimation results for private capital formation and labor growth. As in GSP, columns 5 and 7 show that the marginal tax rate with respect to GSP enters in positively, while the average tax rate enters in negatively. Therefore, the effective marginal tax rate on GSP — the tax
2
Table 1
a
Regression results
Growth in GSP Growth in Ratio of investment Growth in labor productivity to GSP
(1) (2) (3) (4) (5) (6) (7) (8)
Intercept 0.1783 0.2252 0.2477 0.2192 0.1308 0.1463 0.0675 0.0382 (0.1213) (0.1081) (0.0636) (0.0690) (0.1428) (0.1400) (0.0157) (0.0131) GSP per worker, 1977 20.0117 20.0175 20.0231 20.0205 20.0090 20.0128 20.0022 20.0011
(0.0117) (0.0100) (0.0057) (0.0066) (0.0132) (0.0133) (0.0012) (0.0012)
College, 1979 0.0758 0.0691 0.2431 0.1688
(0.0284) (0.0282) (0.0554) (0.0541)
Average tax rate with 20.4333 20.0156 20.7966 20.5359
respect to GSP (0.1676) (0.0978) (0.1959) (0.1524)
‘Marginal’ tax rate with 0.0132 20.0511 0.0536 0.1497
respect to GSP (0.0669) (0.0300) (0.0751) (0.0635)
‘Marginal’ tax rate with 20.2041 20.0067 20.2109 20.1573
respect to personal income (0.0514) (0.0255) (0.0648) (0.0553)
‘Marginal’ tax rate with 0.0105 20.0173 0.0719 0.0367
respect to general sales (0.0490) (0.0351) (0.0625) (0.0522)
Average tax rate with 20.0577 20.0270 20.0758 20.0446
respect to property (0.0211) (0.0127) (0.0263) (0.0226)
2
Adjusted R 0.0884 0.2839 0.2392 0.2686 0.3479 0.3724 0.2301 0.1732
N 48 48 48 48 48 48 48 48
a
All regressions were run using ordinary least squares (OLS). The standard errors are in parentheses and have been corrected for heteroskedasticity using the method of White (1980). The estimates on real gross state product (GSP) and labor are obtained from the Bureau of Economic Analysis (1998) and the Bureau of Labor Statistics (1998), respectively. The estimates for state-level private investment rates in physical capital are taken from Garofalo and Yamarik (1999). The human capital measure, College, is the percentage of individuals, age 25 or older, who have completed 4 or more years of college and is taken from the 1980 Census of Population.
rate used by Mullen and Williams (1994) and others — has the correct sign in only one of the four sets of regressions. Columns 6 and 8 again show that the disaggregated tax rates are more consistent with growth theory. The personal income and property tax rates enter in negatively and are significant, while the general sales tax rate is insignificant. Therefore, the results in Table 1 show that the disaggregated tax rates provide a better measure of tax distortions than the effective marginal tax rate on GSP.
5. Conclusion
Acknowledgements
Financial support is provided by the University of Akron Summer Faculty Research Fellowship, 1999. I would like to thank Robert McGuire, Mark Crain, an anonymous referee and seminar participants at the 1998 Southern Economic Association and the 1999 North American Regional Science Association meetings for all their help and suggestions. All remaining errors are, of course, my own.
References
Barro, R.J., 1997. Determinants of Economic Growth: A Cross-Country Empirical Study, The MIT Press, Cambridge. ´
Barro, R.J., Sala-ı-Martin, X., 1995. Economic Growth, McGraw Hill, New York.
Becsi, Z., 1996. Do state and local taxes affect relative state growth. Federal Reserve Bank of Atlanta Economic Review, 18–36, March /April.
Bureau of Economic Analysis, 1998. Regional Accounts Data, http: / / www.bea.doc.gov / bea / dr1.htm. Bureau of Labor Statistics, 1998. Selective Access, http: / / stats.bls.gov / 790home.htm.
Easterly, W., Rebelo, S.T., 1993. Fiscal policy and economic growth. Journal of Monetary Economics 32, 417–458. Garofalo, G., Yamarik, S., 1999. Regional Convergence, Unpublished mimeo.
Koester, R.B., Kormendi, R.C., 1989. Taxation, aggregate activity, and economic growth: cross-country evidence on some supply-side hypotheses. Economic Inquiry 27, 367–386.
Mullen, J.K., Williams, M., 1994. Marginal tax rates and state economic growth. Regional Science and Urban Economics 24, 687–705.
Stokey, N.L., Rebelo, S.T., 1995. Growth effects of flat-rate taxes. Journal of Political Economy 103, 519–550. Turnovsky, S.J., 1996. Methods of Macroeconomic Dynamics, The MIT Press, Cambridge.
White, H., 1980. A heteroscedasticity consistent covariance matrix and a direct test for heteroscedasticity. Econometrica 48, 817–838.