www.elsevier.com/locate/eja
Variability of winter rye grain yield in a glacial plain
catchment — modelling and observation
G.M. Richter *
Soil Science Department, IACR-Rothamsted, Harpenden AL5 2JQ, UK
Accepted 30 June 1999
Abstract
Crop growth of winter rye (Secale cereale) was simulated on sandy soils in northwest Germany at the meso-scale (6 km2catchment, 5 year rotation). Based on site-specific soil data, simulated grain yields (Y
MOD) were compared to
observed yields (Y
OBS), and the results were discussed with respect to the N balance. The mean annual yields simulated
for rain-fed (3.8–7.3 t/ha) and irrigated conditions (5.2–8 t/ha) varied more strongly than those observed in the region (4.6–6.0 t/ha). Excluding years with strongly deviating simulation results, the ratioY
OBS/YMODdecreased from 0.82 to
0.73 under irrigation. Spatially, the effect of plant available water (PAW ) on simulated yields varied considerably over the years, explaining 5–75% of the yield variability. In reality, yields depended on water availability (PAW+irrigation) in a year with spring drought, suggesting a time-specific water stress function. In the simulation scenario, there was ample N supply, and variable N mineralization explained 10%of the yield variability. Simulated mean N uptake and export were greater than the observed (160 vs. 140 and 112 vs. 100 kg N/ha, respectively), which may explain the overestimated growth rates. The mean harvest index varied less (0.36–0.55) than the fraction of N returned with the residues (0.17–0. 50), and irrigation decreased the variation of both. With respect to scaling methods, soil data could be aggregated, and simulations based on distributed inputs could be substituted by the weighted mean of simulations based on mean inputs. Down-scaling from the EU map created the difficulty of selecting appropriate soil units. The simple factorY
OBS/YMOD was unreliable for scaling simulated yields to assess regional
yields because of its temporal variation in response to climatic variables. The results suggest that changes in model structure and parameters are required to describe water stress, sink limitations, and N diffusion or influx rates better. © 1999 Elsevier Science B.V. All rights reserved.
Keywords:Scaling-up; Soil spatial variability; Water stress; Weather variability; Yield prediction
1. Introduction any large region. Considerable problems can arise
in transferring models and scaling-up such multi-Crop growth models are used at the field and component systems, and accurate estimates of regional scale to predict yields and the environmen- yields seem difficult to achieve by either explicit or tal impact of land use. Usually, they have been simplified simulations ( Wolf, 1997; Landau et al., calibrated on a few experimental sites for a few 1998). Macroscopically, models can reproduce the years, and their reliability has not been proved for range and variation of yields at the scale of a whole country when based on spatially distributed inputs (Butterfield et al., 1997). However, simula-* Tel.:+44-1582-763-133. fax:+44-1582-769-222.
E-mail address:[email protected] (G.M. Richter) tions overestimate observed yields under a wide
range of environmental conditions, suggesting the quantifies the effects of (1) water availability on yield and N return to the system and (2) the need for regional correction factors (de Koning
and van Diepen, 1993). This is a pragmatic, but temporal stability of these outputs under variable weather conditions. The aggregated means of indi-questionable, approach because uncertainties
con-cerning input variables, model parameters and vidual simulations are compared to mean field and regional observations, including statistical records structure (Russell and van Gardingen, 1997) are
lumped into a single factor. Searching for adequate and state-wide experiments in Northern Germany. resolution of inputs and model complexity
becomes indispensable for regional studies (Smith,
1996; Downing, 1997; van Gardingen et al., 1997). 2. Materials and methods
Further, appropriate data are needed to test the
underlying assumptions of scaling-up. The strategy of this study was to run an integ-rated crop-soil model that had been calibinteg-rated Linking crop models to distributed inputs via
Geographic Information Systems (GIS ) has great earlier for winter rye (Richter, 1996), using distrib-uted input data. For simulation, the inputs were potential not only for spatially optimizing
agricul-tural management (Bouma, 1997) and assessing supplied by a GIS in several information layers (soils, rotation, management), and the model was land-use impacts (Richter et al., 1998), but also
for model validation. Data provided on the catch- run individually for all ecotopes over a period of 5 years. The ecotopes evaluated here represent ment level will minimize erroneous model outputs
caused by input limitations and allow the adequacy combinations of crop rotation positions and crop management factors on homogeneous soil units. of the models’ structure and parameterization to
be tested. Furthermore, effects of input aggregation Comparisons of simulated and observed yields were based on field (non-homogeneous) means on the model output can be analysed. Multiple
model non-linearities might obstruct the assump- weighted by area of the ecotopes, thus validating the crop growth model on all fields in the catch-tion that the mean of all individual simulacatch-tions
equals the simulation of the mean (Addiscott and ment where yield records by farmers were available.
Mirza, 1998). Two hypotheses thus emerge from the literature, concerning the scaling of crop
models: hypothesis A suggests that detailed soil 2.1. Soil resources
data can be aggregated or drawn from an up-scaled
source without losing any precision in estimating The study was done for the Eisenbach catch-ment in Northern Germany on soils with a texture regional crop growth; hypothesis B proposes a
regional or technological correction factor that is ranging from medium-fine and loamy sand (mfS, lS) to sandy loam (sL). The area comprised about unique and temporally stable for a specific crop.
Earlier studies (de Koning and van Diepen, 1993; 500 ha of arable land that had been intensively surveyed and used previously to develop and com-Wolf, 1997) implied these assumptions, which
needed to be verified on detailed yield records at pare various models (Diekkru¨ger et al., 1995). According to the 1:1 000 000 EC soil map, the the catchment scale over a range of soils and
environmental conditions. region is dominated by Ferro-humic Podsols on wind-blown sands and Podsoluvisols on medium Two principal objectives follow from the above
regarding scaling-up: (1) to assess the necessary to medium-fine colluvium (CEC, 1985). At the 1:5000 scale, soil data were available in digital spatial resolution of the model input and (2) to
prove the validity of the underlying biophysical form describing homogeneous polygons and pro-files with a vertical resolution of 0.1 m (NLfB, principles at the larger scale. By modelling a
generalized non-N-deficient management scenario, 1991; Eckelmann and Oelkers, 1993). The soils of the catchment were grouped according to texture the general validity of the model’s inherent
func-tion for water stress is assessed over a wide range classes and volumetric water contents at field capacity (h
fc). The groupings corresponded to
humic podsols (mfS; h
fc<0.20) in the southern
part and subtypes of luvisols ( lS-sL;h
fc>0.20) in
the central and northern part of the catchment. The depth of soil accessible to plants ranged from 0.4 to 0.7 m, depending on the presence of imped-ing layers and the maximum rootimped-ing depth in sand (R
dmax=0.7 m). Plant available water (PAW ) in
the potential root zone ranged typically from 46 to 119 mm; in areas of deeply ploughed low-moor soils, where the organic matter content is large (8– 15%), PAW reached 150 mm.
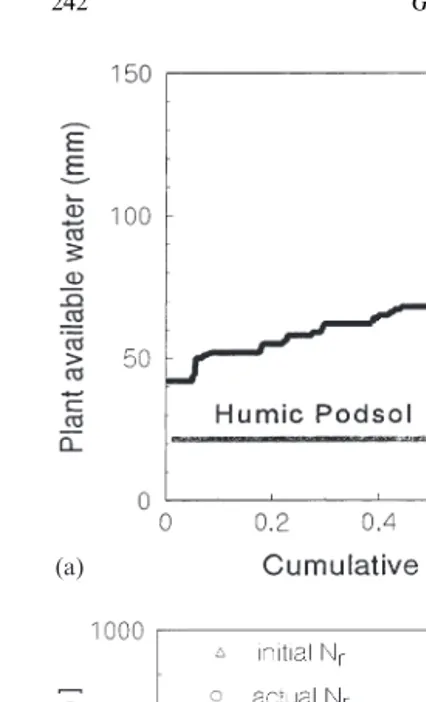
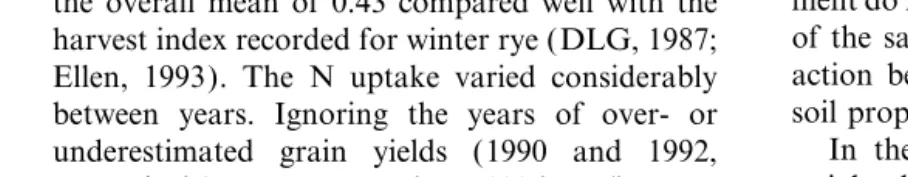
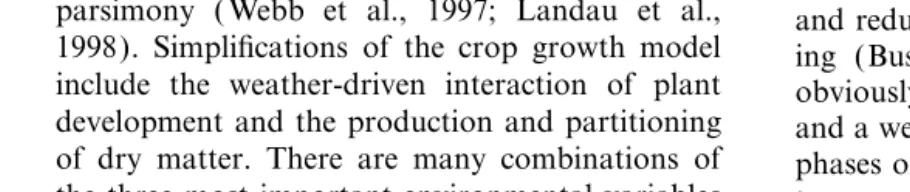
Soil and land-use maps were overlaid to identify and characterize ecotopes, giving a total of 461 polygons in the 500 ha. During the 5 years, a total of 403 simulation cases were covered by winter rye, which corresponded to a total area of 450 ha. The size of the ecotopes ranged from 0.2 to 7.6 ha, log-normally distributed [Fig. 1(a)], with a mean of 1.25 ha. The 76 fields with recorded yields had a mean size of 3.6±2 ha (range of 1–7.5 ha). For comparison of the samples of modelled vs. observed yields, PAW and yield of the fields were calculated as area-weighted averages. The field specific coefficient of variation (CV ) for PAW ranged from 5 to 50% across the catchment. For all ecotopes evaluated for winter rye in the catch-ment during the 5 year rotation, the distribution of PAW was skewed towards smaller values
Fig. 1. Frequency distributions of ecotope properties simulated [Fig. 1(b)]. The average PAW for all ecotopes was
growth of winter rye in Eisenbach catchment (1988–1992) after 83±26 mm but occurred only rarely in the catch- intersection of soil and land use maps: (a) ecotope size with a ment. The fitted distribution was bimodal, reflect- class width of 0.25 ha, and (b) plant available water
(PAW, mm). Note log-scale for (a). ing the two different soil types, which have mean
values and standard deviation for PAW of 63±9
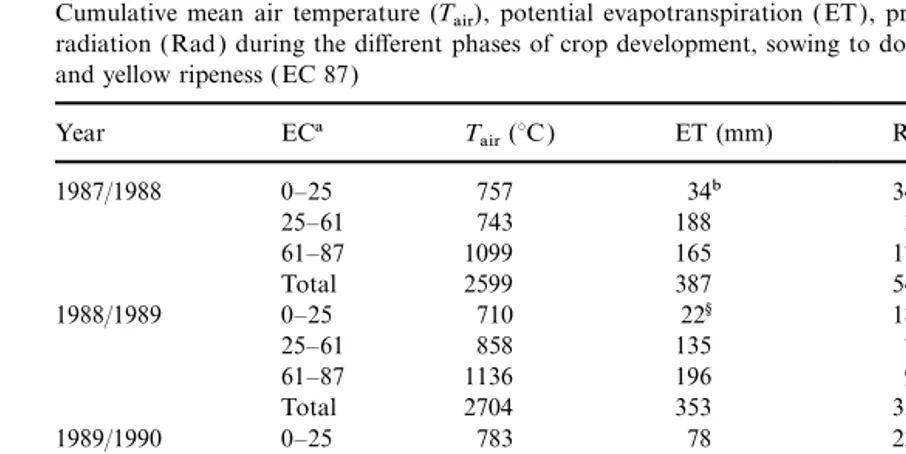
and 109±16 mm. The soil organic matter (SOM ) The frequency distributions of PAW and initial
N
rshowed that the texture classification scheme is
content in the cultivated horizon (A
p) ranged from
<1%in the recently cultivated forest soils located more differentiated than that for organic matter (Fig. 2). The actual distributions of PAW andN
r
in the southern part to values up to 15%in drained
and deep-ploughed low bog soils in the central in the sub-sample of simulated winter rye fields appear when the parameters are weighted for the part of the catchment. Converting SOM to carbon
(1/1.72) and assuming a C:N ratio of 17, a value spatial size of individual ecotopes: 60% of the modelled area had a PAW below 80 mm, whereas typical of naturally acid, ameliorated soils (McVoy
et al., 1995), the amount of potentially mineraliz- in the remaining 40%, it was more widely spread around 100 mm [Fig. 2(a)]. After the SOM content able soil organic N (N
r) was set at 13%of the total
N ( Kersebaum and Richter, 1991). It ranged from had been initialized at the mean class values, 45% of the area had an initial amount of potentially 150 to 900 kg N/ha in theA
p(0.2–0.3 m). A total
of 13 ha (<3%of the area) contained N
rcontents mineralizable N of approximately 600 kg[Fig. 2(b)]. For about 10%, SOM was classified as/ha
greater than 1000 kg N/ha. The parameters PAW andN
30%) were sown to winter rye each year, totalling about 360 ha from 1988 to 1991. Yields were recorded for total fields by the farmers and made available in a database for approximately 55% of this area; there were few (10%) yield records for 1992 (90 ha). Farmers’ records also revealed irriga-tion quantities and frequencies, ranging from 40 to 250 mm for the rye crop. The annual average irrigation quantities were 64, 86, 91 and 85 mm for the years 1988–1991. For the simulation, the crop management was generalized for all years. The sowing date of winter rye was set to 15 October and the date of harvest to 17 August. N fertilization was assumed to be constant at 155 kg N/ha given in three rates (45, 45 and 65 kg N/ha). Further information on the land use can be found in an earlier paper (Richter et al., 1998).
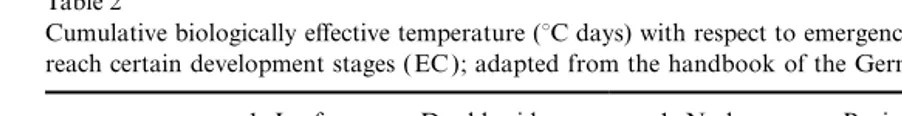
2.3. Weather conditions
Daily data for temperature, sunshine, precipita-tion, vapour pressure deficit and potential evapora-tion calculated according to Thompson et al. (1981) were taken from a weather station in the catchment. Table 1 summarizes the most important climatic driving variables accumulated during three different phases of plant development: (1)
vegeta-(a)
(b)
tive growth from sowing to double ridge ( EC 25), Fig. 2. (a) Distribution of plant available water (PAW, mm) and
(2) early reproductive growth until the beginning (b) potentially mineralizable organic N (N
r, kg N/ha) in the of anthesis ( EC 61), and (3) reproductive growth cultivation horizon (A
p) across the catchment, based on the
cumulative relative area of simulated ecotopes. from anthesis until yellow ripeness ( EC 87). The distributions of rainfall, temperature and radiation than 10%as extremely high (h5; >1000 kg N/ha) during the growth periods were distinctly different. inN
r. During the simulation, the initially discrete Winter 1987/1988 was wet with a very low rainfall
distribution ofN
rchanged into a continuous distri- in the following spring. In 1988/1989, rainfall bution, which represented the actual N
r before barely refilled the soil water storage capacity sowing of winter rye. This change was caused by during the winter and continued to be very scarce the N returned to the soil according to the
parti-up to harvest. In the third year (1989/1990), the tioning of nitrogen in the crop residues and
fertiliz-period up to anthesis was by far the warmest and ers. For details on the fractions of decomposable
sunniest of all years, and this continued until and recalcitrant nitrogen, see Richter et al. (1998).
harvest. The following 2 years were much cooler during vegetative growth, though in 1991/1992,
2.2. Land use and management
the cumulative temperature during grain filling was the highest of the 5 years, corresponding to Land-use maps showed that between 40 ha
Table 1
Cumulative mean air temperature (T
air), potential evapotranspiration ( ET ), precipitation (Rain), sunshine hours (SS) and global radiation (Rad ) during the different phases of crop development, sowing to double ridge (ECa25), beginning of anthesis (EC 61) and yellow ripeness ( EC 87)
Year ECa T
air(°C ) ET (mm) Rain (mm) SS (h) Rad (MJ/m2)
1987/1988 0–25 757 34b 343 242 518
25–61 743 188 33 476 1064
61–87 1099 165 171 381 1053
Total 2599 387 547 1100 2636
1988/1989 0–25 710 22§ 189 284 456
25–61 858 135 70 598 1301
61–87 1136 196 92 522 1255
Total 2704 353 352 1403 3012
1989/1990 0–25 783 78 228 384 505
25–61 930 201 96 634 1317
61–87 1122 207 88 453 1158
Total 2855 486 411 1470 2980
1990/1991 0–25 671 110 207 450 728
25–61 735 163 77 460 1099
61–87 953 164 130 390 976
Total 2359 437 413 1301 2802
1991/1992 0–25 667 79 238 378 591
25–61 691 172 93 380 1044
61–87 1277 262 88 546 1363
Total 2635 513 419 1304 2998
aEucarpia decimal scale for plant development (Zadoks et al., 1974). bLimited measurements due to methodological reasons (frost).
2.4. Modelling crop growth module describes photosynthesis, dry matter
pro-duction and partitioning (van Keulen et al., 1982). Plant phenology is a function of the sum of The N dynamics model MINERVA used to
simulate rye growth and yield at the catchment biologically effective temperature analogous to ARCWHEAT1 ( Weir et al., 1984). The external scale followed the concept of Kersebaum (1995).
As submodels, it contains: (1) a water balance and driving forces for the assimilation and development process are mean global radiation and air temper-water flux model based on the simple field capacity
concept, (2) a model for mineralization of two ature. Radiation was derived from daily sunshine duration using a standard method based on fractions of N in the crop residues and SOM using
first-order decay functions dependent on water daylength. Photosynthetic active radiation (PAR) is assumed to be 50% of the global radiation, and content and temperature, (3) a nitrate transport
model describing mass flux and diffusion, and (4) light penetration into the stand is a function of leaf area index, LAI (Goudriaan, 1977). The rela-a crop growth rela-and N uptrela-ake model brela-ased on the
explicit simulation of plant phenology and dry tionship between photosynthetic efficiency and mean air temperature developed by Groot (1987) matter production. The latter is described in detail
here, including its interaction with climatic and for winter wheat was adapted to account for better growth of winter rye at low temperatures soil variables. For details of the soil processes, see
the earlier descriptions of the model ( Kersebaum, ( Kavanagh, 1989). The parameters of winter rye development were adapted from the literature 1995; Richter et al., 1998) and GIS interface
(Beblik, 1996). (DLG, 1987; van Dobben 1979) and verified earlier (Richter, 1996). The sums of biologically effective The crop growth model used was a synthesis of
Table 2
Cumulative biologically effective temperature (°C days) with respect to emergence and base temperature (Base,°C ) for winter rye to reach certain development stages ( EC ); adapted from the handbook of the German Agricultural Society (DLG, 1987)
1. Leaf Double ridge 1. Node Begin of anthesis Yellow ripe Dead ripe
EC 11 25 31 61 87 92
°C days −80 250 370 700 1200 1620
Base (°C ) 1 1 1 1 −7 −10
stages of rye phenology are presented in Table 2. 2.5. Statistical analysis
The temperature requirement of rye for reaching
Outliers were eliminated (Sachs, 1980, p. 209) anthesis is 30% less than for winter wheat (van
on the basis of extreme SOM content and poorly Dobben, 1979), and the base temperature during
founded relationships between yield and high soil grain filling and maturation is also less (7 vs. 9°C ).
N mineralization rate. Simulation results of total The assimilate allocation rates into the
compart-dry matter production, yield and N uptake were ments of root, leaf, stem and ear are reported
weighted according to relative area. Weighted field elsewhere (Richter, 1996).
means were compared with farmers’ yield records, The modelled crop growth rate is limited by
regional statistics and other field trials during water and nitrogen availability. Water fluxes from
1988–1992. The performance of the model was the soil–plant system are determined by rainfall
evaluated statistically using the root mean square and potential evapotranspiration ( ET
p). ET is error (RMSE ) for modelled versus observed yields
partitioned into evaporation and transpiration
[Eq. 1) using a programme by Smith et al. (1996): according to surface cover (LAI ) and reduced to
actual rates by functions of relative water content
in the soil. The ratio of actual to potential transpi- RMSE=100
Y9
obs
S
∑ i=1
n (Y
MOD−YOBS)2/n. (1)
ration determines the reduction in growth rate
(Groot, 1987). Water uptake by the plant is deter- The overall mean yield simulated for the catch-mined by the rooting depth and root density, both ment was calculated after temporal scaling of the changing with time, and the root efficiency, which distributed simulated yields using annual correc-varies with relative water content in the respective tion factors (CF ) representing the ratio of mean soil layers. These relationships were taken observed versus mean simulated yields unchanged from studies on winter wheat (Groot, (
Y
OBS/YMOD).
1987; Whitmore and Addiscott, 1987). Nitrogen uptake is modelled as the process of convective (transpiration) and diffusive flux when the N
3. Results
demand is not fulfilled by mass flow. The N
demand is calculated from the actual dry matter 3.1. Simulated dry matter yield and plant of the total plant and the grain compartment as development
well as from the optimum N content in the plant,
which varies with growth stage. The N requirement All 403 simulation cases of winter rye growth were simulated over the 5 years for both rain-fed for winter rye has been shown to be 1% higher
during the early growth stage (-EC 31) and 1% and irrigated conditions. Without irrigation, a total mean of 7.0±1.8 t/ha of dry matter grain lower at grain filling compared to wheat (Richter,
1996). Growth reduction induced by N stress yield was simulated. After elimination of 10 outli-ers, the overall weighted mean remained essentially occurs when the N concentration in the plant falls
below a critical N concentration,N
crit, set to 75% the same ( Table 3). The yearly simulated grainyields ranged from 3.8 (1992) to 9.8 t/ha (1990),
of the maximum concentration approximated from
Table 3 The effect of irrigation on simulated yield is Variation of simulated mean winter rye grain yield,Y
MOD(t/ha), exemplified by a continuous rye rotation grown for rain-fed conditions, expressed as the coefficient of variation
on two sites with mean properties of the two major (CV ), maximum leaf area index (LAI ), harvest index (HI ) and
soil types (PAW of 62 and 106 mm, sameN r). The
N partitioning into harvest (N
harv) and residues (incl. straw, N
res) in the catchment (mean±standard deviation) scenario was based on water applications (50 mm) at the beginning of stem elongation ( EC 31, 15.04.) Y
MOD CV LAI HI Nharv Nres and grain filling (EC 71; 15.06.). The results t/ha % max. kg/ha
showed a similar average increase of yield for both 1987/1988 6.3 7 4.0 0.55 102±8 26±15 soils ( Table 4), though the increase ranged from 1988/1989 5.7 20 6.0 0.37 103±33 63±16 0.3 to 2.1 t/ha between years. The grain yields 1989/1990 9.8 16 8.6 0.47 159±25 33±17
predicted by the model overestimated the observed 1990/1991 7.3 13 7.7 0.43 118±18 46±14
yields by another 16–18%, which further reduced 1991/1992 3.8 18 4.5 0.36 61±14 62±12
the correction factor (Y
OBS/YMOD; Table 5). In
All years 7.0 26 0.43 112±40 49±21
1991, there was almost no water stress, and irriga-tion increased the yield by only 4%, whereas in 1992, the model’s estimate of yield with-variation in any one year. ‘Attainable’ yields on
out irrigation was strongly water-limited sandy soils were overestimated in 1990, but
under-(DY
MOD~1.5 t/ha). On the podsol (P), the increase
estimated in 1992. The maximum LAI varied over
due to irrigation was more than 40%, and on the time, and a simulated LAI of 8, twice that observed
podsoluvisol, it was about 28%. In 1992, irrigation in reality ( Ellen, 1993; Baron et al., 1996) may
increased the harvest index from 0.35 to 0.44, and explain some of the excess simulated dry matter
the fraction of N exported with the harvest (NHI ) production. In the original calibration (Richter,
was unchanged at 0.72, which is within the range 1996), LAI was also lower. The annual mean
of the other years. The mean yields of the catch-harvest index (HI ) varied from 0.36 to 0.55, and
ment do not coincide with the area-weighted means the overall mean of 0.43 compared well with the
of the sample means, showing the complex inter-harvest index recorded for winter rye (DLG, 1987;
action between management, rotational position, Ellen, 1993). The N uptake varied considerably
soil properties and yield. between years. Ignoring the years of over- or
In the catchment, the observed annual area-underestimated grain yields (1990 and 1992,
weighted mean yields were generally lower and respectively), on average, about 100 kg N/ha were
varied less than the simulated yields. The coeffi -exported with the harvest. At the same time, an
cient of variation over all years was approximately average of 45 kg N/ha were returned to the soil
the same as those within individual years ( Table 5), with the crop residues (N
res), consisting of straw, and both were similar to other observations on
stubble and roots. The N in the residues showed
regional yield variation (Hay et al., 1986). It is a greater temporal variation (0.17–0.50 of the total
N uptake) than the HI. notable that the farm records on yield were similar
Table 4
Comparison of simulated winter rye grain yield for two different soil types, Podsol (P) and Podsoluvisol (pL) without and with irrigation (−I/+I ), and catchment mean with irrigation (AllMean+I )
Soil 1988 1989 1990 1991 1992 MeanDY
Table 5
Variability of the mean grain yields for winter rye recorded for the county (Y
UEL; Uelzen, Statistical Yearbooka), the State Variety Trials on sandy soils (Y
LSV; Lower Saxonyb) and the catchment (YOBS; Eisenbach) and mean correction factors (YOBS/YMOD) based on simulation scenarios without (−I ) and with irrigation (+I )
Year Y
UEL YLSV YOBS CVOBS YOBS/YMOD
t/ha % −I +I
1987/1988 4.3 6.8 (6.4) 4.6 13 0.74 0.66
1988/1989 5.0 8.4 (7.6) 5.0 13 0.88 0.74
1989/1990 5.3 8.4 (7.1) 5.1 18 0.52c 0.44c
1990/1991 5.5 8.1 (7.3) 6.0 16 0.82 0.75
1991/1992 5.0 8.4 (7.5) 5.6 – 1.47c 1.08c
All years 5.0 8.0 (7.2) 5.1 16 0.81 0.72
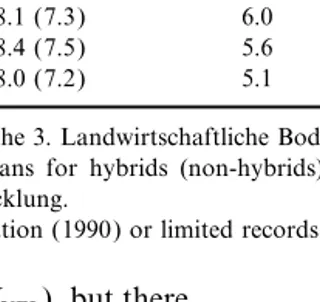
aStatistisches Bundesamt, Fachserie 3, Reihe 3. Landwirtschaftliche Bodennutzung und pflanzliche Erzeugung.
bLandessortenversuche Winterroggen, means for hybrids (non-hybrids). Landwirtschaftskammer Hannover, Fachbereich 32.4, Abtlg. Land, Gartenbau und Regionalentwicklung.
cIgnored for the mean due to model deviation (1990) or limited records (1992).
to those measured at county level (Y
UEL), but there
was a consistent difference from those of specific field trials (Y
LVS), which were on average almost
identical to the simulated yields. The mean annual ratio of observed and simulated grain yields, pro-posed as a regional correction factor (de Koning and van Diepen, 1993), obviously comprises sev-eral yield determining processes. It varied greatly with time, ranging from 0.52 (1990) to 0.88 (1989) for rain-fed conditions (−I ), and decreased with irrigation. Neglecting the years with grossly over-or underestimated crop growth (1990, 1992), CF averaged approximately 0.8. Compared to the
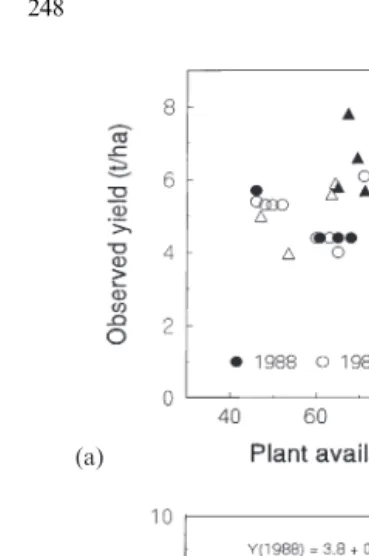
State Variety Trials, the ratio of observed and Fig. 3. Comparison of simulated and observed grain yields of modelled yield approaches unity, thus justifying winter rye (t/ha) on sandy soils during 1988, 1989 and 1991 CF as a ‘technology factor’. The lack of achieve- (n=41); RMSE in t/ha, 1:1-line showing perfect agreement. ment at the farm and county level probably
reflected suboptimal management and climate
3. ‘Attainable’ yields, defined as simulated radia-increasing harvest loss. Nevertheless, in 1990 and
tion transformation into dry matter under nutri-1992, other reasons are likely.
ent and water shortage (Rabbinge, 1993), were Ignoring 1990 and 1992, three conclusions
reached and even exceeded at a few sites, winter emerge from the comparison of individually
rye obviously being a priority crop for some observed yields and area-weighted field averages
farmers. of simulated yields (Fig. 3):
1. The simulation approximately reflected the
3.2. Spatial variability of grain yields
range of observed yields (4–8 t/ha), but accord-ing to the RMSE values, the model predictions
The effects of soil water variability on simulated were 1.6–1.9 t/ha too high.
yields are shown for rain-fed growing conditions 2. Farmers’ yield records were less well diff
erenti-in Fig. 4. All annual subsamples of simulated yield ated by fields and sometimes appeared to be
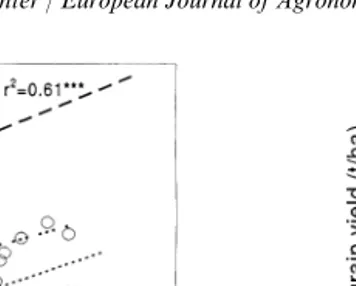
Fig. 5. Relationship between simulated yields (Y) and plant available water in the A-horizon during years with ($, 1988) Fig. 4. Relationships between winter rye grain yields (t/ha) and and without spring drought (#, 1989).
plant available water (mm) simulated for all ecotopes (n=393) in the catchment during 5 years; example of scatter for 1988
regression analysis, N
r explained 8 and 25% in
($) and 1989 (#); regression lines for the respective years
1990 and 1991, in addition to water only. The includer2values.
small influence of potentially mineralizable N on simulated yields is plausible because mineral N linear relationship being distinctly different
was not limiting in the management scenario. between years. PAW explained 60–75% of the
The yields recorded for the period 1988–1991 modelled yield variability in years with water
were analysed by regression for the effects of PAW stress, but very little (<10%) in 1988 when there
and irrigation. No dependency on average field was a good water supply. In the PAW range 46–
PAW was found for either the complete or the 146 mm, the yield increased from 5 kg DM/mm of
annual data sets [Fig. 6(a)]. PAW had no influence PAW in a wet year (1988) to 39 kg DM/mm in a
even in drier years as modelling had suggested. No dry year (1989). The simulated yield increase
overall effect of applied irrigation water on yield in kg DM/mm PAW was inversely related to
rain-was detected [Fig. 6(b); r2=0.077]. In individual fall during the period tillering to anthesis
years, irrigation significantly increased the yield in (RAIN
EC61 ; r2=0.94; p<0.01). The interaction 1988 only. Although this year was generally wet,
of simulated yield and available soil water in the
the late spring was comparatively dry ( Table 1).
A
p horizon was similar ( Fig. 5), but less clearly Multiple regression analysis for the interaction
expressed than for the whole profile. For example,
between PAW, irrigation and observed yields sug-in the dry year 1989, the r2 for the relationship
gested a negative effect of irrigation on yields for decreased greatly (0.45 vs. 0.75). This suggests
high PAW soils. This is plausible, because water that yields are limited by rooting depth, higher
logging on loamy sand increases the probability of yields being obtained where roots can extract water
disease. Irrigation may also decrease plant growth from a greater thickness of soil, especially during
by leaching N. However, in the simulation, irriga-later periods of plant growth ( EC 31–87).
tion enhanced the N-uptake and -export with the The effect of N supplied by mineralization of
harvest increasing nitrate leaching by only 8– soil organic matter and residue (N
r, kg/ha) on the 12 kg/ha/year.
variability of grain yield was about an order of magnitude less than that of PAW. As a single component, it accounted for 29–51% of the
vari-4. Discussion
ability simulated in 1989–1991, but none in the year of 1987–1988. This is possibly an artefact
tion in the ratio of observed to simulated yields. Currently discussed scaling approaches (Downing, 1997; Russell and van Gardingen, 1997) propose distributed inputs to describe lower regional yields, but it was shown here that the model still overesti-mates the catchment mean. Simulations could use aggregated inputs ( Table 6), but additional tempo-ral scaling was necessary for the means ( Table 5) and distribution of yields in the catchment (Fig. 7). The temporal variability of weather was found to be more important than the spatial variability of the soil. Both issues need further discussion with respect to data quality and model sensitivity.
Details for the soil input used in the simulation depend on the a priori knowledge of landscape complexity. The particular catchment in northwest Germany was located on the edge of heathlands and was atypically complex. Although it was domi-nated by podsols, parts were covered by fine
(a)
(b)
Fig. 6. Dependence of observed winter rye grain yield (Y, t/ha) on (a) plant available water and (b) applied irrigation water; slope of regression line in 1988 (DY/DI; tDM/ha per mm water).
Hypothesis A, that detail of soil input data may be reduced without losing information critical to the mean representation by the model, was con-firmed for all years and the overall mean of this particular catchment. However, hypothesis B, that
the output may be scaled by a regionally unique Fig. 7. Distribution of time-scaled winter rye yields (t/ha) simu-scaling factor (de Koning and van Diepen, 1993), lated across the catchment for all years (1988–1991) and single
year (1990). could not be confirmed due to considerable
varia-Table 6
Comparison of plant available water and simulated winter rye grain yield using soil survey data at different resolution; local map (1:5000) vs. EU Soil Map (1:1 000 000)+pedotransfer function (Groenendijk, 1989); scaled mean includes standard deviation in parentheses
Soil Series Area weight PAW (mm) Yield (t/ha)
1:5000 1:106 1:5000 1:106
Podsol 60% 63 50 6.3 5.7
Podsoluvisol 40% 107 129 7.5 7.2
Weighted mean 6.8 6.4
textured colluvial soils leading to very variable and (2) larger harvest losses under field conditions compared to experimental plots. This would justify drainage and nitrate-leaching rates (Richter et al.,
1998), which were bimodally distributed. However, using even a temporally variable scaling factor,
Y
OBS/YMOD, which overall was similar to that
the bimodal distribution of PAW had no effect on
the overall distribution of scaled or unscaled yields reported for wheat by de Koning and van Diepen (1993). The results from local, non-irrigated State in the catchment at any time (Fig. 7). Differences in
the unscaled mean yields of each soil type were Variety Trials were close to obtainable yields and thus support the scaling of yields for technological not significant, and scaling with a mean annual
CF had eliminated some of the individual distribu- reasons. The detected negative influence of increas-ing PAW on recorded yield can be attributed to tion patterns of unscaled yields. However, there
was no relation between the field specific annual adverse environmental effects and unfavourable microclimate leading to diseases, which were not CF and soil properties, and a mean annual CF
seemed justified. More importantly, the hydrologi- included in the model and would have been pre-vented in experimental plots.
cal sub-model using capacity parameters is
rela-tively robust, and plants are able to extract water In two of the years, the simulated yield was wrongly affected by environmental variables: in through the profile, effectively integrating PAW.
The approximate equality of the mean of the 1990 by the radiation–temperature regime, and in 1992 by the water deficit. The problems encoun-simulations and the simulation of the mean
sug-gests a linear relationship between parameters and tered in transferring a model from one crop species to another, more so from one set of soils to output (Addiscott and Mirza, 1998) in spite of
many non-linearities in the model. Mesoscopically, another, gave an insight into structural changes needed for modelling winter rye. This crop is these simulations could reproduce a plausible
range of yields (Butterfield et al., 1997) and an usually well adapted to grow on soils with low PAW. Compared to wheat, it uses 20–30% less intra-regional yield variation similar to that
observed in practice (Hay et al., 1986). water per unit dry matter produced, and a small and continuous water deficit may even enhance Scaling up the small scale soil map clearly
demanded recognition of two soil types with drought resistance and give higher yields (Bushuk, 1976). Adaptation or variable response of the different soil properties for modelling crop yields
( Table 6). Down-scaling the information from the root/shoot ratio under varying climatic conditions has not been included in this model so far. Long-large-scale map, one could not assign the soil type
distribution without prior knowledge of the catch- term field trials have shown that apart from water shortage in spring, there is no effect of water deficit ment character. The pixel resolution of the EU
soil map (0.5° ~2800 km2) created difficulties in on the yield of winter rye (Ro¨mer, 1988). It seems, therefore, that the generalized water stress function locating the validation site (6 km2) within either
of these pixels. The final decision about the impor- derived earlier for wheat (Groot, 1987) needs to be modified and seasonally weighted for rye. tant soil properties then becomes an ‘either … or’
decision, which may lead to a difference of 100% As 10% of the simulated yield variation could be attributed to variable N mineralization, there in relevant soil properties (Richter and Addiscott,
1998). As with simulation at the national scale was some N stress with respect to potential yield, in spite of ample N fertilizer application. However, (Butterfield et al., 1997), knowledge of soil-type
distribution within a region became important for the model overestimated uptake rate and did not exert sufficient N stress to reduce dry matter the model output at the catchment scale.
Scaling up of the output is a concession to the production. Correct description of the uptake of mineral N from the soil remains a key issue. The unknown deviation of modelling results from
observations in environments different from that root system of winter rye is very dense (Dittmer, 1937; Ellen, 1993), but little quantitative knowl-of the site knowl-of model calibration. Basically,
‘down-scaling’ yields from experimental sites to farmers edge exists about its soil–root interaction with respect to nutrient uptake efficiency in physically fields is justified for two reasons only: (1)
et al., 1993). High residual nitrate levels after ature during vegetative growth ( EC 28–61) were much higher than in other years ( Table 1), and harvest in sandy soils (Richter et al., 1998) support
the overestimation of yield was also favoured by the suggestion that the actual N uptake is smaller
a long grain filling period. The underestimated in coarse, than in fine, textured soils (Stark, 1994)
yields of 1992, partly due to water shortage and in turn limits potential growth.
(Table 4), could also be explained by short periods The simulated N returned with the residues
for grain filling and pre-anthesis growth ( Table 7). (50 kg/ha) seems sufficient to equilibrate organic
Overall, plant development and dry matter pro-matter loss under row crops and meet the
require-duction constitute a complex interactive system, ments for sustainability of the cropping system.
with more than 20 parameters related to assimila-The mean N balance in this region was based on
tion and assimilate partitioning. Such models need an average N export of 65 kg N/ha with an average
long-term calibration, even though their parameter winter rye yield of 4.5 t/ha ( Kleeberg et al., 1993).
sets could be diminished by parsimonious struc-This corresponded to less than 1.5% N in the rye
tural changes. grain, which, according to Ruhrstickstoff (1993),
These results suggest two structural changes of is far below average. From the lower and upper
the model. First, model robustness should be limits of observed yields and N concentrations
enhanced by introducing sink limitations. A preset (4.6–6 t/ha with 15–25 kg N/t), the N export
maximum leaf area will prevent excessive pro-would average 100 kg N/ha (range 59–
duction of biomass as in 1990. Although justified 128 kg N/ha). This is slightly less than the
mod-by diverse plant architecture, this procedure may elled value (112 ±40 kg N/ha). The
underesti-cause problems in different environments (Landau mated N
min contents at harvest again confirm the et al., 1998). A more mechanistic approach is the need for model refinement with regard to N introduction of a leaf death rate dependent on uptake. temperature and light competition. Likewise, the However, there is a justified call for model number of flowers and grains per ear can be limited parsimony ( Webb et al., 1997; Landau et al., and reduced by adverse conditions during flower-1998). Simplifications of the crop growth model ing (Bushuk, 1976). Second, transpiration was include the weather-driven interaction of plant obviously not a yield limiting factor for winter rye, development and the production and partitioning and a weighting factor for water stress at different of dry matter. There are many combinations of phases of crop development should be introduced the three most important environmental variables to account for the crop’s sensitivity to this. during the three major growth phases, even if one
expresses climate only as low, medium or high for
rain, radiation and temperature. In 1989/1990, 5. Conclusions
phenological development of winter rye ( Table 7)
was optimal according to long-term observations The simulation scenario and its comparison to observed yields allow several conclusions with (Ro¨mer, 1988). However, radiation and
temper-Table 7
Stages of phenological development for winter rye — simulated dates of entry and length of periods (days) for early reproductive (pre-anthesis; EC 25–61) and late reproductive growth (post-anthesis; EC 61–87)
Year Decimal development stage — EC Pre-
Post-11 25 31 61 87 anthesis (days)
1987/1988 30.10. 29.3. 20.4. 1.6. 11.7. 64 41
1988/1989 29.10. 8.3. 9.4. 29.5. 6.7. 82 39
1989/1990 26.10. 5.3. 1.4. 27.5. 9.7. 83 43
1990/1991 17.11. 2.4. 26.4. 15.6. 18.7. 75 34
respect to (a) regionalization and scaling-up, and landscape and regional level’; FAIR-BM-975118). The substantial data set was compiled within the (b) model reliability.
(a) Generally, the temporal variation of climatic Special Collaboration Project (SFB 179) supported by the German Science Foundation (DFG) at the model inputs affected simulated crop growth
within a catchment more than spatial variation Technical University in Braunschweig. Special thanks are extended to Mr K.J. Schmalstieg for of soils. With respect to regionalization, the
method of scaling-up the model output using accessing the data bank. I am also grateful to many colleagues at IACR-Rothamsted for their a correction factor (Y
OBS/YMOD) is questionable
because of its temporal variability (see below). interest and helpful discussion. There are three conclusions for scaling-up of
model inputs:
1. For a known distribution of soil types in a
References
catchment, the area-weighted average of yield simulations based on mean soil properties
Addiscott, T.M., Mirza, N.A., 1998. Modelling contaminant equals the weighted mean of the individual
transport at catchment or regional scale. Agric. Ecosyst. simulated values. Environ. 67, 211–221.
2. Using data from an up-scaled source, like the Baron, V.S., Destremy, E.A., Salmon, D.F., Dick, A.C., 1996. Adaptation of winter cereal species to shade and competi-EU soil map, created the a priori difficulty of
tion in a winter/spring cereal forage mixture. Can. J. Plant locating the catchment on the map. Using a
Sci. 76, 251–257. pedotransfer function to obtain the plant
avail-Beblik, A.J., 1996. Description of the N-dynamics Simulation able water content of each soil series, the area- Model ‘Minerva’ in: Nitrate leaching from arable soils into weighted average yields were very similar. Based the groundwater of differently contaminated catchments typical for Lower Saxony Germany. Final Report, BEO on one major soil type only, the mean PAW
No. 0339121 C Ministry of Science and Technology, 5–32., and yields were either over- or underestimated.
in German. 3. Model calibration should be performed for a
Bouma, J., 1997. Precision agriculture: introduction to the spat-series of years to account for the variability of ial and temporal variability of the environment. In: Lake, essential climatic driving forces. J. V. et al., ( Eds.), Precision agriculture: introduction to the spatial and temporal variability of environmental quality. (b) The results call for an increased effort with
CIBA Foundation, Wiley, Chichester, UK, pp. 5–14. respect to development of the model,
concern-Butterfield, R.E., Harrison, P.A., Orr, J., Gawith, M., Van der ing its structure and parameterization. The
Meer, F.B., 1997. Modelling climate change impacts on yield-reducing mechanisms used do not affect wheat potato and grape vine in Great Britain. In: yields of winter rye in reality, as they overrate Butterfield, R.E. et al., ( Eds.), Climate Change Climatic Variability and Agriculture in Europe: An Integrated N-uptake and the effects of water availability
Assessment. Annual Report 1997, Environment Programme on growth in the main growing season, but
CEC. University of Oxford, Oxford, pp. 201–216. do not identify yield-limiting water shortages
Bushuk, W., 1976. Rye Production Chemistry and Technology. in spring. Overall, the larger temporal variabil- American Association of Cereal Chemists, St. Paul, MN. ity of the modelled compared to observed CEC, 1985. Soil Map of the European Communities 1:1 000
000. ECSC, EEC, EAEC, Brussels–Luxembourg. yields suggests that a more robust model is
de Koning, G.H.J., van Diepen, C.A., 1993. Crop Production required, which includes sink and rate
limita-Potential of Rural Areas Within the European Communities tions for dry matter production and nitrogen
IV: Potential, Water Limited and Actual Crop Production. uptake. Report W68. Netherlands Scientific Council for
Govern-ment Policy, The Hague.
Diekkru¨ger, B., So¨ndgerath, D., Kersebaum, K.C., McVoy, C.W., 1995. Validity of agroecosystem models: a
compari-Acknowledgements
son of results of different models applied to the same data set. Ecol. Model. 81, 3–29.
For financial support, I thank the European Dittmer, H.J., 1937. A quantitative study of roots and root Commission (‘Scaling crop growth models to pre- hairs of a winter rye plant (Secale cereale). Am. J. Bot.
DLG, 1987. In: Kuhlmann, F. ( Ed.), Pflichtenheft fu¨r die BK25, Blatt 3129 ‘Wieren’, Nieders. Landesamt f. Boden-forschung, Hannover. http//:www.bgr.de
Datenverarbeitung im Pflanzenbau, ( Ed.)
Rabbinge, R., 1993. The ecological background of food pro-Downing, T.E., 1997. Climate change, climatic variability and
duction. In: Chadwick, D.J., Marsh, J. ( Eds.), Crop protec-agriculture in Europe: Study aims and methodology. In:
tion and sustainable agriculture Ciba Foundation Butterfield, R.E. (Ed.), Climate Change, Climatic
Variabil-Symposium 17. Wiley, Chichester, UK, pp. 2–29. ity and Agriculture in Europe. An Integrated Assessment.
Richter, G.M., 1996. Calibration of a plant growth model for Annual Report, January–December 1997, Environment
winter rye in: Nitrate Leaching from Arable Soils into the Programme CEC, University of Oxford, 3–14.
Groundwater of Differently Contaminated Catchments Eckelmann, W., Oelkers, K.H., 1993. in: Bodeneigenschaften,
Typical for Lower Saxony Germany. Final Report, BEO Profil- und Fla¨chenvariabilita¨t, Einfluß auf die Wasser- und
No. 0339121 C, Ministry of Science and Technology, Stoffdynamik von Bo¨den. Forschungsbericht zum
Teilpro-177–197., in German. jekt B2 des SFB 179 ‘Wasser- und Stoffdynamik in
Agrar-Richter, G.M., Addiscott, T.M., 1998. in: Temporal and spatial O¨ kosystemen’, 617–636.
up-scaling of agro-ecological simulation models — implica-Ellen, J., 1993. Growth yield and composition of 4 winter
cere-tions for sustainability studies. Eur. Soc. Agron. 5th Con-als. 1. Biomass grain yield and yield formation. Neth.
gress, Nitra, Slovak Republic, Short Communications J. Agric. Sci. 41, 153–165.
Vol. II., 103–104. Goss, M.J., Miller, M.H., Bailey, L.D., Grant, C.A., 1993. Root
Richter, G.M., Beblik, A.J., Schmalstieg, K.J., Richter, O., growth and distribution in relation to nutrient availability
1998. N-dynamics and nitrate leaching under rotational and and uptake. Eur. J. Agron. 2, 57–67.
continuous set-aside — a case study at the field and catch-Goudriaan, J., 1977. Crop micrometeorology: a simulation
ment scale. Agric. Ecosyst. Environ. 68, 125–138. study. Pudoc, centre of agricultural publishing and
docu-Ro¨mer, G., 1988 Die pha¨nologischen Phasen bei Hafer, Som-mentation, Wageningen.
mergerste, Winterroggen und Mais und ihre Beziehung zur Groenendijk, H., 1989. Estimation of the Water Holding
Capac-Witterung und Ertragsbildung. Dissertation, Berlin, Techn. ity of Soils in Europe The Compilation of a Soil Data Set.
Universita¨t, FB Internationale Agrarentwicklung. Simulation Report CABO-TT Nr. 19, Wageningen.
1993. Faustzahlen fu¨r Landwirtschaft und Gartenbau Hydro Groot, J.J.R., 1987. Simulation of Nitrogen Balance in a System
Agri Du¨lmen. Landwirtschaftsverlag, Mu¨nster-Hiltrup. of Winter Wheat and Soil. Simulation Report CABO-TT
Russell, G., van Gardingen, P.R., 1997. Problems with using 13. Centre for Agrobiological Research and Department of
models to predict regional crop production. In: van Gar-Theoretical Production Ecology, Agricultural University,
dingen, P.R.et al., (Eds.), Scaling Up. Cambridge University Wageningen.
Press, Cambridge, pp. 273–294. Hay, R.K.M., Galashan, S., Russell, G., 1986. The yields of
Sachs, L., 1980. Angewandte Statistik. Springer, Berlin. arable crops in Scotland 1987–92. Res. Dev. Agric. 2,
Smith, J., 1996. Models and scale: up - and down-scaling in: 159–164.
Stein, A., Penning de Vries, F.W.T., Schotman, P.J. ( Eds.), Kavanagh, S.E., 1989. Low temperature growth and frost toler- Models in Action Proc. Seminar Series Quant. Approaches
ance of winter rye and perennial ryegrass. Dissertation, Uni- Syst. Anal. Vol. 6., 25–41.
versity of Newcastle, UK Abstracts International B, Science Smith, J., Smith, P., Addiscott, T., 1996. Quantitative methods and Engineering, 52, 3370B–3371B. to evaluate and compare Soil Organic Matter (SOM ) Kersebaum, K.C., Richter, J., 1991. Modelling nitrogen models in: Evaluation of Soil Organic Matter Models, Powl-dynamics in a plant–soil system with a simple model for son, D.S., Smith, P., Smith, J. ( Eds.), NATO ASI Series advisory purposes. Fert. Res. 27, 273–281. Vol. I., 38, 181–199.
Kersebaum, K.C., 1995. Application of a simple management Stark, J.M., 1994. Causes of soil nutrient heterogeneity at model to simulate water and nitrogen dynamics. Ecol. different scales. In: Caldwell, M.M., Pearcy, R.W. ( Eds.), Model. 81, 145–156. Exploitation of Environmental Heterogeneity by Plants. Kleeberg, P., Sauerbeck, D., Ku¨cke, M., 1993. Na¨hrstoffhaus- Academic Press, New York, pp. 255–284.
halt landwirtschaftlicher Wassereinzugsgebiete in Abha¨ngig- Thompson, N., Barrie, I.A., Ayles, M., 1981. The Meteorologi-keit von Standort und Nutzungseigenschaften in: cal Office Rainfall and Evaporation Calculation System: Forschungsbericht 1991–93, SFB 179, 431–471. MORECS (July 1981). Meteorological Office, Bracknell, Landau, S., Mitchell, R.A.C., Barnett, V., Colls, J.J., Craigon, UK.
J., Moore, K.L., Payne, R.W., 1998. Testing winter wheat Troughton, A., 1962. The Roots of Temperate Cereals ( Wheat, simulation models’ predictions against observed UK grain Barley, Oats and Rye) Mimeogr. Publ. No. 2, Common-yields. Agric. For. Meteorol. 89, 85–99. wealth Bureau of Pastures and Field Crops. CAB, Hurley, McVoy, C.W., Kersebaum, K.C., Arning, M., Kleeberg, P., UK.
Othmer, H., Schro¨der, U., 1995. A data set from north Ger- van Dobben, W.H., 1979. Anpassingen bij het milieu. In: Alb-many for the validation of agroecosystem models: documen- erda, Th. ( Ed.), De groene aarde Aula-boek 250. Het tation and evaluation. Ecol. Model. 81, 265–297. Spectrum, Utrecht/Antwerpen, pp. 313–396.
Scaling-up: From Cell to Landscape. Cambridge University Whitmore, A.P., Addiscott, T.M., 1987. A function for describ-ing nitrogen uptake, dry matter and rootdescrib-ing by wheat crops. Press, Cambridge.
van Keulen, H., Penning de Vries, F.W.T., Drees, E.M., 1982. Plant Soil 101, 51–60.
Wolf, J., 1997. Modeling climate change impacts on potato A summary model for crop growth. In: Penning de Vries,
F.W.T., van Laar, H.H. ( Eds.), Simulation of Plant Growth growth in Central England in: Climate Change, Climatic Variability and Agriculture in Europe. An Integrated and Crop Production, 87–97.
Webb, C.R., Werker, A.R., Gilliagan, C.A., 1997. Modelling Assessment. Annual Report, January–December 1997, Environment Programme CEC. University of Oxford, the dynamical component of the sugar beet crop. Ann. Bot.
80, 427–436. Oxford, pp. 177–197.
Zadoks, J.C., Chang, T.T., Konzak, C.F., 1974. A decimal code Weir, A.H., Bragg, P.L., Porter, J.R., Rayner, J.H., 1984. A