L
Journal of Experimental Marine Biology and Ecology 244 (2000) 45–65
www.elsevier.nl / locate / jembe
Determination of protein for studies of marine herbivory:
a comparison of methods
*
D.J. Crossman , K.D. Clements, G.J.S. Cooper
School of Biological Sciences, University of Auckland, Private Bag 90219, Auckland, New Zealand Received 24 April 1999; received in revised form 21 June 1999; accepted 18 August 1999
Abstract
In this study we compared techniques for the estimation of protein for studies of marine herbivory. As an example we use gut fluid from the temperate marine herbivorous fish Kyphosus sydneyanus. There were two components to this work: (1) to compare the ability of spectro-photometric methods to estimate protein in gut fluid; and (2) to determine the effect of freezing digesta samples on the extraction of gut fluid for the measurement of total hydrolysable amino acids (THAA). The Bradford, Lowry, deoxycholate / trichloroacetic acid (DOC / TCA) Lowry and the bicinchoninic acid (BCA) spectrophotometric protein assays were compared for their ability to estimate protein in pooled gut fluid and compared with protein determined by quantitative amino acid analysis using an automated procedure. The spectrophotometric assays all gave differing estimates of protein content and none correlated well with quantitative amino acid analysis. The Lowry and BCA methods gave similar estimates of protein, which were higher than those measured in the same samples by amino acid analysis. Both the DOC / TCA Lowry and the Bradford assay substantially underestimated protein in pooled gut fluid. Internal standard recovery experiments for the protein assays showed interference of colour formation in the Bradford method but not the other spectrophotometric protein assays. This suggested the low values in the Bradford assay were due to gut fluid interfering with colour formation. Therefore, five algal species known to occur in the diet of Kyphosus sydneyanus were selected to test for their interference in the Bradford assay. The algae included three species of phaeophytes, one rhodophyte and one chlorophyte. Extracts from all five algal species interfered with this protein assay to significant but varying degrees. Two methods of extracting gut fluid were compared: (i) method A, which involved removing the gut fluid from the digesta immediately post capture; and (ii) method B, in which samples of digesta were frozen and gut fluid removed later. The fluid from method B gave significantly higher levels of THAA in some gut segments. Freeze–thawing of digesta in method B was thought to be the basis of the increased THAA. This finding suggests that method A more accurately reflects in vivo gut fluid THAA concentrations. The above methodolo-gy provides a framework to compare the ability of different herbivorous species at extracting
*Corresponding author. Tel.: 164-9-373-7599 ext. 8483; fax: 164-9-373-7414.
E-mail address: [email protected] (D.J. Crossman)
THAA from their diet. These results highlight that the estimation of protein can be affected by methodology and by sample composition, and shows that methods must be optimized for a particular application. 2000 Elsevier Science B.V. All rights reserved.
Keywords: Algae; Amino acid analysis; Interference; Nitrogen; Protein assays; Herbivorous fish
1. Introduction
The measurement of dietary nitrogen is probably one of the most important indicators of diet quality, especially as nitrogen is argued to be a limiting nutrient (Horn, 1989; Choat, 1991; White, 1993). Vertebrates receive the majority of their nitrogen require-ments from dietary proteins, peptides and amino acids. Proteins and peptides are digested by endogenous proteases to amino acids, which can then be absorbed across the gut mucosa and into the bloodstream (Stevens and Hume, 1995). However, in the marine herbivory literature total nitrogen (total N) is often used as a measure of nitrogen nutrition without considering its molecular form (e.g. Horn, 1989; Galetto and Bellwood, 1994; Wilson and Bellwood, 1997). This raises the question of what is actually being measured. Total N has been used to estimate protein in algae using the conversion factor of 6.25 (e.g. Mouradi-Givernaud et al., 1993; Fleurence et al., 1995; Gomez and Westermeier, 1995; Westermeier and Gomez, 1996), but this will overestimate protein if samples contain high levels of non-protein nitrogen (Gnaiger and Bitterlich, 1984;
¨ ¨ ¨
Izhaki, 1993; Mayer et al., 1995; Salo-Vaananen and Koivistoinen, 1996). Marine algae can contain substantial and variable amounts of non-amino acid nitrogen (e.g. Cowie and Hedges, 1992a; Chapman and Craigie, 1977) which could lead to large errors in protein estimated with this method. For example, the inorganic nitrate content of the macroalga
Laminaria longicruris can comprise 2.1% of its dry weight in winter, but be
undetectable in mid to late summer (Chapman and Craigie, 1977).
appropriate standard (Zamer et al., 1989; Berges et al., 1993). However, in general the colour formation properties of proteins being measured are unknown. Thus these assays give relative differences in protein concentration and not absolute values (Peterson, 1983; Davis, 1988; Berges et al., 1993). Many common laboratory reagents are not compatible with different assays and these need to be considered when selecting an assay system (Peterson, 1983; Smith et al., 1985; Davis, 1988). It is also possible that the samples being measured contain compounds that can interfere with the assays (Matto et al., 1987; Harrison and Thomas, 1988).
The present study has two main aims: (1) to compare the ability of the Lowry, deoxycholate / trichloroacetic acid (DOC / TCA) Lowry, BCA and Bradford assays at estimating protein in gut fluid relative to protein concentration determined by amino acid analysis; and (2) to compare two methods of sample preparation for gut fluid from a herbivorous fish. We wanted to accurately measure the amino acid content of the fluid
1
fraction of the digesta in different regions of the gastrointestinal tract. This should give information on the processing of nutritionally available dietary nitrogen.
The study species chosen for this work was the temperate marine herbivorous fish
Kyphosus sydneyanus. Although the diet has been described in this species there is very
little information on its nutritional content. This herbivore eats almost exclusively macroalgae, predominantly phaeophytes but also rhodophytes and chlorophytes, and virtually no animal material (Rimmer and Wiebe, 1987; Clements and Choat, 1997). The presence of symbiotic microbiota in its gut (Rimmer and Wiebe, 1987) and relatively high levels of short chain fatty acids in the posterior intestine suggest that microbial fermentation plays a role in the digestion of algae (Rimmer and Wiebe, 1987; Clements, 1997; Clements and Choat, 1997).
The first objective of this work was to compare and contrast methods of estimating protein concentrations in extracts derived from algae (gut fluid). The purpose of this was to determine whether different methods gave similar results. If methods differ this has implications for how protein should be measured, and for our ability to reliably compare studies that use different methods. Protein determination by quantitative amino acid analysis enables comparison between the colourimetric protein assays. Internal standard recovery experiments with BSA were used to assess negative interference (inhibition of colour formation) of the protein assays by gut fluid. Known quantities of BSA were added to samples and recovery determined by subtracting background protein levels from estimates obtained after addition of BSA. Poor recoveries of standard protein were obtained from the Bradford assay. To locate the source of this interference similar experiments were carried out on five species of algae known to occur in the diet of
Kyphosus sydneyanus from the Mokohinau Islands (Vial, 1997), the collection site for
this study. These results highlight assay- and species-specific problems in estimating protein content of algal extracts and in the gut fluid of fish. We postulate that the difficulties observed in fish gut fluid are caused, at least in part, by their content of algae-derived inhibitory substances.
The second objective of this work was to examine methods of extracting gut fluid.
1
Before nutrients such as protein can be digested and absorbed they first need to be extracted from the solids into the fluid fraction of the digesta. For this reason the change in concentration of total hydrolysable amino acids (THAA – which includes protein, peptides and free amino acids) was assessed in the fluid along the gut in segments I–V, following the procedure of Clements and Choat (1997). This gave a comparative framework in which the levels of THAA made available for digestion and assimilation could be measured and compared to those found in the diet. Two methods of sample processing were examined to determine the most appropriate method of removing gut fluid: (A) gut fluid was removed immediately post-capture; or (B) whole gut content was removed, frozen and the gut fluid removed later, by the method of Clements and Choat (1997) with minor modification. It was hypothesized that, in method B, freeze–thawing may cause lysis of food and microbial cells and give artificially elevated THAA concentrations.
2. Materials and methods
2.1. Sample collection and processing
Samples were collected from the Mokohinau Islands in the Hauraki Gulf, New
Zealand (1758069E, 358559S), using the University of Auckland’s research vessel, RV
Proteus. Specimens of Kyphosus sydneyanus were collected by spear from subtidal reefs. Fish specimens were processed immediately following capture, the gastrointestinal tract dissected out and organized into five gut segments, labelled I–V (Clements and Choat, 1997), with segment V representing the hindgut chamber. Two methods were used to sample gut fluid in each of the five gut segments from five fish specimens. In method A, an incision was made at each gut segment and digesta was spooned into Eppendorf
tubes. Tubes were centrifuged (Eppendorf 5414 centrifuge, 12 0003g, 5–10 min) until
a clear supernatant was obtained. Supernatant samples were filtered (0.2mm polysulfone
syringe filters, Whatman PuradiscE 25 AS). Samples were then frozen and stored at
2208C until analysis. In method B, unprocessed digesta from the same specimens were
spooned from each gut segment and placed directly into vials and frozen at 2208C.
These samples were later thawed and centrifuged, filtered and stored as in method A. This generated a sample size of five for each segment I–IV and a sample size of four for segment V for both methods. Segment V could not be collected from one specimen due to damage from the spear. Material from three specimens processed by method B was pooled for protein assay comparisons.
Stomach content samples from the five K. sydneyanus specimens were also collected for assessment of dietary THAA, starch, free glucose, lipid, dry matter content and ash. Triplicate samples of the algae Carpophyllum angustifolium, Lessonia variegata,
Ecklonia radiata, Gigartina macrocarpa and Ulva sp. were collected from the same
location, for assessment of interference in the Bradford assay. Stomach contents and
algal samples were placed at 2208C immediately following collection. In the laboratory
frozen stomach contents and algae were dried to constant weight with a Dura-DryE
percentage dry weight. The dried material was then ground to a fine powder in a ball
mill (Retsch mixer mill MM2) and stored desiccated at 2208C. All mass measurements
were determined to the nearest 0.01 mg on an analytical balance (Mettler AE 163, Mettler Instrumente, Greifensee, Switzerland). Proteins were extracted by accurately weighing approximately 20 mg of ground sample into eppendorf tubes and adding 0.6
ml of 1 M NaOH. For the algal species material was weighed to an accuracy of 2060.25
mg. Tubes were then mixed by vortexing and placed on a rocker for at least 12 h
(Montgomery and Gerking, 1980). After extraction, tubes were centrifuged (12 0003g,
5 min) to pellet particulate material, and supernatants removed for amino acid analysis or for Bradford assays. Frozen material was analysed between 4 and 22 months after collection. Protein assay comparisons were all completed on the same day and the amino acid analysis for this section of the work within a month of the protein assays. For the freeze–thawing experiments on gut fluid the delay between the amino acid analysis of the first sample and the last was less than a month.
2.2. Analytical procedures
2.2.1. Ash, lipid and starch analysis
Ash content of dried stomach contents was determined by combusting 25 mg samples
at 5008C in a Kotter kiln overnight. Lipid was determined gravimetrically in a procedure
modified from Folch et al. (1957). Samples of dried stomach contents (40 mg) were
mixed in 100 ml water and 1.5 ml of chloroform / methanol (1:2, v / v) and left to stand
(10 min, 48C). These were then centrifuged and supernatants removed. A further 1.5 ml
of chloroform / methanol (2:1, v / v) was added to the pellets and samples processed as before. The two supernatants were pooled, 0.95 ml of 0.7% (w / v) NaCl solution added,
the samples mixed thoroughly, then left to stand (30 min, 48C). Samples were then
centrifuged and a measured portion of the lower chloroform / methanol phase removed and placed into pre-weighed glass vials. The chloroform was evaporated in a vacuum dessicator, and the vials re-weighed to determine lipid content. Starch content was determined using the DMSO starch assay (Megazyme, County Wicklow, Ireland), (McCleary et al., 1981). Free glucose content of digested samples was determined using a modification of an assay based on hexokinase (Bergmeyer et al., 1974), (Sigma, St. Louis, MO). The modification was necessary because the glucose assay method (based on glucose oxidase) used in the Megazyme kit has been found to underestimate glucose in starch determinations of some algae (L. Zemke-White, pers. commun.). Samples with water were also run to control for background absorbance. Maize starch was fully recovered when added as an internal control. Free glucose was determined by incubating
20 mg samples in 1.5 ml 80% v / v ethanol in an 858C water bath in air tight tubes for 5
min. Tubes were cooled, centrifuged and glucose measured as above.
2.2.2. Amino acid analysis
2.2.2.1. Hydrolysis
Samples were hydrolysed on a PICO?TAGEWork Station (Waters, Milford, MA). In
Hz, 16 m) for 3320 s periods (Soniprep 150, MSE, Crawly, UK) to suspend any precipitated material. However, preliminary analysis of samples with and without sonication showed no measurable difference suggesting a negligible protein content of the precipitate. Samples were either used directly, or diluted in MilliQ water and 1%
trifluoroacetic acid (v / v) then sonicated for another 3320 s. The samples were mixed
and an aliquot immediately loaded into hydrolysis tubes. Stomach content samples extracted with 1 M NaOH were loaded directly into hydrolysis tubes along with an equal volume of 1 M HCl to neutralise the NaOH. All hydrolysis tubes were loaded with a fixed amount of norleucine, used as an internal recovery standard. One of every 12 hydrolysis tubes contained a BSA standard, and another was left blank. This enabled the measurement of hydrolysis and the detection of contamination. After the sample tubes were loaded into hydrolysis vials they were dried by evaporation. Samples were hydrolysed in the gas phase with 6 M HCl, 1% phenol (w / v) under nitrogen vacuum at
1508C for 60 min, with subsequent removal of residual HCl. Samples were then
21
redissolved in 0.25 mg ml K EDTA water and passed through a 0.453 mm syringe filter
(Satorius Minisart RC 4).
2.2.2.2. Derivatization
Aliquots of redissolved samples were derivatized with phenylisothiocyanate (PITC) and quantified by reverse phase HPLC (Heinrikson and Meredith, 1984) using an amino acid analyser (Applied Biosystems 421). This system automates the derivatization of amino acids and the transfer of their phenylthiocarbamyl derivatives to a 172 microbore HPLC for separation and quantification. Amino acid content of unknowns was determined using standard curves for each amino acid (A-2908 Amino Acid Standard Solution, Sigma). Data were collected and processed using Model 600 data analysis software (Applied Biosystems).
2.2.2.3. Free amino acids
21
Gut fluid samples were diluted in 0.25 mg ml K EDTA water, with norleucine as3
an internal standard, and filtered (0.45mm) aliquots were analysed directly. Total free
amino acid content was quantified, representing the sum of all the protein amino acids. Levels of glutamine could not be measured due to a co-eluting peak, but this should only cause a small underestimation of total free amino acids. Protein determined by amino acid analysis was calculated by subtracting free amino acids from THAA. This will include all proteinaceous material down to the size of dipeptides. The standard error for
2 2
protein calculated this way was determined as follows: SEP5œ(SETHAA1 SEFAA),
where P is protein, THAA is total hydrolysable amino acids, and FAA is total free amino acids.
2.2.3. Protein assays
2.2.3.1. Bradford microassay
Diluted gut fluid samples (1:3, v / v) of 10 or 200ml were adjusted to 0.8 ml in water,
to which 0.2 ml of dye concentrate (Biorad) was added. These were then mixed by vortex and left to stand at room temperature for at least 5 min before measurement of absorbance at 595 nm (UV-1601 spectrophotometer, Shimadzu, Tokyo, Japan).
2.2.3.2. Bicinchoninic acid microtiter plate assay
Diluted gut fluid samples (1:3, v / v) of 10ml were brought to a final volume of 20ml
with water, to which 200 ml of working solution (Pierce, [ 23225) was added in
microtiter plates, which were covered and incubated for 30 min at 378C. Plates were
then read at 562 nm (SPECTRAmaxE340, Molecular Devices Corporation, CA, USA).
2.2.3.3. Lowry assay
The Lowry microassay as described by Peterson (1983) was used. Diluted gut fluid
samples (1:3, v / v) of 10 ml were brought to a volume of 0.4 ml, to which 0.4 ml of
reagent A was added, mixed and allowed to stand for 10 min at room temperature. Next 0.2 ml of reagent B was added and immediately mixed. Samples were read after 30 min at 750 nm (UV-1601 spectrophotometer, Shimadzu, Tokyo, Japan).
2.2.3.4. Deoxycholate /trichloroacetic acid (DOC /TCA) precipitation
Samples containing 10 or 120 ml of diluted gut fluid (1:3, v / v) were brought to final
volume of 1 ml with water and precipitated as in Peterson (1977). The Lowry microassay was performed directly on the precipitate.
2.2.4. Recovery of protein standards
Fluid from each gut segment was analysed in triplicate, as were samples of gut fluid to which known amounts of BSA had been added. The absolute recovery of BSA was determined by subtracting amino acids or protein estimated in the gut fluid from amino acids or protein estimated in gut fluid with added BSA. Recovery was then compared with amino acid analysis or protein assays of BSA standards of the same quantity as that
2 2
added. Standard errors were determined as follows: SEr5œ(SEs1 SE ), where r isss
recovered internal standard, s is the sample and ss is the sample with added BSA. For recovery experiments all protein assays used the same amounts of gut fluid and of added
21
BSA (10ml of gut fluid diluted 1:3 v / v in water, to which 10ml of 0.5 mg ml [or 5
mg] BSA was added). For amino acid recoveries 40 ml of gut fluid (diluted 1:9 v / v in
water for segments I and V and 1:19 v / v for segments II, III and IV) was hydrolysed
21
with addition of 10 ml of 0.3 mg ml (or 3 mg) BSA as internal standard. For
assessment of interference of algal material with the Bradford assay, 10 ml of NaOH
21
extract and 10ml of 0.5 mg ml (or 5 mg) of BSA standard were used. NaOH at the
2.3. Statistical analysis
A series of two-tailed Student’s t-tests was used to test for differences between internal standard and recoveries of this internal standard in different gut segments using
a Bonferroni correction (P35). Differences between protein estimated by amino acid
analysis and the spectrophotometric assays were tested by series of two-tailed Student’s
t-tests, with Bonferroni correction (P34). Analysis of variance (ANOVA) and Tukey’s honest significance difference (HSD) were used to test for differences between internal standard and recoveries from algal extracts. Two-way ANOVA was used to test for differences between method and gut segment. Planned comparisons were used to test differences between method at each segment as it was predicted a priori that method B would give higher THAA values. Tukey’s HSD (for unequal n) was used to test for differences between segments as there was no prior prediction of the trend of THAA along the gut.
3. Results
3.1. Protein assays
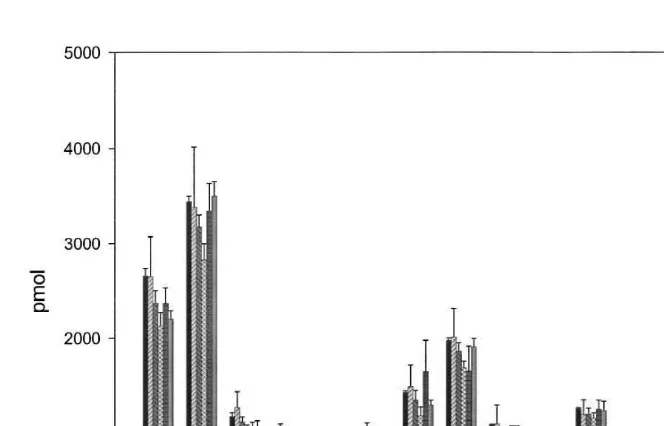
Experiments with internal standards were used to assess interference in the protein assays. These showed that, in gut fluid samples from one fish specimen extracted by method A, there was substantial negative interference with the Bradford assay (results not shown). When this experiment was repeated, but amino acid analysis was employed to detect the internal standard, full recovery of the BSA standard was obtained
(Student’s t-test: p.0.1). There were, however, significantly (Student’s t-test: * p,
0.05) lower recoveries of certain individual amino acids (see Fig. 1): glycine in segment III, arginine in segments III, IV and V, proline in segments II and III, and tyrosine in segments IV. This led us to pool material from three fish specimens processed by method B for the purpose of comparing the ability of Lowry, DOC / TCA Lowry, BCA and Bradford assays to estimate protein concentrations. These assays showed no significant
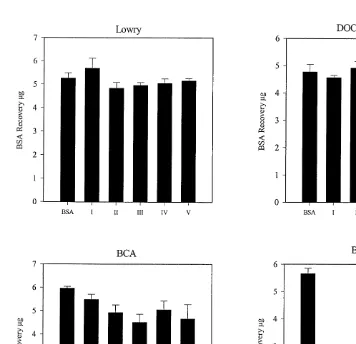
differences (Student’s t-test: p.0.05) between absolute recovery of BSA from gut fluid
and analysis of the same amount of neat BSA, except for the Bradford assay in which
lower recoveries were recorded (Student’s t-test: *** p,0.001, see Fig. 2). Protein
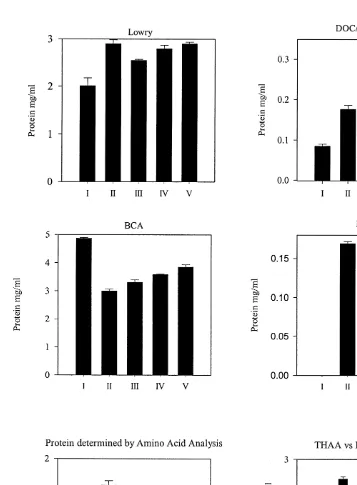
concentrations determined by these assays were compared to protein concentrations determined by amino acid analysis (Fig. 3), which were derived by subtraction of free amino acids from THAA. The levels of THAA versus free amino acids are also shown in Fig. 3. Both the Bradford and DOC / TCA Lowry methods gave values of protein
substantially lower (Student’s t-test * p,0.05) than those determined by amino acid
analysis. The BCA and normal Lowry assay gave protein values higher (Student’s t-test
* p,0.05) than protein determined by amino acid analysis.
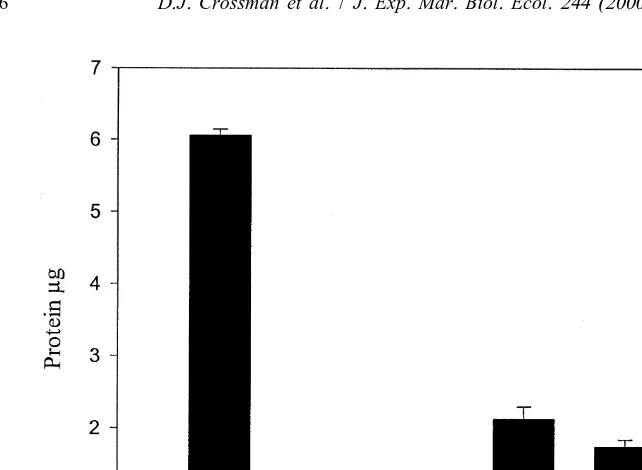
The effects of five species of dietary algae on protein estimation by the Bradford method are presented in Fig. 4. Extracts from all five species of algae significantly
(Tukey’s HSD, *** p,0.001) interfered with the Bradford assay, but to varying
Fig. 1. Amino acid analysis showing recovery of BSA internal standard, in the gut fluid of one Kyphosus
sydneyanus fish specimen processed by method A. BSA, analysis of a 3mg BSA standard. I–V, recovery of 3
mg BSA internal standard added to gut fluid from segments I–V. Recoveries were determined by analysing samples of gut fluid with (n53) and without (n53) added BSA and subtracting values of samples, from samples with added BSA. Error bars represent S.E.M. Asx, aspartic acid and asparagine; Glx, glutamic acid and glutamine; Ser, serine; Gly, glycine; His, histidine; Arg, arginine; Thr, threonine; Ala, alanine; Pro, proline; Tyr, tyrosine; Val, valine; Met, methionine; Ile, Isoleucine; Leu, leucine; Phe, phenylalanine; Lys, lysine.
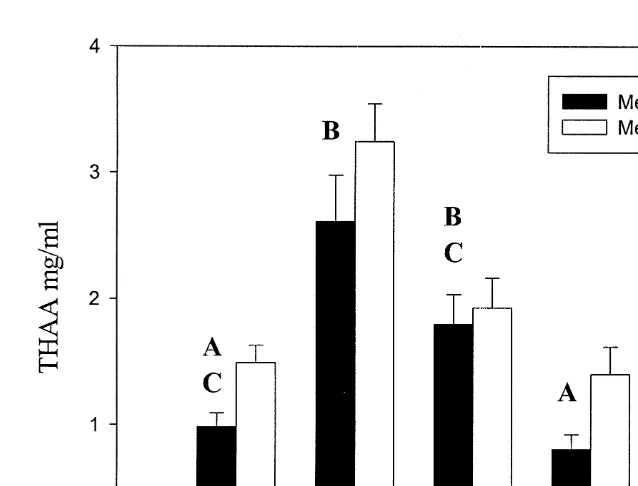
3.2. Gut fluid extraction methods
The levels of THAA found in gut fluid of Kyphosus sydneyanus for the two extraction methods A (removal of gut fluid from digesta immediately post capture) and B (removal of gut fluid from frozen digesta) are presented in Fig. 5. Two-way ANOVA (independent
variables were method and gut segment, and dependent variable log [THAA]) showed10
that there were significance differences (*** p,0.001) between the methods. Planned
comparisons were used to locate which segments had significantly higher THAA, as it was predicted prior to the experiment that method B would give higher THAA values.
Segments I, IV and V had significantly higher THAA values using method B ( p50.044,
0.011, 0.0007, respectively), whereas no significant difference between the methods was found for segments II and III. There were significant differences between the gut
segments (two-way ANOVA, *** p,0.001). Tukey’s HSD test for unequal n was used
Fig. 2. Protein assays showing recovery of BSA internal standard in pooled gut fluid from three Kyphosus
sydneyanus specimens processed by method B. BSA, analysis of a 5 mg BSA standard (n53). I–V, the recovery of 5mg BSA added to gut fluid from segments I–V. Recoveries were determined by analysing samples of gut fluid with (n53) and without (n53) BSA and subtracting values of samples, from samples with added BSA. Error bars represent S.E.M.
3.3. Nutrient analysis
Results of the nutritional analysis of Kyphosus sydneyanus stomach contents are
presented in Table 1. THAA made up 9.060.9% of the dry weight of the stomach
digesta and was the largest of the organic components measured, followed by lipid
4.260.6, starch 3.660.6 and free glucose 1.060.1%. The dried stomach contents
contained 81.961.4% organic matter (as determined by combustion) with the measured
Fig. 4. Bradford assays showing recovery of BSA internal standard in NaOH extracts of algae (n5three individuals). BSA, analysis of a 5mg BSA standard (n53). Ca, Carpophyllum angustifolium; Lv, Lessonia
variegata; Er, Ecklonia radiata; Gm, Gigartina macrocarpa; U, Ulva sp. denote the recoveries of 5mg BSA from the respective algal extracts. Recoveries were determined by analysing samples of gut fluid with (n53) and without (n53) BSA and subtracting values of samples, from samples with added BSA. Error bars represent S.E.M.
4. Discussion
Two main conclusions can be drawn from this work: (1) different methodologies of protein estimation gave markedly different results; and (2) prior freezing of digesta samples affected measurement of THAA in gut fluid. These conclusions will be discussed separately.
4.1. Methods of protein estimation
Fig. 5. THAA content in the gut fluid in different sections of the alimentary tract of Kyphosus sydneyanus (n55 for I–IV, n54 for V). Method A gut fluid was removed immediately after capture by centrifuging digesta and filtering the supernatant. Method B samples were processed in the same manner as in method A, except whole digesta was frozen and processed later in the laboratory. Capital letters above each bar for method A represent Tukey’s HSD groupings, where values with the same letter are not significantly different ( p.0.05). Error bars represent S.E.M.
means of verifying protein concentration was used. Zamer et al. (1989) used CHN analysis to independently verify protein concentration in sea anemones, however this would be inappropriate in samples containing large amounts of non-protein nitrogen such as marine algae (e.g. Chapman and Craigie, 1977; Cowie and Hedges, 1992a). Peters et al. (1982) recommended the use of amino acid analysis for standardizing the Lowry for estimating membrane proteins. In this study we have used protein determined
Table 1
Nutritional analysis of K. sydneyanus stomach contents
¯
N X S.E.
THAA (% dry weight) 5 9.0 0.9
Starch (% dry weight) 5 3.6 1.2
Free glucose (% dry weight) 5 1.0 0.1
Lipid (% dry weight) 4 4.2 0.6
Ash (% dry weight) 5 19.1 1.4
D
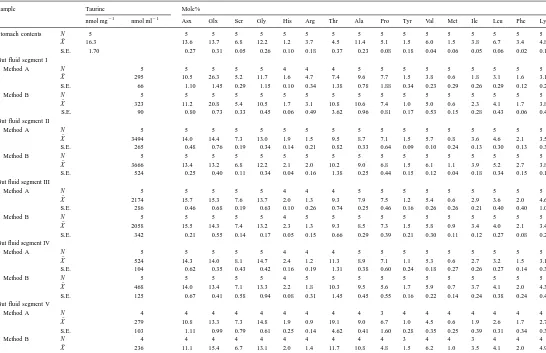
Mole% of protein amino acids and taurine concentrations in the stomach contents and gut fluid of Kyphosus sydneyanus
Sample Taurine Mole%
21 21
nmol mg nmol ml Asx Glx Ser Gly His Arg Thr Ala Pro Tyr Val Met Ile Leu Phe Lys
by amino acid analysis to provide a benchmark to which spectrophotometric assays can be compared.
The measurement of THAA includes protein, peptides and free amino acids. In some cases the free amino acid content of the diet may be large, as in the case of the cichlid fish Sarotherodon mossambicus (Bowen, 1980). In such cases, THAA gives a better measure of nutritionally significant nitrogen than protein. However, for examining the analytical accuracy of spectrophotometric protein assays we wanted to examine protein content. Therefore, free amino acids were subtracted from THAA to give an estimate of the protein and peptide content in samples.
Amino acid analysis is generally considered to be an accurate analytical method (Heinrikson and Meredith, 1984). However, loss of specific amino acids during analysis was encountered in a study that measured amino acids in marine sediments (Cowie and Hedges, 1992b). To solve this problem, Cowie and Hedges (1992b) used a method of internal standardization with charge-matched recovery standards, which are non-protein amino acids that were spiked into samples before hydrolysis to control for the loss of different classes of protein amino acids (e.g. acidic, neutral and basic). Cowie and
Hedges (1992b) were thus able to determine most protein amino acids within610% of
expected values. Their method of amino acid measurement utilized pre-column derivatization with o-phthaldialdehyde (OPA) and separation of OPA derivatives by reversed phase HPLC. The method used in the present study utilized pre-column derivatization with phenylisothiocyanate (PITC) and the separation of the resulting PITC derivatives by reversed phase HPLC. This has the advantage of detecting proline that is not measured by the OPA method. However, acidic and basic charge-matched recovery standards were not able to be resolved cleanly in our chromatograms, and therefore were not used in our study. The neutral recovery standard norleucine was used as proxy for all amino acids in this study.
The accuracy of our method of amino acid analysis was tested using internal standardization experiments (with BSA) on gut fluid samples from Kyphosus
sydneyanus. These demonstrated that there were no significant differences between total
amount of BSA recovered and that added to samples. Analysis at the amino acid level did show occasional loss of some amino acids, but this was minor. Over-estimation due to positive interference is unlikely in amino acid analysis as individual amino acid derivatives are resolved by reversed phase HPLC before determination.
of the time involved in multiple standard curves and the severe levels of interference found in our samples suggest that the use of another assay is preferable.
A possible explanation for the interference detected with the Bradford assay is that some algal compounds bind to the same sites on proteins as Coomassie Brilliant Blue G-250. This would cause a decreased sensitivity of the Bradford reagent. Matto et al. (1987) found that ‘under non-reducing conditions’ the Bradford assay under-estimated protein in plant homogenates rich in phenols and phenolases. This was thought to be caused by polyquinones (generated by the oxidation of phenolics) binding proteins and reducing optimal dye binding. Brown algae contain polyphenolic secondary metabolites that are widely interpreted as herbivore deterrents (Targett and Arnold, 1998). These phlorotannins are thought to bind to macromolecules under acidic conditions (Targett and Arnold, 1998), and could be responsible for adverse effects in the Bradford assay. However, both Gigartina macrocarpa (Red algae) and Ulva sp. (Green algae) interfered with the Bradford assay, suggesting that interference is not an exclusive property of brown algae.
The protein assays all gave different estimates of protein in the gut fluid. The DOC / TCA Lowry precipitation method and the Bradford assay substantially under-estimated protein in gut fluid when compared to protein determined by amino acid analysis. In the DOC / TCA Lowry method, a good recovery of the BSA internal standard was obtained, ruling out negative interference in this assay. This suggests that the DOC / TCA Lowry method did not precipitate all the peptide material in the gut fluid. Mayer et al. (1997) showed there was a substantial low molecular weight amino acid pool that was not precipitated by 10% TCA in the gut fluid of echinoderms and polychaetes. Low molecular weight peptides may not be precipitated by the DOC / TCA method, although the molecular weight cut-off point for this method has not been established in the literature. These peptides may make up the majority of protein material in the gut fluid and hence explain the low levels of protein detected by the DOC / TCA Lowry method. The Bradford method cannot measure peptide material below approximately 6–21 residues depending on amino acid sequences (Mayer et al., 1986). However, the low recovery of the BSA internal standard in this method suggests that the low estimates were due to algal compounds inhibiting colour formation.
The Lowry and BCA methods showed good recovery of BSA internal standards and gave fairly similar results except for gut fluid from segment I. However, estimates of protein using these methods were higher than and did not accurately follow the trend along the five gut segments determined by amino acid analysis. This could be because BSA and gut fluid proteins differ in their reactivity with the reagents, but BSA tends to underestimate protein when used as a standard (Harrison and Thomas, 1988; Zamer et al., 1989; Berges et al., 1993). Samples may also contain compounds that absorb at the same wavelength as the Lowry and BCA methods, but at the assay concentrations used in the present study, background absorbances were negligible (at 750 nm for the Lowry and 562 nm for BCA). This leaves the possibility that compounds found in the samples reacted with the reagents and gave falsely high values. The basis of both the Lowry and
21 1
BCA methods is the reduction of Cu to Cu by peptide bonds and cysteine, tyrosine,
21
reactive residues will also reduce Cu (Peterson, 1978; Wiechelman et al., 1988) and
may contribute to the values we obtained. Other possibilities include lipids and reducing sugars (Kessler and Fanestil, 1986; Brown et al., 1989). Brown algal polyphenolics could also contribute, especially as the reduction of phosphomolybdic–phosphotungstic acids are used to detect both protein (Lowry assay) and polyphenolics (Folin–Denis assay) (Lowry et al., 1951; Davis, 1988; Targett and Arnold, 1998).
4.2. Gut fluid THAA and nutrient analysis of the diet
The removal of gut fluid by method B gave significantly higher values of THAA than method A, for segments I, IV and V. In this method samples of digesta were frozen and later thawed before processing. This freeze–thawing process probably caused the rupture of algal and microbial cells leading to the higher THAA levels. Rupture of algal cells would be the most likely source of increased THAA in segment I, as algal fragments were found to be largely intact upon sampling. By contrast, the increased THAA in segments IV and V was probably derived from lysed microbial cells, as the posterior intestine contains high densities of microbes (Rimmer and Wiebe, 1987). These results suggest that gut fluid should be removed from digesta prior to freezing in order to more closely reflect the in vivo levels of THAA in gut fluid.
The trend of THAA in gut fluid from method A reveals biological information about the processing of assimilable nitrogen by Kyphosus sydneyanus. Levels of THAA in gut fluid result from three processes: (a) extraction of dietary protein into gut fluid; (b) digestion of protein and absorption of amino acids across the gut wall into the blood stream or by gut flora; and (c) non-dietary protein derived from digestive enzymes and dead gut cells. The highest levels of THAA were found in segment II. Subsequent gut segments showed a consistent decline in THAA. This suggests that the majority of THAA is extracted from the solids in the anterior intestine, and that most THAA is removed from the gut fluid by the time the digesta reaches the posterior intestine. These findings imply that the main site of protein digestion is the anterior intestine. The decline of THAA in the gut fluid by the time digesta reaches the posterior intestine is the result of assimilation by the host fish and the gut flora. The most likely scenario is that K.
sydneyanus maximizes its absorption of amino acids in the anterior intestine, and
microbial symbionts found in the posterior intestine (Rimmer and Wiebe, 1987) metabolize most of the remaining THAA. This would avoid competition for THAA between host and symbionts. Microbial symbionts may also be able to utilize non-protein nitrogen sources, such as ammonia, that are unavailable to the host (Stevens and Hume, 1995). In ruminants digestion of rumen flora provides a significant fraction of the host’s protein (Stevens and Hume, 1995). However, our results suggest this is unlikely in K. sydneyanus, as no peak of THAA in the posterior intestine consistent with digestion of microbial cells was observed.
Montgomery and Gerking, 1980; Zemke-White and Clements, 1999) and provide an upper limit of these nutrients available in the diet of K. sydneyanus. The methodology used in this study provides a simple procedure for harvesting the diets of herbivorous fishes for nutritional analysis. This would be especially helpful in species of ‘nominal’ herbivorous fish, such as scarids, in which dietary targets are particulate and heteroge-neous, and thus not well characterized (Choat and Clements, 1998). Therefore collecting representative diets from the environment for these fish would be difficult.
The measured organic components in the stomach contents represent nutrients potentially available to K. sydneyanus through endogenous digestion. Vertebrates have the necessary enzymes to digest and assimilate protein, starch, and lipid (Stevens and Hume, 1995). These components accounted for 22% of the organic matter in the stomach samples from K. sydneyanus. The majority of the other 78% of organic matter
is probably made up ofb-linked algal polysaccharides which are resistant to endogenous
enzymes, but may serve as substrates for fermentation by gastrointestinal micro-organisms (Clements and Choat, 1997).
5. Conclusions
Nutritional analysis of dietary nitrogen requires careful selection of appropriate techniques. Assessment of total N will in many cases include a non-assimilable nitrogen component, and as such will overestimate nutritionally significant nitrogen. Some protein assays are insensitive to free amino acids, and thus underestimate nutritionally significant nitrogen. Although amino acid analysis is a time consuming and expensive procedure, it gives the most accurate measure of nutritionally significant nitrogen as it estimates both protein and free amino acids. Spectrophotometric protein assays are simple, inexpensive methods of protein determination that are widely used for marine samples. They rely on a number of basic assumptions: (1) that the protein chosen for the standard curve matches colour formation by sample proteins; (2) that the samples do not interfere with the assay; and (3) that the reaction mechanism is specific to protein. All of these assumptions can potentially be violated. Indeed the latter two assumptions were shown to be violated in gut fluid samples for one or more of the protein assays examined in this study. Therefore the validity of these assumptions should be tested before one of these methods is used in a new application. Comparing the reactivity of known amounts of sample proteins with the standard can test the first assumption. The second assumption can be tested through internal standardization experiments. Ideally, results obtained using spectrophotometric methods should be validated by comparison with results of amino acid analysis.
Acknowledgements
advice on statistics. The manuscript was greatly improved by comments from Howard Choat and two anonymous reviewers [SS].
References
Berges, J.A., Fisher, A.E., Harrison, P.J., 1993. A comparison of Lowry, Bradford and Smith protein assays using different standards and protein isolated from the marine diatom Thalassiosira pseudonana. Mar. Biol. 115, 187–193.
Bergmeyer, H.U., Bernt, E., Schmidt, F., Stork, H., 1974. D-Glucose determination with hexokinase and
glucose-phosphate dehydrogenase. In: Bergmeyer, H.U. (Ed.), Methods of Enzymatic Analysis, Academic Press, New York, pp. 1196–1201.
Bowen, S.H., 1980. Detrital nonprotein amino acids are the key to rapid growth of Tilapia in Lake Valencia, Venezuela. Science 207, 1216–1218.
Bradford, M.M., 1976. A rapid and sensitive method for the quantification of microgram quantities of protein utilizing the principle of protein-dye binding. Anal. Biochem. 72, 248–254.
Brown, R.E., Jarvis, K.L., Hyland, K.J., 1989. Protein measurement using bicinchoninic acid: elimination of interfering substances. Anal. Biochem. 180, 136–139.
Chapman, A.R.O., Craigie, J.S., 1977. Seasonal growth in Laminaria longicruris: Relations with dissolved inorganic nutrients and internal reserves of nitrogen. Mar. Biol. 40, 197–205.
Choat, J.H., 1991. The biology of herbivorus fishes on coral reefs. In: Sale, P.F. (Ed.), The Ecology of Fishes On Coral Reefs, Academic Press, San Diego.
Choat, J.H., Clements, K.D., 1998. Vertebrate herbivores in marine and terrestrial environments: A nutritional ecology perspective. Annu. Rev. Ecol. Syst. 29, 375–403.
Chu, F.E., Casey, B.B., 1986. A comparison of protein assays for oyster larval proteins using two different standards. Mar. Chem. 19, 1–7.
Clayton, J.R., Dortch, Q., Thoresen, S.S., Ahmed, S.I., 1988. Evaluation of methods for the separation of proteins and free amino acids in phytoplankton samples. J. Plankton Res. 10, 341–358.
Clements, K.D., 1997. Fermentation and gastrointestinal microorganisms in fishes. In: Mackie, R.I., White, B.A. (Eds.), Ecology and Physiology of Gastrointestinal Microbes, Chapman and Hall, London, pp. 156–198.
Clements, K.D., Choat, J.H., 1997. Comparison of herbivory in the closely-related marine fish genera Girella and Kyphosus. Mar. Biol. 127, 579–586.
Cowie, G.L., Hedges, J.I., 1992a. Sources and reactivities of amino acids in a coastal marine environment. Limnol. Oceanogr. 37, 703–724.
Cowie, G.L., Hedges, J.I., 1992b. Improved amino acid quantification in environmental samples: charge-matched recovery standards and reduced analysis time. Mar. Chem. 37, 223–238.
Davis, E.M., 1988. Protein assays: a review of common techniques. Am. Biotechnol. Lab. 6, 28–37. Fleurence, J., Coeur, C.L., Mabeau, S., Maurice, M., Landrein, A., 1995. Comparison of different extractive
procedures for proteins from the edible seaweeds Ulva rigida and Ulva rotundata. J. Appl. Phycol. 7, 577–582.
Folch, J., Lees, M., Sloane, G.Y., 1957. A simple method for the isolation and purification of total lipids from animal tissues. J. Biol. Chem. 226, 497–507.
Fris, M.B., Horn, M.H., 1993. Effects of diets of different protein content on food consumption, gut retention, protein, and growth of Cebidichthys violaceus (Girard), an herbivorous fish of temperate zone marine waters. J. Exp. Mar. Biol. Ecol. 166, 185–202.
Galetto, M.J., Bellwood, D.R., 1994. Digestion of algae by Stegases nigricans and Amphiprion akindynos (Pisces: Pomacentidae), with an evaluation of methods used in digestibility studies. J. Fish Biol. 44, 415–428.
Gomez, I., Westermeier, R., 1995. Energy contents and organic constituents in Antarctic and south Chilean brown algae. Polar Biol. 15, 597–602.
Harrison, P.J., Thomas, T.E., 1988. Biomass measurements: protein determination. In: Lobban, C.S., Chapman, D.J., Kremer, B.P. (Eds.), Experimental Phycology, Cambridge University Press, Cambridge, pp. 27–34. Heinrikson, R.L., Meredith, S.C., 1984. Amino acid analysis by reverse-phase high-performance liquid
chromatography: precolumn derivatization with phenylisothiocyanate. Anal. Biochem. 136, 65–74. Horn, M.H., 1989. Biology of marine herbivorous fishes. Oceanogr. Mar. Biol. Annu. Rev. 27, 167–272. Horn, M.H., Mailhiot, K.F., Fris, M.B., McClanahan, L.L., 1995. Growth, consumption, assimilation and
excretion in the marine herbivorous fish Cebidichthys violaceus (Girard) fed natural and high protein diets. J. Exp. Mar. Biol. Ecol. 190, 97–108.
Izhaki, I., 1993. Influence of nonprotein nitrogen on estimation of protein from total nitrogen in fleshy fruits. J. Chem. Ecol. 19, 2605–2615.
Kaehler, S., Kennish, R., 1996. Summer and winter comparison in the nutritional value of marine macroalgae from Hong Kong. Bot. Mar. 39, 11–17.
Kessler, R.J., Fanestil, D.D., 1986. Interference by lipids in the determination of protein using bicinchoninic acid. Anal. Biochem. 159, 138–142.
Kochert, G., 1978. Protein determination by dye binding. In: Hellebust, J.A., Craigie, J.S. (Eds.), Handbook of Phycological Methods: Physiological and Biochemical Methods, Cambridge University Press, Cambridge, pp. 91–93.
Lawrence, J.M., McClintock, J.B., 1988. Allocation of organic material and energy to the holdfast, stipe, and fronds in Postelsia palmaeformis (Phaeophyta: Laminariales) on the California coast. Mar. Biol. 99, 151–155.
Lowry, O.H., Rosebrough, N.J., Farr, A., Randell, R., 1951. Protein measurement with Folin-phenol reagent. J. Biol. Chem. 193, 265–275.
Matto, R.l., Ishaq, M., Saleemuddin, M., 1987. Protein assay by coomassie brilliant blue G-250-binding method is unsuitable for plant tissues rich in phenols and phenolases. Anal. Biochem. 163, 376–384. Mayer, L.M., Schick, L.L., Sawyer, T., Plante, C.J., Jumars, P.A., Self, R.L., 1995. Bioavailable amino acids in
sediments: A biomimetic, kinetics-based approach. Limnol. Oceanogr. 40, 511–520.
Mayer, L.M., Schick, L.l., Self, R.F.L., Jumars, P.A., Findlay, R.H., Chen, Z., Sampson, S., 1997. Digestive environments of benthic macroinvertebrate guts: Enzymes, surfactants and dissolved organic matter. J. Mar. Res. 55, 785–812.
Mayer, L.M., Schick, L.l., Setchell, F.W., 1986. Measurement of protein in nearsure marine sediments. Mar. Ecol. Prog. Ser. 30, 159–165.
McCleary, B.V., Solah, V., Gibson, T.S., 1981. Quantitative measurement of total starch in cereals, flours and products. J. Cereal Sci. 20, 51–58.
Montgomery, W.L., Gerking, S.D., 1980. Marine macroalgae as foods for fishes: an evaluation of potential food quality. Environ. Biol. Fishes 5, 143–153.
Mouradi-Givernaud, A., Givernaud, T., Morvan, H., Cosson, J., 1993. Annual variations of the biochemical composition of Gelidium latifolium Thuret et Bornet. Hydrobiologia 260 / 261, 607–612.
Neighbours, M.A., Horn, M.H., 1991. Nutritional quality of macrophytes eaten and not eaten by two temperate-zone herbivorous fishes: a multivariate comparison. Mar. Biol. 108, 471–476.
Nguyen, R.T., Harvey, H.N., 1994. A rapid micro-scale method for the extraction and analysis of protein in marine samples. Mar. Chem. 45, 1–14.
Peters, W.H.M., Fleuren-Jakobs, A.M.M., Kamps, K.M.P., Pont, J.J.H., Bonting, S.L., 1982. Lowry protein determination on membrane preparations: Need for standardization by amino acid analysis. Anal. Biochem. 124, 349–352.
Peterson, G.L., 1977. A simplification of the protein assay method of Lowry et al. which is generally more applicable. Anal. Biochem. 83, 346–356.
Peterson, G.L., 1978. Review of the Folin phenol protein quantification method of Lowry, Rosenbrough, Farr and Randall. Anal. Biochem. 100, 201–220.
Peterson, G.L., 1983. Determination of total protein. Methods Enzymol. 91, 95–119.
¨ ¨ ¨
Salo-Vaananen, P.P., Koivistoinen, P.E., 1996. Determination of protein in foods: comparison of net protein and crude protein (Nx6.25) values. Food Chem. 57, 27–31.
Setchell, F.W., 1981. Particulate protein measurement on oceanographic samples by dye binding. Mar. Chem. 10, 301–313.
Smith, P.L., Krohn, R.I., Hermanson, G.T., Mallia, A.K., Gartner, F.H., Provenzano, M.D., Fujimoto, E.K., Goeke, N.M., Olson, B.J., Klenk, D.C., 1985. Measurement of protein using bicinchoninic acid. Anal. Biochem. 150, 76–85.
Stevens, C.E., Hume, I.D., 1995. Comparative Physiology of the Vertebrate Digestive System, 2nd ed, Cambridge University Press, Cambridge.
Sturm, E.A., Horn, M.H., 1998. Food habits, gut morphology and pH, and assimilation efficiency of the Zebra Perch Hermosilla azurea, an herbivorous kyphosid fish of temperate marine waters. Mar. Biol. 132, 512–522.
Targett, N.M., Arnold, T., 1998. Predicting the effects of brown algal phlorotannins on marine herbivores in tropical and temperate oceans. J. Phycol. 34, 195–205.
Vial, T.H., 1997. The comparative feeding biology of two temperate water herbivorous fish, silver drummer,
Kyphousus sydneyanus,and parore, Girella tricuspidata. Masters Thesis. University of Auckland.
Westermeier, R., Gomez, I., 1996. Biomass, energy contents and major organic compounds in the brown alga
Lessonia nigrescens (Laminariales Phaeophyceae) from Mehum, South Chile. Bot. Mar. 39, 553–559.
White, T.C.R., 1993. The Inadequate Environment: Nitrogen and the Abundance of Animals, Springer, Berlin. Wiechelman, K.J., Braun, R.D., Fitzpatrick, J.D., 1988. Investigation of the bicinchoninic acid protein assay:
identification of the groups responsible for color formation. Anal. Biochem. 175, 231–237.
Wilson, S., Bellwood, D.R., 1997. Cryptic dietary components of territorial damselfishes (Pomacentridae Labroidei). Mar. Ecol. Prog. Ser. 153, 299–310.
Zamer, W.E., Shick, J.M., Tapley, D.W., 1989. Protein measurement and energetic considerations: Comparisons of biochemical and stoichiometric methods using bovine serum albumin and protein isolated from sea anemones. Limnol. Oceanogr. 34, 256–263.