Strategic Behavior in the International Burley
Tobacco Market
Orlando D. Chambers, Tobacco and Health Research Institute, University of Kentucky Michael R. Reed and William M. Snell, University of Kentucky
This note uses an international trade model to investigate the competitiveness of the world burley tobacco market. Results support the contention that governments can take advantage of market imperfections to shift rents to the domestic economy. Both tariffs and quotas lead to larger domestic welfare compared to baseline results. However, a lowering of the price support lead to similar overall welfare increases without the retaliatory responses by competitors. 2000 Society for Policy Modeling. Published by Elsevier Science Inc.
Key Words: Burley tobacco; Calibration; Strategic trade theory; Welfare analysis.
1. INTRODUCTION
This economic note examines the theoretical and empirical justi-fications for government intervention in the U.S. burley tobacco market. Models of strategic trade acknowledge a government’s ability to enter an imperfectly competitive market and extract rents from foreign firms through tariffs and quotas. The general findings of the strategic trade literature is that by committing itself to a particular trade policy a government can take advantage of imperfections in a market and shift rents to the domestic economy (Brander and Spencer, 1985; Dixit, 1988a).
Empirical applications of strategic trade theory has been limited by the lack of general theory and arguments that advocates of an
Address correspondence to Orlando D. Chambers, Research Specialist, Tobacco and Health Research Institute, Cooper and University Drives, University of Kentucky, Lexington, KY 40546-0236.
Received May 1997; final draft accepted February 1998.
Journal of Policy Modeling22(2):139–148 (2000)
activist trade policy might utilize the results to justify protectionist policies. The new trade is founded on the observation that indus-tries are more complex than models based on perfect competition, and thus modeling efforts should include strategic interactions as markets become more imperfect. Given the limited application of these models, there is a need to determine if empirical results support the theoretical arguments.
2. U.S. BURLEY INDUSTRY
Rents above normal economic profits do not exist in many agricultural markets. But previous research suggests that rents have existed and have been extracted from foreign buyers in the U.S. tobacco industry (Johnson and Norton, 1983). In the past, the United States accounted for a relatively large portion of the volume of burley tobacco produced and traded in the world mar-ket. Foreign and domestic tobacco purchasers were willing to pay a large premium for the superior quality and availability of U.S. tobacco. However, during the past 2 decades, the volume of burley traded in the international market has escalated, with the United States facing an increasing amount of competition from foreign producers. As a result, the United States’ share of the world burley export market has declined over the past 2 decades, while the import share has grown. The relatively large policy-induced price differential between United States and foreign burley tobacco has contributed to this decline, especially given the narrowing quality differential between U.S. burley and foreign burley (Snell and Reed, 1993).
3. CONCEPTUAL MODEL
Oligopoly behavior is modeled as a Nash equilibrium with con-jectural variations following Dixit (1988a). Domestic burley pur-chases (Q1) and foreign burley purchases (Q2) are viewed as imperfect
substitutes in the production of cigarettes, but are homogenous within their country of origin. To simplify the analysis, the produc-tion funcproduc-tion for manufacturers is assumed to be quadratic with two inputs, domestic burley Q1 (purchased from the domestic
market or government loan stocks) and foreign burleyQ2. Input
prices (p1andp2) represent burley at the processed level.
Manufac-turer’s output prices are normalized to one leading to the profit function (G) (Eq. 1):
G 5a1Q11a2Q220.5(b1Q2
11b2Q2212kQ1Q2)2p1Q12p2Q2 (1) The first derivative of Equation 1 with respect toQ1and Q2can
be used to derive the respective inverse demand functions for domestic and foreign burley (Eq. 2, 3):
p15a12b1Q12kQ2 (2)
p25a21kQ12b2Q2 (3)
where all of the parameters are positive andb1b22k2.0.
Most burley tobacco used by cigarette manufacturers is pur-chased through contracts with dealers. Dealers purchase tobacco from the market, from government loan stocks, or from foreign markets. The prices that manufacturers pay includes the purchase price, financing, container costs, transportation costs, and pro-cessing fees. Thus, in most cases, it is the dealers who purchase and process burley tobacco and deliver it to the manufacturers.
It is assumed that there aren1symmetric, domestic dealers that
compete in the home market withn2symmetric, foreign dealers.
For this analysis, a domestic dealer is a firm that buys and sells burley tobacco produced in the United States, and a foreign dealer is a firm that buys and sells foreign produced burley. On the supply side, consider the profit functions (p1andp2) for a typical dealer
of domestic and foreign burley (Eq. 4, 5):
p15(p12c1)q1 (4)
p25(p22c22t)q2 (5)
and all other costs. As usual, profit is defined as price minus cost times quantity. Equation 5 allows an import tariff (t) on foreign burley entering the United States.
The parametervij(i,j51,2) represents firmi’s conjecture about
the quantity response of competing firm j. For example, each home firm believes that if it increases output (qi) by one unit then
domestic output will increase by one unit plus the increase in output by the other (n121) domestic firms. ThusQ1will increase
by 11(n121)v11. Similarly,Q2will increase byn2v12. Theviis are
continuous variables that reflect the level of competitiveness in the industry, ranging from vii 5 1 for the collusive outcome to vii 5 21 for the competitive outcome. Using this approach, the
first order conditions become (Eq. 6, 7):
p12c11q1
3
By aggregating Equations 6 and 7 over all dealers, the first-order conditions are:
p12c12Q1V150 (8)
p22c22t2Q2V250 (9)
where the aggregate conjectural variations parameters are de-fined as (Eq. 10, 11):
V15[b1(11(n121)v11)1kn2v12]/n1 (10)
V25[b2(11(n221)v22)1kn1v21]/n2 (11)
Maximizing Equations 4 and 5, and assuming the firm behaves such that the firm’s own quantity decisions affect price, but the output decisions do not affect other firms (the typical Cournot assumptions), the first-order conditions are much simpler (Eq. 12, 13):
a12b1Q12kQ22c12Q1V150 (14)
a22kQ12b2Q22c22t2Q2V250 (15)
The explicit solutions is (Eq. 16)
3
Q1be found by similar substitutions.
Assuming equal weights are assigned to each group’s welfare, total domestic welfare is given by the sum of manufacturer pro-ducer surplus (G), dealer profits (p1), rent to domestic producers
(rQ1), and government revenue (tQ2).
W5 G 1 p11rQ11tQ2 (17)
Using Equation 9 and the total differential of Equation 17 yields the optimal tariff
t5Q2V21(Q1V11r)k (b11V1)
. (18)
4. RESULTS1
The calibration provides estimates for the aggregate conjectural variation parameter, Vi, but the values for Vi cannot be used
directly to indicate market conduct. If all firms play Cournot strategies, the value of Vi is bi/ni. Given the calibrated value of Vi, annican be calculated, which yields the same market
equilib-rium that would result if there were n*i firms that behaved in a
Cournot manner. This Cournot-equivalent number of firms (n*i )
is compared with the actual number of firms in the industry NH
(approximated by the reciprocal of the Herfindahl index) to indi-cate market conduct.
The values forn*1 (10.73, 11.49, 5.80, and 5.82 for 1990 through
1994) indicate that the dealer market was more competitive than a market that exhibits Cournot behavior (NH was around 3 for
all of the simulation years). Results suggest that the market was more competitive in 1990 and 1991 than in 1992 and 1993. How-ever, for the entire simulation period, the market was more com-petitive than under Cournot behavior.
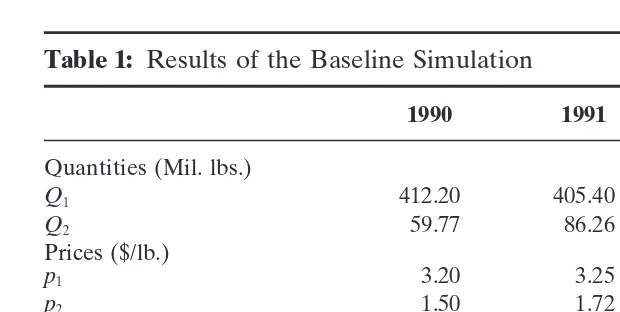
Table 1: Results of the Baseline Simulation
1990 1991 1992 1993
Quantities (Mil. lbs.)
Q1 412.20 405.40 384.30 296.00
Q2 59.77 86.26 109.72 207.87
Prices ($/lb.)
p1 3.20 3.25 3.43 3.41
p2 1.50 1.72 1.81 1.67
Prepolicy Welfare (Mil. $)
Manufacturer surplus 352.44 366.64 379.30 339.56 U.S. dealer profit 58.94 53.51 103.76 71.93 Foreign dealer profit 4.00 9.31 35.55 100.61 Domestic producer rent 179.72 138.24 141.42 90.28
Tariff revenue 0.00 0.00 0.00 0.00
Total U.S. Welfare 591.10 558.39 624.48 501.76
These results are not surprising. Under U.S. policy, it is reason-able to expect little market power for domestic dealers. Domestic burley tobacco policies keep burley prices relatively high and keep the processed dry-weight price of burley (the price to manufactur-ers) in line with costs. With high price supports, U.S. burley dealers have relatively small profit margins and very little power to set output prices above costs.
The values for n*2 in the foreign market were quite small for
each year (4.20, 3.19, 1.18, and 1.0 for 1990 through 1993), indicat-ing considerable market power for foreign burley dealers. The values for n*2 are particularly low in 1992 and 1993. Given the
large world supplies and large burley surpluses in 1992 and 1993, the dealers of foreign burley could purchase tobacco cheaply. Grower prices in Malawi (the United States’ major competitor) fell from $1.07/pound in 1991 to $0.74/pound in 1992 and $0.45/ pound in 1993. Given Malawi’s position as the largest exporter of burley in the world during this period, along with extremely low grower prices, profit margins for dealers of foreign burley increased.
Once the model is calibrated to the baseline data and the optimal policies are calculated, new prices and quantities are found using Equations 2, 3, 8, and 9. These values can be used with Equations 1, 4, 5, and 17 to determine the effects on the government, manu-facturers, dealers, producers, and overall welfare (Table 1).
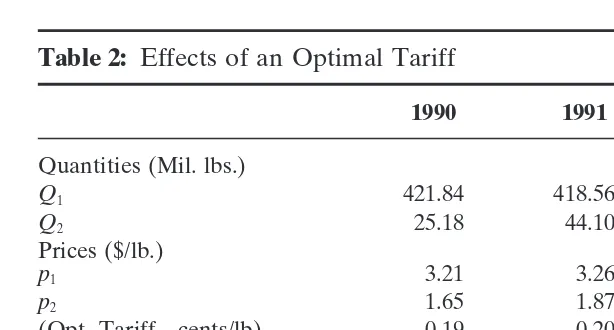
Table 2: Effects of an Optimal Tariff
1990 1991 1992 1993
Quantities (Mil. lbs.)
Q1 421.84 418.56 400.53 320.74
Q2 25.18 44.10 53.02 109.02
Prices ($/lb.)
p1 3.21 3.26 3.44 3.43
p2 1.65 1.87 1.99 1.84
(Opt. Tariff—cents/lb) 0.19 0.20 0.34 0.39 Opt. tariff welfare (Mil. $)
Manufacturer surplus 344.60 355.00 360.58 307.00 U.S. dealer profit 61.73 57.04 112.71 84.46 Foreign dealer profit 0.71 2.44 8.30 27.68 Domestic producer rent 183.92 142.73 147.40 97.83
Tariff revenue 4.80 9.01 18.16 43.19
Total U.S. welfare 595.05 563.78 638.84 532.47
enacting policies to increase their share of monopoly rents. As expected, employing an optimal import tariff increased overall welfare in the United States for all of the simulation years com-pared to the base results (Table 2). The 6.1 percent increase in total welfare in 1993 coincides with the large level of U.S. burley imports and low purchases from the domestic market. Imports increased by 89 percent from 1992 to 1993 in anticipation of the domestic content legislation. Manufacturers and dealers imported large quantities of burley tobacco in 1993 to avoid the domestic content restrictions that became effective on January 1, 1994. A higher conjectural variation parameter was found for 1993, which suggests more market power and ultimately a higher value for the optimal tariff. The larger estimated tariff ($.39 per lb.) and associated revenue from the large level of imports suggest that the situation in 1993 led to an increased role for trade policy.
Compared to the U.S. market, the effect on dealers of foreign burley was substantial. The profit for dealers of foreign-produced burley decreased by more than 60 percent for each time period as U.S. imports plummeted. The optimal tariffs cut profit margins for foreign dealers to nearly competitive levels as price and mar-ginal cost moved closer together. A higher tariff means greater domestic sales (the increases inQ1were relatively small), which
Table 3: Effects of an Import Quota
1990 1991 1992 1993
Quantities (Mil. lbs.)
Q1 459.05 452.90 453.26 357.87
Q2 25.18 44.10 53.02 109.02
Prices ($/lb.)
p1 3.07 3.13 3.23 3.26
p2 1.61 1.83 1.92 1.79
Welfare (Mil. $)
Manufacturer surplus 406.64 412.89 456.05 372.90 U.S. dealer profit 3.63 3.55 30.23 30.71 Foreign dealer profit 4.45 9.52 22.64 65.18 Domestic producer rent 200.14 154.44 166.80 109.15
Tariff revenue 0.00 0.00 0.00 0.00
Total U.S. welfare 610.41 570.88 653.09 512.76
When there is a binding U.S. quota on burley imports, the aggregate conjectural variation parameter for the United States (Equation 10) changes because no quantity response is allowed by foreign firms (thus v12 5 0). This is essentially the same as
restricting Cournot behavior on foreign firms.
Equation 10 provides a relationship between v11 and v12 that
can be used to find values for v12 using the aggregate parameter
and various values for v11. The previous assessment of market
behavior indicated that domestic firms were playing more competi-tive than Cournot behavior, so a base value of20.4 was used for
v11. The initial value forv12is not particularly important because
under a quotav1250. Using the value of20.4 forv11corresponds
tov12ranging from20.1 to 0.6, depending on the year, suggesting
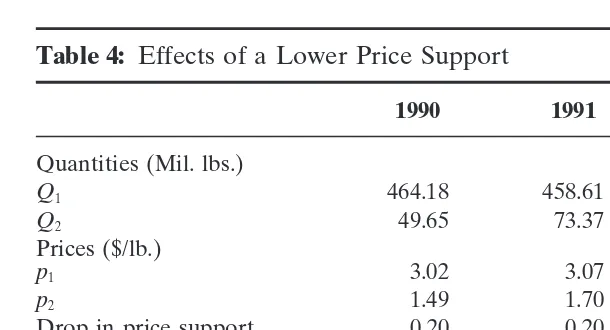
Table 4: Effects of a Lower Price Support
1990 1991 1992 1993
Quantities (Mil. lbs.)
Q1 464.18 458.61 428.90 334.83
Q2 49.65 73.37 100.24 195.38
Prices ($/lb.)
p1 3.02 3.07 3.26 3.24
p2 1.49 1.70 1.79 1.64
Drop in price support 0.20 0.20 0.20 0.20 Prepolicy welfare (Mil. $)
Manufacturer surplus 432.79 446.84 450.82 398.45 U.S. dealer profit 74.75 68.48 129.24 92.03 Foreign dealer profit 2.76 6.74 29.67 88.88 Domestic producer rent 109.55 64.66 72.06 35.16
Tariff revenue 0.00 0.00 0.00 0.00
Total U.S. welfare 617.09 579.99 652.11 525.65
Similar to the optimal tariff, a $.20/lb. drop in the support price lead to a small increase in total U.S. welfare (Table 4). Manufac-turer’s and dealer’s profits increased by substantial amounts, while the big losers were foreign dealers and domestic producers. Even though imports were much larger than under the optimal tariff, the profit for dealers of foreign burley decreased considerably relative to the baseline. However, U.S. producers experienced the most serious effects with average rent drops of $67 million for the 4 years.
It is not surprising that lowering price supports transferred in-come from producers to manufacturers and dealers. Yet, it is somewhat surprising that the lower price support created a net benefit for the United States, especially because the model does not include potential benefits to producers from greater exports. Certainly, a lower price would stimulate exports that would ulti-mately benefit producers through expanded output possibilities and higher prices.
5. CONCLUDING COMMENTS
policy analysis. The lack of empirical applications for the strategic trade models creates a critical need for research that incorporates strategic behavior in imperfect market structures to determine if theoretical arguments can be supported.
The model used in this study contains some support for the view in trade policy that restricting imports can be justified. If “profit shifting” is the policy goal, results illustrate how both tariffs and quotas could result in a national gain at the expense of other countries. The employment of an optimal tariff and an equivalent quota increased domestic production of burley tobacco and lead to an increased share of monopoly rents for all of the simulation years. But from a profit-shifting standpoint, a drop in the price support was shown to be just as effective as restrictive policies for increasing domestic welfare.
REFERENCES
Brander, J.A., and Spencer, B.J. (1985) Export Subsidies and International Market Share Rivalry.Journal of International Economics18:83–100.
Dixit, A. (1988a) Optimal Trade and Industrial Policies for the U.S. Automobile Industry. InEmpirical Methods for International Trade(R. Feenstra, Ed.) Cambridge: MIT Press.
Dixit, A. (1988b) Anti-Dumping and Countervailing Duties Under Oligopoly.European Economic Review32:55–68.
Johnson, P.R., and Norton, D.T. (1983) Social Cost of the Tobacco Program Redux.
American Journal of Agricultural Economics65:117–119.
Snell, W.M., and Reed, M. (1993) Incorporating Strategic Government Policy Behavior and Product Differentiation Into an International Burley Tobacco Trade Model.
Journal of Policy Modeling15:229–233.