www.elsevier.nl / locate / econbase
Politics, growth, and inequality in rural China: does it
pay to join the Party?
a b ,*
Jonathan Morduch , Terry Sicular a
Woodrow Wilson School, Princeton University, Princeton, NJ, USA b
Department of Economics, Social Science Centre, University of Western Ontario, London, ON,
Canada N6A 5C2
Received 31 January 1999; received in revised form 30 November 1999; accepted 30 November 1999
Abstract
Economic reform is often constrained because rank-and-file bureaucrats responsible for implementation have vested interests that oppose change. Drawing on an unusual longi-tudinal survey data set for a representative rural county in northern China, we show an alternative, positive scenario consistent with the presence of an implicit, performance-based incentive contract that ties the household incomes of local officials to market liberalization, increases in consumer demand, and the provision of local public goods. The mechanisms appear to be tolerated as the fruits of growth are shared fairly equitably, thus allowing implementation of a politically and economically self-reinforcing reform process. 2000 Elsevier Science S.A. All rights reserved.
Keywords: Economic transition; China; Political economy; Inequality; Rural reform
JEL classification: P21; P26; D31
1. Introduction
Economic transition in socialist countries generates major gains and losses, and the distribution of these gains and losses among different groups can influence the
*Corresponding author. Tel.:11-519-661-2111; fax:11-519-661-3666.
E-mail address: [email protected] (T. Sicular)
course of reform. A particularly important group consists of the rank-and-file officials and bureaucrats who hold political or bureaucratic power. The extent to which this group gains or loses is relevant not only from the perspective of equity, but also from a practical perspective, because this group is responsible for implementing government policies. In order for transition to succeed, rank-and-file officials must be persuaded to enact policy changes that could undercut their political and economic status.
For this reason some have argued that the reforms must ‘pay off’ rank-and-file officials; that is, officials and bureaucrats at various levels must be given positive incentives to implement the new policies. These incentives, moreover, must be sustained over time. Even when bureaucrats benefit at early stages of the transition process, they may resist further liberalization if it threatens the rents they enjoy in the partially reformed economy (Hellman, 1998). For example, the halting post-Soviet reforms are thought to reflect in part the resistance to additional reforms by bureaucrats with vested interests in the semi-reformed system. Thus, bureaucrats known for their ‘grabbing hand’ (Frye and Shleifer, 1997) may resist moving to an economy governed by the invisible hand and hijack the transition in mid-stream. Drawing on recent Chinese experiences rather than those of Russia and Eastern Europe, some observers have suggested the existence of an alternative scenario. Che and Qian (1997), Che (1997), and Li (1996) use theoretical models to argue that the Chinese industrial reforms have succeeded by giving government officials stakes in newly ‘privatized’ or non-state firms through hybrid private–public ownership forms. A similar scenario may apply to local officials (‘cadres’) overseeing the dramatic reforms in the Chinese countryside. Here the reforms are thought to have given local authorities a stake in high-return, market-oriented economic activities that tie their livelihoods to the performance of the local economy (e.g. Oi, 1989). If these characterizations are correct, then Chinese officials would gain personally from key elements of economic reform such as reductions in licenses, quotas and taxes, and from investment in certain public goods such as transportation and communication infrastructure.
These characterizations of China’s reform process suggest the presence of a coordinated (implicit) incentive contract. The ability of such an implicit incentive contract to promote ongoing reform is limited by various factors, including whether officials have low enough intertemporal discount rates; whether the potential for monopoly rents is so great that cadres are tempted to hold others back rather than to encourage broad-based growth; whether the fruits of growth are unequally distributed; and whether free-rider problems reinforce the tendency towards the grabbing hand (Robinson, 1997).
empirically. First, do rank-and-file officials in fact benefit from the reforms; that is, in the reform environment do they continue to enjoy rents associated with their political position or status? The answer to this question is not foregone. Some authors have argued that the reforms have reduced the political rents of rural cadres because market liberalization has eroded the basis of their power (e.g. Nee, 1989). If evidence indeed confirmed that bureaucrats or officials do not receive rents, or that the rents are trivial in size, then neither the Frye and Shleifer nor the Che and Qian scenario apply, and the role of bureaucrats in the reform process must be reconsidered.
If, however, bureaucrats do benefit, then two additional questions arise. First, do they benefit at the expense of others (grabbing a larger share of a fixed or even shrinking pie), or along with others (sharing in a growing pie)? The former case is consistent with a stalled reform process as described by Frye and Shleifer; the latter is consistent with a self-sustaining reform scenario described by Che and Qian. Second, through what mechanisms do they benefit? Do the mechanisms that generate political rents give bureaucrats an incentive to undermine or support the reform process? If, for example, bureaucrats receive rents based on quotas, licenses, or monopoly power in the semi-reformed economy, then they are likely to fight further market liberalization. If they benefit because the reforms give them rights to economic assets such as machinery or land, then they may perceive that market liberalization can enhance their returns to those assets and so support further reform.
In this paper we explore these empirical questions using a longitudinal data set for a random sample of households in an unexceptional rural county in northern China. The data set is unusual in that it contains detailed household-level information on political position, income, and economic activities, thus allowing a more nuanced analysis than previously possible. The central results are robust to controlling for unmeasured household characteristics via estimation with house-hold-level random effects and fixed effects.
The data cover four years, 1990–1993, that are of particular interest because they span two major periods during the reform process. The first two years, 1990 and 1991, were the tail end of a period of stalled reform following the inflationary episode of 1988 and the Tiananmen incident in 1989. The second two years, 1992 and 1993, were the start of a period of rapid acceleration in the reforms following Deng Xiaoping’s famous southeastern tour in early 1992 and Jiang Zemin‘s subsequent advocacy of a ‘socialist market economy’ at the 14th Party Congress in October, 1992 (Myers, 1995). The time frame of the data therefore permits us to examine whether the rents accruing to local cadres and Party members increased or decreased when the reforms accelerated.
1
rents. Substantial rents are associated only with households that contain an individual who holds a position as a local official or cadre.
Descriptive analysis of the data provides suggestive evidence regarding the mechanisms that generate political rents. We find that rents come primarily from two sources: (a) wage employment, and (b) market-oriented, high-value agricultur-al production (and not from non-agriculturagricultur-al sidelines as might be supposed). Rents from wage employment and agricultural sidelines arise due to village officials’ privileged access to jobs in collective enterprises and their control over collective assets necessary for (relatively) large-scale, high-value agricultural production.
These two sources of income are likely to benefit from reforms that promote growth in wage employment, reduction of quotas, expansion of markets, invest-ments in roads and other infrastructure, and, more generally, rising incomes and demand. Thus, village officials would appear to have a vested interest in the success of market-oriented reforms, a conclusion consistent with Oi’s (1989) interviews in the same county. Our finding that the income advantage of households that contain village officials increases over the sample period lends further support to this conclusion. The years when political rents are largest — 1992 and 1993 — coincide with the acceleration of the reforms both within the locality of our sample and nationwide.
Finally, we can ask whether officials benefit at the expense of others or along with others. The data do not permit a comparison of the pre- and post-reform situations, but an analysis of income distribution during the sample period indicates that the benefits of reform have been largely shared. Although average incomes have grown over time in the county and also during the four survey years for our panel, overall income inequality in the sample remains relatively low. Inequality has been kept in check because the returns to household characteristics such as household demographic composition, primary education, and land endowments are fairly equally distributed among households and offset the unequal distribution of political rents. Indeed, the impact of political rents on the overall level of measured inequality is minor.
This situation is consistent with a reform process that is politically sustainable. Since the benefits of reform have been shared, the population in the survey area has been willing to tolerate the political rents that accrue to local cadres. This evidence from a period of active reform in a typical rural area of northern China thus provides an alternative set of stylized facts to compare with the experiences in Eastern Europe and Russia.
1
The results indicate that the focus in some of the literature on rents to Party membership is
´ ´
2. Political status in rural China
The two most important forms of political status in rural China are membership in the Communist Party and holding a cadre position. The Communist Party is an influential organizational network that extends from Beijing down through the provinces, counties, and townships to the villages. Party members belong to a select group, through which they can gain access to valuable political and economic information and establish personal connections that extend beyond the locality. They attend meetings and interact with Party organs at higher and lower levels. They appear to have preferential access to resources and jobs. For example, in our sample just under three quarters of the Party members had been or were
2 currently cadres.
The term ‘cadre’ refers to an individual who holds an official position of political or administrative leadership. In rural China most cadres hold a position within the village or at the township level, for example, as village or township head, Party secretary, leader of a sub-group (xiao zu) within the village, accountant, or manager of a collective enterprise. Some cadres hold several posts simultaneously. In our sample almost all cadres and former cadres held or had held posts at the village (former production brigade) or village sub-group (former
3 production team) level, so here we focus on cadres within villages.
The criteria for selection of village cadres are not set and can vary from place to place and from time to time. By the 1990s village cadres were elected in most parts of rural China, but township-level Party organs reportedly use a variety of methods to control the slate of candidates and election outcomes (Oi, 1989, p. 133; Chan et al., 1992, p. 318; Potter and Potter, 1990, Chap. 13; Ho, 1994, p. 238; Kelliher, 1997). Not surprisingly, then, individuals who hold cadre positions,
4 especially key ones, are usually Party members.
Cadres hold paid administrative positions that involve full- or part-time work. Cadre responsibilities depend on the position and locality, but they usually involve implementation of government policies, management of collective and state resources, accounting and statistical reporting to higher levels, issuance and approval of permits, and assessment of certain fees. In areas where the rural
2
For descriptions of the role of the Party and advantages of Party membership in rural China, see Potter and Potter (1990), Chap. 13.
3
None of the households in the sample report having a cadre above the village level prior to 1990. In 1990–1993 no more than five households reported having a cadre above the village level.
4
development strategy has been to promote the development of rural collective (as opposed to private) enterprises, as was the case in Zouping County, village cadres usually play an active part in managing collective businesses. The Party secretary often takes primary responsibility for management of collective enterprises and so tends to have greater direct economic power than the village head, who is more often responsible for social and non-economic tasks. Still, the village head’s
5 support may be necessary for implementation of major policy changes.
One important reward to cadre status may be privileged access to off-farm employment (Knight and Song, 1993; Hare, 1994; Cook, 1996). Wage employment is usually in enterprises run collectively by village or township governments, and these jobs are often allocated by local cadres and through personal connections (Ho, 1994). Similarly, households wishing to establish or expand a family sideline enterprise require local permits and approvals, and the returns to sidelines depend on the level of local assessments as well as access to land, credit, and other resources that are not allocated through markets. Under these circumstances access to such opportunities may reflect political rather than purely economic factors, and households with wage jobs and sideline businesses may enjoy extra-normal rents. Evidence discussed below is consistent with the hypothesis that cadres do better because of such privileged access.
6
3. The survey data and economic setting
The data used in this study are from a stratified random sample of 259 farm households in 16 villages in Zouping County, a county situated south of the Yellow River in central Shandong Province. The survey followed the households over four years, providing 1036 observations covering the calendar years 1990– 1993. When we initiated the survey, Zouping was one of the few counties to which foreign social scientists were given access for data collection over several years, and our data set is one of the first, and still one of the only, longitudinal household data sets for rural China. Several other longitudinal data sets, mainly collected by Chinese statistical bureaus, have since become available.
While the sample is comparatively small, our data set has certain advantages relative to other existing data sets. First, the survey questionnaire was tailored to deliver consistent definitions of income and to provide rich information on a wide array of socio-economic and political variables. Indeed, the data set’s detailed information on household political status and class background, which makes this
5
In turn, both posts are probably more advantageous than the positions of village accountant or cadre in charge of women’s affairs (Oi, 1989, p. 224; Ho, 1994, pp. 212–215). All village cadres are chosen from within the village (Oi, 1989, p. 133).
6
analysis possible, is unusual. Second, close, on-site supervision by the researchers 7 8 and careful consistency checks yielded a data set of relatively high quality.
9
Official statistics show that Zouping is an unexceptional rural county. Zouping experienced rapid economic growth during the 1980s, but its per capita GDP in the early 1990s was still 18% below the national average (the national average is pulled up by industrial production in major urban centers). In 1990–1993 the income of rural households in the county averaged 701 yuan per capita (in constant 1990 prices), slightly below the national average of 717 yuan. Growth in Zouping’s economy is partly the result of rapid development of rural enterprises. The Zouping county government has actively promoted the development of township and village enterprises. During the 1980s it followed the so-called ‘sunan’ model of promoting collectively owned enterprises managed by local
10
cadres and officials. Since the early 1990s the county government has
increasing-7
The data were collected through an independent survey organized and supervised by the authors. Trained survey workers verbally interviewed the households. Villages were stratified by income and output levels, and households within villages were selected randomly. Each village was assigned a different interviewer, and the quality of the data thus may vary among villages due to differences in skill and effort among the interviewers. The interviews took place in mid-year and households were asked to recall their activities in the prior calendar year. Consequently the data may contain errors in recall. To minimize the above problems, the questionnaires contained overlapping questions that were designed to allow multiple consistency checks. In addition, the questionnaires were checked for inconsistencies during the course of the survey work, and households were re-interviewed when inconsistencies or other problems were detected. The survey area has also been studied recently (and historically) by political scientists, anthropologists, and sociologists, yielding detail that adds specificity to the hypotheses tested here (e.g. Walder, 1998). Cook (1996) uses a portion of the data set used here to investigate specific mechanisms through which political status can effect economic outcomes.
8
Like all data sets, ours has some limitations. First, the sample consists entirely of households resident in rural villages and so does not capture rural–urban differences or the relationship between political status and geographical mobility or migration. Second, income derived from ‘back door’, private, and illegal activities is likely to be under-reported. Third, the data do not fully capture the value of public goods or in-kind benefits and perquisites of office. Thus, the value of certain perquisites enjoyed by local cadres such as publicly subsidized banquets, telephones, and car service is not included in income. While the questionnaire attempted to minimize under-reporting of illegal income and perquisites by asking questions about in-kind income and gifts, they are nevertheless likely to be under-reported, and if these forms of income go disproportionately to households with political status, then the data will understate the link between political variables and income.
9
Aggregate county statistics were obtained through interviews with county officials. National-level statistics are from State Statistical Bureau (various years). Zouping’s GDP per capita in 1990 was 1280 yuan (at the 1990 official exchange rate, 4.77 yuan5$1; however, note that purchasing power parity-adjusted GDP is substantially higher than what is implied by the exchange rate). The official statistics on rural household income are not strictly comparable to rural household income statistics from the survey data used in this paper, in part because the method of calculation is different. In the official statistics, retained output is valued at planned prices, while we value retained output at market prices. Also, we calculate household size by person–years rather than by the number of residents at the end of the year.
10
ly supported private enterprise. These policies have contributed to the substantial expansion of non-agricultural output and employment in the county.
The development of the enterprise sector is reflected in the declining importance of agriculture as a source of income and employment. In 1990 agriculture contributed 56% of county GDP, but by 1993 agriculture’s share had fallen to 30%. For rural households, however, agriculture continued to contribute the great majority of income: despite a downward trend, in the early 1990s agriculture contributed 65–70% of the net income of rural households in the county. Cultivation of wheat, cotton and corn still accounts for the majority of agricultural output value.
The ongoing changes in the county during the early 1990s are reflected in our sample statistics. Between 1990 and 1993, real per capita income in our sample grew at an average annual rate of 8.2%, rising from 1175 yuan to 1628 yuan (in constant 1990 prices). The sample does not include urban residents, so agriculture plays a larger role than in the county as a whole. All but a few households in the sample cultivated crops. Nevertheless, the share of income from agriculture fell from 83% to 76%, pushed down by a 50% rise in the share of wages in total income (from 14% to 21%). This trend reflects the county’s strategy of promoting the development of rural enterprises and, more generally, the expansion of
11
off-farm employment opportunities during this period. Just over half the
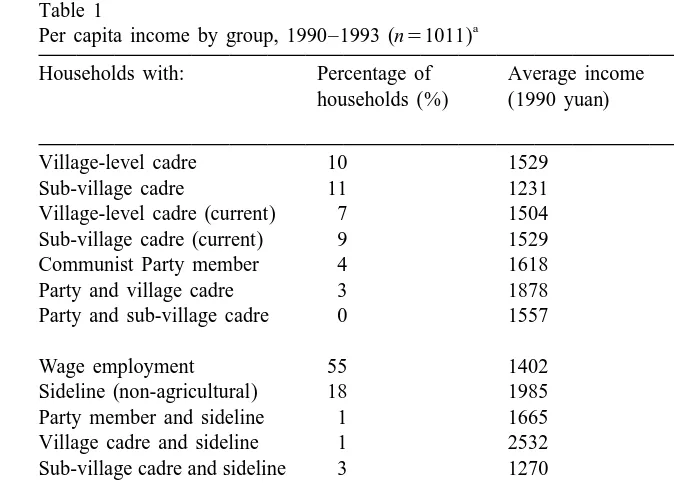
households contain a member holding a wage job and just under 20% engage in a sideline activity — often quite small in scale. The share of income from sideline businesses remained virtually unchanged over the period. Tables 1 and 2 give selected summary statistics for the sample.
4. The effects of political variables on income levels in Zouping
The statistics in Table 1 give preliminary support to the conclusion that households that contain Party members and / or cadres are likely to enjoy higher than average incomes. The data set does not contain information about which cadre position (e.g. village head or Party secretary) was held, but it does contain information about level (sub-village, village, township, or county) and about whether the position is held currently or was held in the past. We therefore divide the sample into the following groups: households with cadres at the sub-village (xiao zu) level, with cadres at the village-level or higher, and with Communist
12
Party members. Since the sample contains some households with recently retired
cadres (to whom the rents would plausibly also apply), we define ‘cadre’
11
Interviews, Zouping County, 1991–1994. 12
Table 1
a Per capita income by group, 1990–1993 (n51011)
Households with: Percentage of Average income As a percentage households (%) (1990 yuan) of sample average
income (%)
Village-level cadre 10 1529 117
Sub-village cadre 11 1231 94
Village-level cadre (current) 7 1504 115
Sub-village cadre (current) 9 1529 117
Communist Party member 4 1618 124
Party and village cadre 3 1878 144
Party and sub-village cadre 0 1557 119
Wage employment 55 1402 108
Sideline (non-agricultural) 18 1985 152
Party member and sideline 1 1665 128
Village cadre and sideline 1 2532 194
Sub-village cadre and sideline 3 1270 97
Landless / poor class 58 1204 92
Middle peasant class 31 1503 115
Rich peasant class 5 1393 107
Landlord class 6 1150 88
All households 100 1303 100
a
The means are weighted to adjust for village size and Party affiliation (this latter corrects for differences in the proportion of Party members between the sample and the underlying populations of each village) using data from village-level surveys, which give a complete census of the number of people and of Party members in each village. These figures are calculated over all households over all four years.
households as those containing a member who is currently or had been a cadre. To see whether currently holding a cadre position has special disadvantages or advantages, we define a sub-group of cadre households that contain current
13 cadres.
The first two rows of Table 1 show that incomes of households with village-level cadres exceed the sample average by roughly 17%. Sub-village village-level cadres, however, are on average worse off by 6%. For village-level cadres, incomes of households with current cadres are similar to those of households that include past
13
Table 2
a Mean values of household characteristics by group, 1990–1993
Entire Households Households Households sample with Party with village-level with neither
member cadre
Income per capita (yuan) 1303 1618 1529 1279
Village-level cadre 0.10 0.64 1.00 0.0
Land per capita (mu) 1.7 1.9 1.7 1.7
Number of plots 3.4 3.2 2.9 3.4
Household size 3.9 4.0 3.7 3.9
Average adult age 36.8 36.9 35.2 37.0
Education (years) 5.3 6.1 6.6 5.1
Workers per capita 0.7 0.7 0.7 0.7
Adult male share 0.51 0.50 0.50 0.52
Landless / poor class 0.58 0.72 0.67 0.56
Wage activity dummy 0.55 0.74 0.81 0.51
Sideline dummy 0.18 0.18 0.12 0.19
Number of observations 1009 215 232 711
a
The means are weighted to adjust for village size and Party affiliation, and these figures are calculated over all households over all four years. The number of observations in columns 2–4 is greater than the total number of observations due to overlap between households with Party members and cadres. (15 mu51 hectare.)
cadres; for village level cadres, incomes of households with current sub-village cadres are higher than those with former ones.
The fifth and sixth rows show that households with Party members have per capita incomes that exceed the sample average by 24%, and households with both a Party member and village-level cadre (probably the same person) do 44% better than average. As will be seen below, this apparent income advantage disappears
14 once we control for other variables.
Table 1 reveals further that households with wage jobs and non-agricultural sidelines have above-average incomes. The income differential is especially noticeable for households with sidelines, suggesting either the presence of rents arising from unequal access to sideline opportunities or returns to risk-taking and entrepreneurship. Households that contain both a Party member and a sideline activity have incomes 28% higher than the sample average, while households with both a village-level cadre and a sideline activity do 94% better than average. Again, these results change substantially when we control for covariates.
The bottom panel of Table 1 gives average incomes by class designation. In the late 1940s and early 1950s, the Chinese government gave all families class labels
14
depending on their economic situation before the Revolution. Rural families were generally classified as landless, poor peasant, middle peasant, rich peasant, or landlord. While some debate exists regarding the degree to which these labels accurately correspond to the pre-1949 economic status of families, a family’s class designation remains a useful marker, albeit perhaps a noisy one, in part because one’s treatment during the Maoist period depended on one’s class label. In-dividuals from landlord families were often denied access to educational oppor-tunities and career advancement, while individuals from landless or poor peasant
15
families were given special opportunities. The data for this sample indicate that
by the 1990’s the income of formerly privileged landlord group was 12% below average. The rich-peasant group’s income was 7% above average and the middle-peasant group’s 15% above average, while the poor-middle-peasant group’s income was 8% below average. As seen in Table 2, Party members and village-level cadres come disproportionately from the poor-peasant group, and their income advantages are particularly striking in this context.
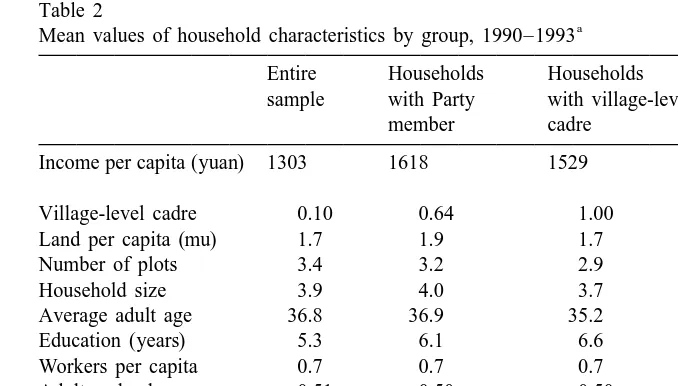
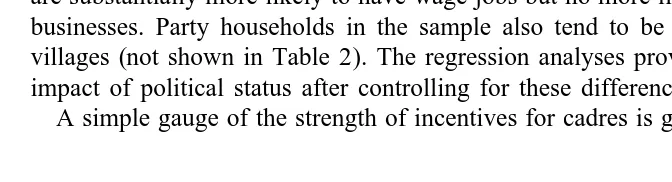
Table 2 compares the characteristics of households with Party members to average characteristics of the entire sample. Party-member households share basic demographic features with the rest of the sample, but they differ noticeably in several respects. First, on average they have 6.1 years of education vs. 5.1 years for households with neither a Party member nor village-level cadre. Second, they are more than six times as likely to contain village-level cadres as the sample average. Third, 72% have landless and poor-peasant family backgrounds vs. 56% for households with neither a Party member nor village-level cadre. Fourth, they are substantially more likely to have wage jobs but no more likely to have sideline businesses. Party households in the sample also tend to be located in wealthier villages (not shown in Table 2). The regression analyses provide measures of the impact of political status after controlling for these differences.
A simple gauge of the strength of incentives for cadres is given in Table 3. The
Table 3
a Growth in per capita income of cadre households vs. all households (%)
1990–1991 1991–1992 1993–1994
Villages with positive average growth
All households 55 45 64
Village cadre households 56 83 49
Villages with negative average growth
All households 227 220 231
Village cadre households 232 221 228
a
These means are weighted to adjust for village size and Party affiliation. 15
table summarizes growth rates of per capita income for the entire sample and just for households containing cadres. When villages do well (rows 1 and 2), households with cadres do well also. Similarly, when villages do poorly (rows 3 and 4), so do households with cadres. In general, households with cadres do not appear to do especially well nor especially poorly relative to others. Instead, their fortunes tend to reflect those of the local economy.
5. Regression analyses
The regression analyses center on a series of earnings functions, where the dependent variable is the logarithm of per capita income for household i in time
16
t:
K 1993 15 1993 15
ln Yit5b 10
O
Xitkb 1kO
Dt tg 1O
Dva 1vO O
D Dt vd 1 m 1 ´tv i it k51 t51991 v51 t51991v51(1)
The longitudinal aspect of the data allows estimation with household-level random-effects or fixed-effects methods to control for household-level
unobserv-17
ables (mi) and errors correlated across time. Village-level fixed effects (av), time fixed effects (gt), and time–village interactions (dtv) capture local differences and village-wide shocks (like weather fluctuations).
The explanatory variables Xitk include a set of measures of political status. A
series of dummy variables indicates households that contain one or more individuals that are or had been Party members, village-level cadres, or sub-village cadres. As above, the village-level cadre category includes the few households with cadres at the township or county level, and the sub-village cadre category includes only households that have had cadres at the sub-village level but no higher. The estimated coefficients on these variables measure the advantages associated with different types of political status, holding all else constant, and (having controlled for observed and unobserved ability, geographical differences, and village-specific time effects) we interpret them as estimates of political rents. The specifications also include a series of household-level characteristics,
18
including family size, the share of family members of working age, the share of
16
Linear specifications were also estimated. The results of linear and semi-log specifications are similar, so here we discuss only the semi-log specifications.
17
The random-effects models were estimated using generalized least squares. For all specifications Hausman tests indicate that we cannot reject the hypothesis that the random-effects coefficients do not differ systematically from coefficients estimated by a fixed-effects model. However, the test has low power because of low within-household variation, especially of political variables.
18
working-age adults that is male, the average age (and squared age) of working-age 19 adults, average education (and squared average education) of working-age adults,
20
land endowments, and the number of plots. Dummy variables are included for
households of landless / poor-peasant background, and of rich / landlord background 21
(middle-peasant background is excluded).
The specification can be expanded by allowing year-specific coefficients on the political variables, providing a test of whether cadre advantages rise or fall over time. A natural generalization is to allow the coefficients on the political variables to vary by village as well as year. Comparison of the pattern of coefficients over time indicates the responsiveness of the income of cadre households to local conditions. Low-powered incentives are indicated if the coefficients on political variables vary less over time than the average incomes of the villages. High-powered incentives are indicated if politically connected households suffer more than the average for their villages during downturns – and benefit more than others during upturns. A parsimonious representation is given by:
K 1993 15
where D is an indicator of political connectedness (D is also an element of X ).c c itk
Positive values ofw indicate high-powered incentives, whilew ,0 indicates weak
incentives. The equation can be estimated using non-linear least squares.
19
The regressions were run using alternative measures of education such as education of the household head and maximum years of education among adult family members. The results of these alternative regressions did not differ substantially from those reported here.
20
The land ‘endowment’ is defined as land allocated by the village to the household under responsibility system contracts, plus private plots and reclaimed land. Land endowments do not include further transfers of endowed land among households or between households and the village. In China at the time of this survey, markets for farmland did not exist, and most of the land cultivated by households was received from the village under the responsibility system through administrative allocation, usually on a per capita basis. While households in our sample occasionally rented in more land or transferred some of their endowed land to others, in the short run the amount of land per capita allocated to each household was effectively exogenous to the household. Thus, the coefficient on land endowments per capita can be interpreted without the usual concerns about reverse causality. Land is measured in ‘mu’ (15 mu51 hectare).
21
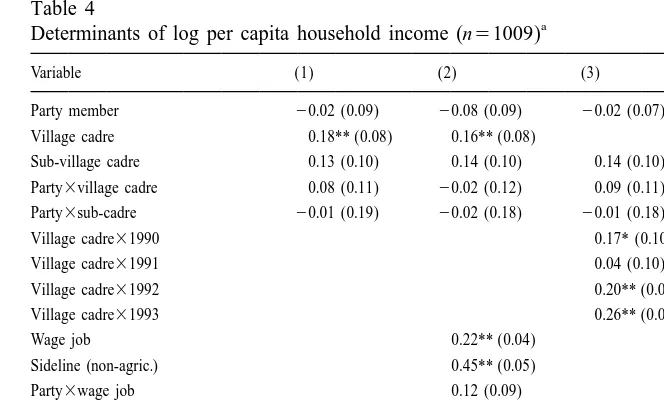
Table 4
a Determinants of log per capita household income (n51009)
Variable (1) (2) (3) (4)
Party member 20.02 (0.09) 20.08 (0.09) 20.02 (0.07) 20.03 (0.06) Village cadre 0.18** (0.08) 0.16** (0.08) 0.16* (0.09) Sub-village cadre 0.13 (0.10) 0.14 (0.10) 0.14 (0.10) 0.12* (0.07) Party3village cadre 0.08 (0.11) 20.02 (0.12) 0.09 (0.11) 0.13 (0.10) Party3sub-cadre 20.01 (0.19) 20.02 (0.18) 20.01 (0.18) 20.03 (0.14) Village cadre31990 0.17* (0.10)
Village cadre31991 0.04 (0.10) Village cadre31992 0.20** (0.09) Village cadre31993 0.26** (0.09) Wage job 0.22** (0.04)
Sideline (non-agric.) 0.45** (0.05) Party3wage job 0.12 (0.09) Party3sideline 20.09 (0.11) Cadre3sideline 0.06 (0.13) Sub-cadre3sideline 20.26* (0.15)
25 25
Village cadre3village–year effects 23310 (89310 )
2
R 0.47 0.53 0.47
a
Standard errors are in parentheses. The first three specifications are estimated with random effects and the fourth by non-linear least squares. Specifications include year, village, and interacted year–village fixed effects, as well as education, education squared, per capita land, number of plots, household size, number of workers per capita, average age (and square of age) of adults in household, share of adults that are male, and dummy variables for class background. ** (*), statistically significant at 95% (90%) confidence level.
5.1. Results
Table 4 gives the key regression results. All specifications have fairly high explanatory power and give similar qualitative results. The coefficients on Party membership are in all cases not significant and very small. Moreover, no interaction variables related to membership in the Communist Party are significant. Thus, contrary to the simple group averages in Table 1, having a Party member, whether alone or in conjunction with a village-level cadre, wage employment or a sideline business, confers little if any direct income advantage.
In contrast, almost all specifications give coefficients on village-level cadre variables that are significant and relatively large. Translation of the results from the base regression (column 1), for example, shows that households with village-level cadres have incomes that are roughly 20% higher than sample average income.
sub-village cadres could potentially determine the sources of apparent advantage, but the estimates here are too noisy to draw conclusions.
A second, ‘hybrid’ specification (column 2) includes dummy variables for households that have wage workers or non-agricultural sidelines. These variables capture possible rents from special access to wage and non-agricultural sideline business opportunities, as well as their interactions with the political variables. Since the variables can be viewed as being endogenous, there are good arguments for omitting them from a ‘reduced-form’ specification like that in column 1. The results are useful, however, in providing a gauge of sources of variation in the data.
Not surprisingly, the coefficients on the dummy variables for wage job and (non-agricultural) sideline activity are large and positive. On average, having a sideline business is associated with an increase in household per capita income of more than 600 yuan, equivalent to roughly half of sample average income. Party members and sub-village cadres with sidelines do worse and village-level cadres do better than average, showing considerable heterogeneity in returns to sideline activities. The continued strength of the effect of having a village-level cadre is notable, since in the presence of the wage job dummy the measured impact of having a cadre is above and beyond the normal returns to wage employment (since having a cadre position is considered a form of wage employment here).
5.2. Do political rents increase or decline over time?
The theory of ‘win–win’ reform scenarios proposed by Che and Qian (1997) and others suggest that the relative position of cadres remains strong or even increases over time as the reforms proceed. An alternative view is that of Nee
(1996, pp. 16–17): ‘‘ . . . the declining-significance-of-redistributive-power
hypothesis predicts a diminishing cadre advantage in entering into and profiting from private entrepreneurship as markets thicken and a market economy is instituted.’’
In order to explore which of these views applies, we estimate the specification that allows the returns to village-level cadre status to vary over time (column 3). In the first two years of the survey these coefficients are noisy, with cadre status increasing income by 19% of sample average income in 1990 and then by just 4% in 1991, a weak year in general. In the last two years, however, the coefficients are larger and are estimated more precisely. Having a village-level cadre raises 1992 income by 22% and 1993 income by 30% of the sample average. Note that since the regressions contain dummy variables for village of residence interacted with the year, these estimated yearly cadre advantages are over and above the broader changes brought to the villages by the reforms.
22
liberalization both nationwide and in Zouping county. For example, in 1993 / 94
grain markets in Zouping were opened up, rationed allocation of grain was eliminated, and the government raised the prices paid to farmers for mandatory contract deliveries of grain to the level of free market prices. While the state maintained its cotton marketing monopoly, in 1993 and 1994 the county eliminated mandatory planning and procurement quotas for cotton. Policies regarding private enterprise were also liberalized during these years. Prior to 1994 all permits for individual and private businesses ( getihu, siying qiye) had to be submitted to the township and then sent for higher-level approval at the county level. Starting in 1994 the county adopted a new policy under which such permits were to be issued on the spot at the township level, without any higher-level approval, and without need for permission or recommendation by village-level cadres.
More generally, the policy environment in Zouping during these four years resembled that nationwide: the Chinese economy was characterized by retrench-ment and slowdown in 1989–1991 and by accelerated reform and market liberalization starting in 1992 after Deng Xiaoping’s southern tour calling for bold approaches. The fact that the coefficient estimates show that returns to cadre status increased in significance and size during 1992 and 1993 therefore lends support to the view that the reforms enhanced, rather than diminished, the economic advantages of political status.
Column 4 provides an explicit test of the power of incentives as described in Eq. (2). The coefficient on the cadre indicator interacted with the village–year fixed effects (in the bottom row) is positive but small and not statistically significant. The coefficient indicates that the income of households with cadres is neither especially sensitive nor especially insensitive to local conditions. Cadre house-holds benefit when their villages do well and suffer when the villages do poorly, but not disproportionately. That is, the incomes of village cadre households are not insulated from trends in overall village incomes, but sensitivity is not so great as to show up as evidence for high-powered incentives.
5.3. Robustness
While benefits appear to accrue to being a village-level cadre, these positions are not allocated randomly. Our findings could therefore reflect selection bias. Given that the data are longitudinal, it is possible to estimate with household-level fixed effects to control for unobserved, time-invariant household characteristics. Five households changed cadre status between 1990 and 1991, another five changed between 1991 and 1992, and another two changed between 1992 and 1993. The precision of estimates is thus apt to be low, and, not surprisingly, the
22
use of fixed effects increases the standard errors on the estimates. Still, the magnitudes of the key estimated coefficients are now slightly larger, rather than smaller as would be expected if selection bias drove the earlier results.
The first two columns of the table in Appendix A give fixed-effects estimates that parallel the random-effects estimates of columns 1 and 3 in Table 4. Since there is little within-household variation with which we could identify all of the coefficients, the fixed-effects results shown in this table exclude the two variables 23 that capture interactions between Communist Party membership and cadre status. Translating the results from column 1 shows that the overall advantage of a village-level cadre is 23% of sample average income. The results in column 2 translate to an advantage of 23% of sample average income in 1992 and 31% in 1993. These estimates are close in size to the results from our random-effects regressions shown in Table 4 and are all significant. Thus, while imprecise, the findings suggest that unobserved household attributes such as unmeasured ability are not driving the central results above.
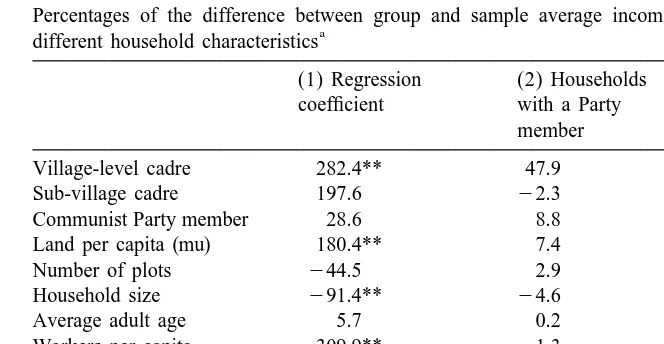
6. Why are Party members richer?
While the coefficients on the Party variables in Table 4 are small and are not significant, Table 1 shows that, as a group, households with Party members have 24% higher income than average. Thus, even if Party membership per se does not increase income, households with Party members must have other attributes that enhance income, such as higher levels of education, easier access to cadre positions, and special wage and sideline opportunities (as shown in Table 2).
Using the regression coefficients from a specification similar to that in the first column of Table 4 but without the interacted political variables, we calculate how much of the difference in the average incomes of Party and non-Party households is due to differences in these explanatory variables. Here we use a linear specification because it allows a decomposition that is more intuitive than the semi-log (and anyway the estimates of the two are very similar). Notably, the coefficient on the village-level cadre variable is about 20% of sample average income and there is a negligible Communist Party advantage in both cases. Column 1 of Table 5 gives the estimated coefficients from the linear specification. Column 2 gives the share of the difference between average incomes for Party and non-Party households explained by different household characteristics. The
¯ ¯ ¯
share of the difference explained by variable k is calculated asbk(Xck2X ) /(Yk c2
¯ ¯
Y ), wherebk is the regression coefficient for variable k, Xck is the average value of
¯
variable k conditional on being in group c, X is the sample average of variable k,k
¯ ¯
and Y and Y are the analogues for per capita income.c
23
Table 5
Percentages of the difference between group and sample average income per capita explained by a
different household characteristics
(1) Regression (2) Households (3) Households coefficient with a Party with a
village-member level cadre
Village-level cadre 282.4** 47.9 112.0
Sub-village cadre 197.6 22.3 29.4
Communist Party member 28.6 8.8 2.6
Land per capita (mu) 180.4** 7.4 22.0
Number of plots 244.5 2.9 8.7
Household size 291.4** 24.6 8.0
Average adult age 5.7 0.2 24.0
Workers per capita 309.9** 21.3 21.4
Adult male share 235.2 21.3 21.9
Education (years) 196.7** 0.9 214.3
Poor-peasant class 2168.0 27.7 26.6
Village, year dummies – 53.9 4.0
Residual – 25.2 20.5
a
Calculations are based on coefficients from a linear GLS regression with household-level random effects. The coefficients are in the first column. The quadratic term on education takes a coefficient of
2
218.1 with a standard error of 6.8. The adjusted R is 0.40. **, significant at 95% level in base regression. (15 mu51 hectare.)
Direct returns to Party membership explain less than 10% of the difference between the average incomes of households with and without Party members. The higher level of education of Party-member households explains less than 1% of the difference in incomes. The small contribution of education to the income differential is due to the fact that average levels of education for these groups are close to the level that maximizes income. The marginal effect of education is positive until about 5.7 years. Therefore, the return to increasing education from the sample average level of 5.3 years to the Party-member household average of 6.1 years is small. (The figures for education in Table 5 are the sum of the linear and squared effects.)
Instead, two variables explain most of the difference: cadre status and village of residence. The presence of a village-level cadre explains nearly 50% of the income differential between households with and without Party members. The remaining 50% is explained by location of residence, as captured by the village dummy
24
variables. Party members in our sample have a higher probability of living in
richer villages.
These calculations reveal that having a Party member is advantageous, but the
24
main advantage lies in the fact that being a Party member increases the possibility of holding a cadre post at or above the village level. This suggests that if cadre selection were changed so that these positions were increasingly held by non-Party members, the income differential between Party and non-Party households would decline sharply. Our finding is consistent with the that of Oi (1989, pp. 133–134) who, on the basis of qualitative interviews, concludes that Party membership is only important through increasing the chances of holding office as a cadre.
25
Households in rural China cannot move freely from one village to another. For
this reason, joining the Party does not increase the probability that a household will move to a wealthier village (although it might increase the chances of moving out of the village to the township or county, but this would not be captured in our data set). Thus, the correlation between Party membership and residence in wealthier villages in our sample suggests that in Zouping the Party tends to select
26 more members from wealthier villages.
7. The sources of political rents of cadres
Column 3 of Table 5 shows similar calculations for households with village-level cadres. Over 100% of the difference between households with and without village-level cadres is explained by the coefficient on the cadre dummy variable, a measure of the political rents directly associated with the position. None of the remaining variables, including the village dummy variables, explains much of the cadre advantage. The advantages of joining the Party and being a cadre are thus inherently different. Unlike for Party membership, the main benefit of being a village-level cadre is direct and inherent in holding the position.
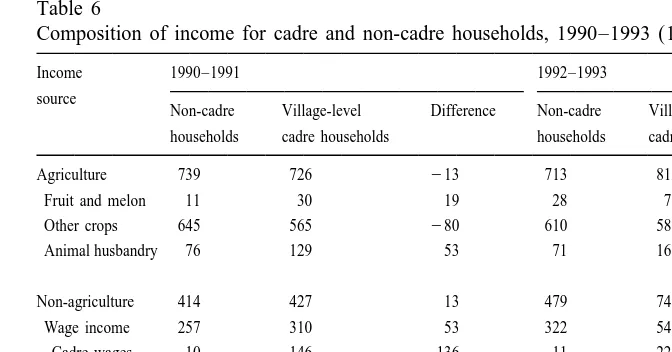
What are the mechanisms generating these political rents? Descriptive statistics on the composition of income for households with and without village-level cadres provide suggestive evidence (Table 6). Here we present statistics for 1990–1991 and 1992–1993 separately so as to highlight the differences between the first and second halves of the survey period. In 1990–1991 the overall level and structure of income for households with village-level cadres are similar to those of households without village-level cadres. While there are some compositional differences in non-agricultural and agricultural incomes of the two groups, the difference in total
25
Migration is primarily from villages to towns and cities, rather than from one village to another (except in the case of marriages, where the bride normally moves to the village of the groom).
26
Table 6
a Composition of income for cadre and non-cadre households, 1990–1993 (1990 yuan)
Income 1990–1991 1992–1993 source
Non-cadre Village-level Difference Non-cadre Village-level Difference households cadre households households cadre households
Agriculture 739 726 213 713 812 99
Fruit and melon 11 30 19 28 71 43
Other crops 645 565 280 610 580 230 Animal husbandry 76 129 53 71 161 90
Non-agriculture 414 427 13 479 748 269 Wage income 257 310 53 322 541 219 Cadre wages 10 146 136 11 226 215 Other wages 248 164 284 311 316 5 Sideline income 197 151 248 200 213 13
Other income 13 13 0 13 31 18
Total income 1157 1161 4 1203 1576 373
a
These numbers are in per capita terms. The components of income do not add up exactly due to the exclusion of several minor items and because totals are divided by family size. ‘Other income’ includes remittances, gifts, inheritances, and government transfers for relief. Non-cadre households include households with sub-village cadres.
household income per capita is trivial, as are differences in the shares of income 27
coming from agricultural vs. non-agricultural sources.
This picture changes in 1992–1993, when the income of households with village-level cadres is 30% higher than that of households without. Cadre households now earn higher income in both agriculture and non-agriculture. The largest single factor explaining this income differential is wage income, which is now 70% higher for cadre households than non-cadre households. While wage income for both cadre and non-cadre households rose substantially in 1992–1993, the increase was larger for cadre households. In particular, while in the earlier period wage earnings associated with the cadre position itself were offset by lower wages from other employment, in 1992–1993 cadre households experienced a rise in non-cadre off-farm employment leading to higher ‘other’ wage income.
This rapid increase in ‘other’ wages, in addition to the wages from having cadre employment, indicates that cadre households benefitted more than non-cadre households from the growth in wage employment opportunities that occurred during the acceleration of reform. Indeed, the pattern of change in wage incomes
27
suggests that when growth was slow and opportunities limited, egalitarian 28
concerns influenced the local allocation of scarce wage jobs. Only in a setting of
growing job availability — a growing ‘job’ pie — did local cadres use their control and connections to increase their share of the pie.
The second most important factor explaining higher income in cadre households during 1992–1993 is income from high-value agricultural activities such as fruit and melon production and animal husbandry. In 1992–1993 cadre households derived nearly twice as much income from these activities as non-cadre house-holds. If carried out on any scale, these sorts of activities typically require access to extra land, unencumbered by grain or other crop quotas, so as to allow the planting of orchards or construction of chicken coops or animal enclosures. Village cadres have influence over collective land and quota allocations. Perhaps not surprisingly, then, cadres are over-represented at the highest end of both fruit and livestock activities. While households with village-level cadres make up 10% of the sample, they comprise about 20% of the top 5% of earners from both animal husbandry and from fruit and melon production. Their concentration in the top 1% of earners in these two activities is even more dramatic: they comprise 38% and 33%, respectively, of the top 1% of earners for animal husbandry and fruit or melon production.
The statistics in Table 6 therefore imply that households with village-level cadres benefit from the acceleration of reform, and that the mechanisms generating political rents provide cadres with incentives to support and promote market liberalization. Cadre households gain from policies that support growth in township and village enterprises and thus in wage employment. Cadre households also gain from policies that promote markets for specialized agricultural products, including the building of public infrastructure such as roads; the reduction of quotas, taxes, and licenses, and the promotion of incomes and local demand.
8. Political rents and inequality
As Robinson (1997) suggests, a population will be most willing to accept political pay-offs when everyone gains in the process, i.e. when inequality remains relatively low. If rents are too great they function as a distortionary tax and can create political tension. Rents, however, do not appear to be grossly disproportion-ate. While households with cadres comprise 13–16% of the populations of the villages on average, their share of total village income is just 16–18%. By the same token, political rents have had very little impact on overall inequality. In our
28
sample the Gini coefficient rises slightly from 0.29 to 0.34 between 1990 and 29
1993, but these numbers are low by international standards. If rents from having
a cadre position were totally eliminated, the Gini coefficients would remain nearly unchanged at 0.29 in 1990 and 0.33 in 1993.
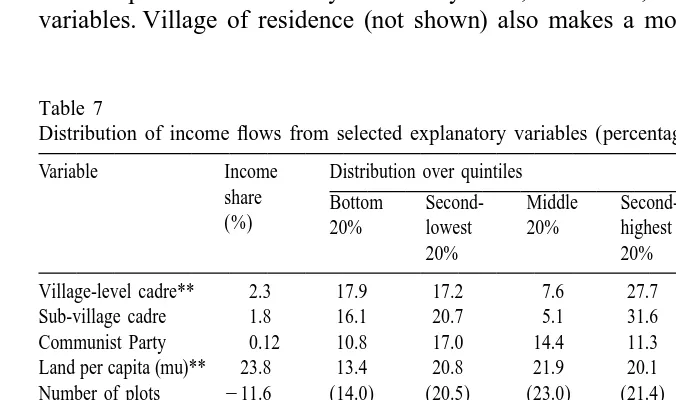
Table 7 shows the role of political rents in the overall income distribution. The first column in the table gives average income shares of key explanatory variables, calculated by multiplying the mean value of each explanatory variable by its estimated coefficient from the earnings equation reported in Table 5, and then dividing by sample average income per capita. These income shares measure the average contribution of the explanatory variables to average income. None of the political variables makes a large contribution to average income. Instead, average income patterns are mainly driven by land, education, and the demographic variables. Village of residence (not shown) also makes a moderate contribution.
Table 7
a Distribution of income flows from selected explanatory variables (percentages)
Variable Income Distribution over quintiles Ratio of share Bottom Second- Middle Second- Top top 20% to (%) 20% lowest 20% highest 20% bottom 20%
20% 20%
Village-level cadre** 2.3 17.9 17.2 7.6 27.7 29.6 1.66 Sub-village cadre 1.8 16.1 20.7 5.1 31.6 26.5 1.64 Communist Party 0.12 10.8 17.0 14.4 11.3 46.4 4.28 Land per capita (mu)** 23.8 13.4 20.8 21.9 20.1 23.8 1.78 Number of plots 211.6 (14.0) (20.5) (23.0) (21.4) (21.0) 1.51 Household size** 227.2 (18.5) (20.4) (20.8) (19.1) (21.2) 1.14 Average adult age 6.7 20.1 19.2 20.7 19.0 21.1 1.05 Workers per capita* 16.7 21.0 18.5 18.5 19.4 22.6 1.08 Adult male share 9.3 19.4 20.7 19.3 18.2 22.4 1.16 Education (years)** 36.9 19.2 18.6 18.3 20.3 23.7 1.23 Poor-peasant Class** 27.4 (26.6) (27.0) (13.7) (16.9) (15.9) 0.60 Middle-peasant 20.41 (5.8) (5.8) (20.2) (47.9) (20.3) 3.50 Rich / landlord class 0.22 38.9 13.6 20.8 0.0 26.7 0.69 Income per capita 100.0 7.9 13.4 17.2 21.4 40.1 5.10
a
Parentheses indicate negative income flows. The income shares for education and age reflect the sum of the variables in levels and their squares. Figures are calculated using 4-year averages of household income. ** (*), statistically significant at the 95% (90%) level in the base regressions. (15 mu51 hectare.)
29
The remaining columns of Table 7 show how income flows derived from the explanatory variables are distributed among quintiles in the distribution of total income. The calculations again use the regression results from Table 5. Income flows from education and the demographic variables are distributed relatively equally: each quintile receives roughly one-fifth of the income generated by these variables, and the ratio of income going to the top 20% vs. the bottom 20% is fairly close to one.
In contrast, the distribution of income flows from Party affiliation is highly uneven. Only 10.8% of the income derived from Party affiliation goes to the bottom quintile, while 46% goes to the top quintile. While uneven, however, income flows associated with Party affiliation contribute only 0.12% of average income, so that their impact on overall inequality is modest. Having a village-level cadre also has little impact on overall inequality. The distribution of income flows to cadres is relatively equal, the average contribution to overall income is small. Notably, the most important determinants of income are not political variables, but other household characteristics such as land, demographic composition, and education. These characteristics are relatively equitably distributed. Thus, in key areas the playing field is fairly level, and so both households with cadres and households without cadres are able to benefit from economic growth.
9. Conclusions
China has undertaken broad reforms in both the urban and rural sectors, and its record of growth has been enviable. The reforms have been implemented by rank-and-file cadres who potentially stood to lose in the process, and so could have stymied efforts to liberalize the economy. We find, however, that rank-and-file cadres in a typical county in northern China have continued to enjoy political rents, and that the rents are positively associated with the pace of reform.
Our findings run counter to the view that successful transition toward a market economy naturally eliminates the benefits of political status. Our findings also show that only some, not all, political characteristics continue to generate rents in the reform environment. In our sample, for example, being a Communist Party member confers no direct rents. The main advantage of Party membership in Zouping is indirect and lies in the higher probability of obtaining a post as a cadre at the village level or higher.
reform when they face appropriate incentives, and they reveal the types of mechanisms that underlie those incentives. In our sample, cadre advantages are derived largely from preferential access to wage employment and productive assets. Wage employment here is largely in rural collective enterprises. Productive assets include rights to use collective land that is relatively unencumbered by quotas and other restrictions. Collective enterprises and collective land are both managed by local cadres. Both wage employment and the returns to high-value agricultural production are positively affected by growing markets, rising con-sumer demand, and the provision of infrastructure and public services. Thus, the evidence is consistent with an environment characterized by an implicit, perform-ance-based incentive contract that reinforces ongoing, successful reforms.
Finally, examination of the distribution of income provides a reason why these mechanisms have been politically feasible at the local level. The evidence reveals that cadres’ incomes go up when local income goes up, but not disproportionately. Thus, the implicit tax rate of local officials is not so high as to stifle local growth. Moreover, at the local level income distribution is relatively equal, and the impact of political rents on overall inequality is small. The overall income distribution is driven not by political rents, but by income flows derived from equally distributed household characteristics including land endowments, household demographic characteristics such as the number of adult workers, and education. Since further market liberalization will likely enhance the income flows from these sorts of household characteristics, well-designed reforms can provide opportunities not just for bureaucrats, but also for the broader population.
Acknowledgements
We have benefitted from comments from Andrei Shleifer, Yingyi Qian, Carl Riskin, Roger Gordon, two anonymous referees, and participants at seminars at Harvard–MIT, the University of Western Ontario, the Hoover Institution, Colum-bia, and the Northeastern Universities Development Consortium Conference. We thank Sarah Cook and Joseph Zveglich for their assistance with research and fieldwork. Financial support was provided by the National Science Foundation under awards SES-9211260 and SES-8908438, and by the Social Science and Humanities Research Council of Canada and the Committee on Scholarly Communication with China. All views presented are those of the authors, who are responsible for any errors.
Appendix A
Determinants of log per capita household income: household-level fixed-effects estimates (n51009)
Variable (1) (2)
Party member 20.03 (0.10) 20.02 (0.10)
Village cadre 0.21* (0.12)
Sub-village cadre 0.17 (0.21) 0.18 (0.21)
Village cadre31990 0.22* (0.14)
Village cadre31991 0.06 (0.14)
Village cadre31992 0.21* (0.13)
Village cadre31993 0.27** (0.13)
2
R 0.32 0.33
Standard errors are in parentheses. Only the key political variables are reported here. The specifications exclude interacted Party–village cadre and Party–sub-village cadre variables, but include year and interacted year–Party–sub-village fixed effects, as well as education, education squared, per capita land, number of plots, household size, number of workers per capita, average age (and square of age) of adults in household, and share of adults that are male. ** (*), statistically significant at 95% (90%) confidence level.
References
Chan, A., Madsen, R., Unger, J., 1992. Chen Village Under Mao and Deng. University of California Press, Berkeley.
Che, J., 1997. To tie the grabbing hand, Mimeo, Department of Economics, University of Notre Dame. Che, J., Qian, Y., 1997. Insecure property rights and government ownership of firms, Mimeo,
Department of Economics, Stanford University.
Cook, S.B., 1996. Employment and income distribution in rural China: Household responses to market transition, Ph.D. Thesis, Harvard University.
Deininger, K., Squire, L., 1996. Measuring income inequality: A new data-base. World Bank Economic Review 10 (3), 565–591.
Friedman, E., Pickowitz, P.G., Selden, M., Johnson, K.A., 1991. Chinese Village, Socialist State. Yale University Press, New Haven.
Frye, T., Shleifer, A., 1997. The invisible hand and the grabbing hand. American Economic Review 87 (2), 354–358.
Hare, D., 1994. Rural nonagricultural activities and their impact on the distribution of income: Evidence from farm households in Southern China. China Economic Review 4 (1), 59–82. Hellman, J.S., 1998. Winners take all: The politics of partial reform in postcommunist transitions.
World Politics 50, 203–234.
Ho, S.P.S., 1994. Rural China in Transition: Non-Agricultural Development in Rural Jiangsu, 1978– 1990. Clarendon Press, Oxford.
Kelliher, D., 1997. The Chinese debate over village self government. China Journal 37, 63–86. Khan, A.R., Griffin, K., Riskin, C., Zhao, R., 1993. Household income and its distribution in China. In:
Griffin, K., Zhao, R. (Eds.), The Distribution of Income in China. Macmillan Press, New York. Knight, J., Song, L., 1993. Workers in China’s rural industries. In: Griffin, K., Zhao, R. (Eds.), The
Distribution of Income in China. Macmillan Press, New York.
Li, D.D., 1996. A theory of ambiguous property rights in transition economies: The case of the Chinese non-state sector. Journal of Comparative Economics 23 (1), 1–19.
Myers, R.H., 1995. Chinese debate on economic reform: Can China create a socialist market economy? Asian-Pacific Economic Literature 9 (2), 55–68.
Nee, V., 1989. A theory of market transition: From redistribution to markets in state socialism. American Sociological Review 54 (5), 663–681.
Nee, V., 1991. Social inequalities in reforming state socialism: Between redistribution and markets in China. American Sociological Review 56 (3), 267–282.
Nee, V., 1996. The emergence of a market society: Changing mechanisms of stratification in China. American Journal of Sociology 101 (4), 908–949.
Oi, J.C., 1989. State and Peasant in Contemporary China. University of California Press, Berkeley. Oi, J.C., 1998. Local state corporatism: The organization of rapid economic growth. In: Walder, A.G.
(Ed.), Zouping in Transition: The Process of Reform in Rural China. Harvard University Press, Cambridge, MA.
Potter, S.H., Potter, J.M., 1990. China’s Peasants: The Anthropology of a Revolution. Cambridge University Press, New York.
Robinson, J.A., 1997. When is a state predatory? Mimeo, Department of Economics, University of Southern California.
´
Rona-Tas, A., 1994. The first shall be last? Entrepreneurship and Communist cadres in the transition from socialism. American Journal of Sociology 100 (1), 40–69.
Rozelle, S., 1996. Stagnation without equity: Changing patterns of income and inequality in China’s post-reform rural economy. China Journal 35, 64–92.
Sicular, T., 1998. Establishing markets: The process of commercialization in agriculture. In: Walder, A.G. (Ed.), Zouping in Transition: The Process of Reform in Rural China. Harvard University Press, Cambridge, MA.
State Statistical Bureau, various years. China Statistical Yearbook (zhongguo tongji nianjian), China Statistical Publishing House, Beijing.
´
Szelenyi, I., 1988. Socialist Entrepreneurs. Embourgeoisement in Rural Hungary. Wisconsin University Press, Madison.
Walder, A.G. (Ed.), 1998. Zouping in Transition: The Process of Reform in Rural China. Harvard University Press, Cambridge, MA.