Summary One-year-old rooted cuttings of olive (Olea europaea L. cvs. Frantoio and Leccino) were grown either hydroponically or in soil in a greenhouse. Plants were exposed to NaCl treatments (0, 100, and 200 mM) for 35 days, followed by 30 to 34 days of relief from salt stress to determine whether previously demonstrated genotypic differences in tolerance to salinity were related to water relations parameters. Exposure to high salt concentrations resulted in reductions in predawn water potential (Ψw), osmotic potential at full turgor (ΨπFT),
osmotic potential at turgor loss point (ΨπTLP), and relative water
content (RWC) in both cultivars, regardless of the growth substrate. Leaf Ψw and RWC returned to values similar to those
of controls by the end of the relief period. The effect of salinity on Ψπ appeared earlier in Leccino than in Frantoio. Values for ΨπFT were −2.50, −2.87, and −3.16 MPa for the 0, 100, and
200 mM salt-treated Frantoio plants, respectively, and −2.23, −2.87, and −3.37 MPa for the corresponding Leccino plants. Recovery of Ψπ was complete for plants in the 100 mM salt treatment, but not for plants in the 200 mM salt treatment, which maintained an increased pressure potential (Ψp)
com-pared to control plants. Net solute accumulation was higher in Leccino, the salt-sensitive cultivar, than in Frantoio. In controls of both cultivars, cations contributed 39.9 to 42.0% of the total ΨπFT, mannitol and glucose contributed 27.1 to 30.8%, and
other soluble carbohydrates contributed 3.1 to 3.6%. The os-motic contribution of Na+ increased from 0.1--2.1% for non-treated plants to 8.6--15.5% and 15.6--20.0% for the 100 mM and 200 mM salt-treated plants, respectively. The mannitol contribution to ΨπFT reached a maximum of 9.1% at the end of
the salinization period. We conclude that differences between the two cultivars in leaf water relations reflect differences in the exclusion capacities for Na+ and Cl− ions.
Keywords: osmotic adjustment, pressure-volume isotherms, relief from salinity, turgor loss point.
Introduction
Olive (Olea europaea L.) is more salt tolerant than other woody crops and has great potential for cultivation in areas, such as the Mediterranean region, where salinity is becoming a major problem. Salt tolerance in olive is cultivar-dependent.
Frantoio and Leccino, the two cultivars used in the present study, differ in their capacity to exclude Na+ or Cl− ions from the shoot when NaCl is applied to the rooting medium (Tattini et al. 1992, Tattini 1994). A previous study showed that in-creasing the NaCl concentration from 0 to 200 mM signifi-cantly decreased leaf water potential (Ψw) in the salt-tolerant
Frantoio cultivar; however, this reduction was accompanied by a decrease in osmotic potential (Ψπ), so that leaf turgor of the salinized plants was maintained (Tattini et al. 1995).
Salt stress changes the water relations of most higher plants, and salt tolerance often depends on drought tolerance (Green-way and Munns 1980, Flowers and Yeo 1986). Changes in Ψw,
Ψπ, leaf succulence, cell wall extensibility, and bulk leaf modulus of elasticity (ε) have been reported for herbaceous crops exposed to increased salt concentrations (Longstreth and Nobel 1980, Neumann et al. 1988, Erdei and Taleisnik 1993). No similar studies have been reported for olive. Olive trees are drought tolerant, and leaves can reach extremely low values of Ψw and relative water content (RWC) (−3.5 MPa and 75--80%,
respectively) before losing turgor (Hinckley et al. 1980, Lo Gullo and Salleo 1988, Larsen et al. 1989). Seasonal and diurnal declines in leaf Ψw are mainly attributed to inelastic
cell walls, osmotic adjustment, and transpirational losses, which continue even at low Ψw (Lo Gullo and Salleo 1988). In
addition, olive leaves often experience a diurnal osmotic stress during the dry season because the high hydraulic resistance of the stem causes the development of water deficits in leaves (Larsen et al. 1989, Lo Gullo and Salleo 1990).
In the present study, olive plants of two cultivars, growing in either hydroponic or soil culture, were subjected to salinization and subsequent relief. The objective was to elucidate the con-tribution of changes in leaf water relations to the differences in salt tolerance exhibited by the cultivars.
Materials and methods
Plant material and salinity treatments
One-year-old rooted cuttings of the olive cultivars Frantoio and Leccino were grown in a greenhouse from April to Sep-tember 1994, either hydroponically or in soil. Plants were trained to two shoots, as previously described (Tattini et al.
Analysis of leaf water relations in leaves of two olive (
Olea europaea
)
cultivars differing in tolerance to salinity
RICCARDO GUCCI,
1LEONARDO LOMBARDINI
1and MASSIMILIANO TATTINI
21
Dipartimento di Coltivazione e Difesa delle Specie Legnose, Sezione Coltivazioni Arboree, Università di Pisa, Via del Borghetto 80, Pisa 56124, Italy
2 Istituto sulla Propagazione delle Specie Legnose -- CNR, Via Ponte di Formicola 76, 50018 Scandicci (FI), Italy
Received January 8, 1996
1995). About 300 plants of both cultivars were transplanted to a quartz sand hydroponic culture system at Scandicci (43°45′ N, 11°11′ E) on March 1, 1994 and acclimated until April 27, 1994, when salt treatments were initiated. Plants received half-strength Hoagland solution twice a day (Tattini et al. 1995). A separate group of 150 plants from the same batch of rooted cuttings was grown in 1-liter containers at Scandicci and then transferred to Pisa (43°43′ N, 10°25′ E) on June 24, 1994. The plants were grown in a substrate of 1/1/1 fertilized peat/perlite/field soil. Plants in containers were irri-gated two to four times per week, depending on the evaporative demand, and received either half-strength Hoagland solution or a fertilizer solution containing 5 g l−1 of 18/9/18 N,P,K once or twice a week.
Plants in both hydroponic and soil culture were subjected to 35 days of increased salinity, followed by 30 to 34 days of relief. In hydroponic cultures, 0, 100, or 200 mM NaCl was added to the standard nutrient solution (Tattini et al. 1995). In soil cultures, NaCl concentrations were increased by 50 mM day−1 until final concentrations of 0, 100, and 200 mM were reached, containers were covered with plastic film to reduce evaporation from the soil surface, and plants were watered with excess solution to prevent the occurrence of salt gradients in the container profile. The concentration of the soil solution leaching from the bottom of the container after irrigation was periodically checked with a Wescor 5500 vapor pressure os-mometer (Wescor Inc., Logan, UT) and was usually within 20% of the concentration of the nutrient solution. At the end of the salinization period, stress was relieved by supplying the nutrient solution only (Tattini et al. 1995).
A randomized complete block design was adopted with nine plants per treatment arranged in blocks according to location in the greenhouse.
Leaf water relations
Relative water content (RWC) was determined on three to four fully expanded leaves of similar age (15 to 25 days old). Leaves were excised before dawn, weighed fresh (FW) and placed in vials to rehydrate in the dark for 20 h. Preliminary experiments had indicated that full rehydration was complete after 18 h. The following morning, leaf turgid weight (TW) was measured and then leaves were dried at 80 °C for 48 h and dry weight (DW) was determined. The RWC was calculated from the equation:
RWC = 100[(FW − DW)/(TW − DW)]. (1)
Predawn Ψw of three to six leaves per treatment was
meas-ured at approximately 10-day intervals with a pressure cham-ber (TecnoGas, Pisa, Italy), according to a standard technique (Ritchie and Hinckley 1975). After the Ψw measurement, the
leaves were immediately frozen in liquid nitrogen and stored at −80 °C for determination of Ψπ with a Wescor 5500 vapor pressure osmometer (Tattini et al. 1995). Leaf turgor potential (Ψp) was calculated as the difference between Ψw and Ψπ.
Osmotic potential at full turgor (ΨπFT) was determined from
pressure-volume curves or calculated using the equation pro-posed by Wilson et al. (1979):
ΨπFT =Ψπ[(RWC −A)/(100 −A)], (2)
where A is the apoplastic water fraction, estimated at 4.4% in olive leaves (see analysis of pressure-volume isotherms). Os-motic adjustment resulting from net solute accumulation was estimated as the difference between total change in Ψπ and the change resulting from dehydration (D) and non-osmotic vol-ume (V). In this procedure, changes in Ψπ and ΨπFT (∆Ψπ and
∆ΨπFT) induced by salinity were calculated by comparing
pre-dawn Ψπ of plants in NaCl treatments with predawn Ψπ of control plants, according to the following equations (Girma and Krieg 1992):
∆Ψπ=Ψπ,salt−Ψπ,control (3)
∆ΨπFT=ΨπFT ,salt−ΨπFT ,contr ol. (4)
The contribution of dehydration (D) to changes in Ψπ was calculated as:
D=∆Ψπ−∆ΨπFT. (5)
Similarly, changes in solute concentration resulting from changes in the non-osmotic volume at 100% hydration were estimated from changes in the TW/DW ratio between the control and the various salt treatments (Girma and Krieg 1992):
Leaf mass per unit area and succulence index (water per unit leaf area) were measured at the end of the salinity and relief periods on four to six fully expanded leaves of plants growing in hydroponic culture. Leaf area was measured with a leaf area meter (Delta-T Devices, Burwell, Cambridge, U.K.).
Pressure-volume isotherms
Pressure was then slowly reduced by 0.10--0.15 MPa and then increased until sap flowed again. At this point, the balance pressure was recorded as the leaf Ψw. Leaves were dried on the
laboratory bench at 23 °C to achieve progressive dehydration of the tissue, and the Ψw determination was repeated nine to 15
times. Four to 10 data points in the region of zero turgor and three to seven data points in the positive turgor range were typically obtained for one P-V isotherm. A period of 8--9 h was necessary to produce a complete P-V isotherm.
Pressure-volume isotherms were analyzed by type II trans-formation (Tyree and Richter 1982). The point indicating de-parture from linearity corresponded to the turgor loss point (TLP). The TLP was determined iteratively by non-linear least squares analysis (Schulte and Hinckley 1985). Fully turgid weight was estimated as the intercept of the linear regression (R2 > 0.99) of fresh weight versus Ψw between 0 and −1.4 MPa
balancing pressures (Wilson et al. 1979). The estimated leaf TW was then used to calculate the RWC corresponding to each Ψw. Individual P-V isotherms were analyzed by fitting a least
square linear regression (R2 > 0.995) to four to 10 data points situated in the linear region of each data set, except in three cases when only three data points were obtained in the linear region. The intersection of this straight line with the y-axis corresponded to the osmotic potential at full turgor (ΨπFT),
whereas the intersection with the x-axis (Ψw−1 = 0) gave the
value of the apoplastic water fraction (Schulte and Hinckley 1985). Bulk leaf modulus of elasticity (ε) was calculated by non-linear least square analysis using a modified exponential equation (Schulte and Hinckley 1985). A total of 110 P-V isotherms were analyzed, 18 of which were eliminated because they did not meet the statistical requirements.
Analysis of cations and soluble carbohydrates, and calculation of osmotic contribution
Cations (Na+, K+, Ca2+ and Mg2+) and soluble carbohydrates (glucose, galactose, mannitol, fructose, myo-inositol, sucrose, raffinose and stachyose) were analyzed in leaves sampled for Ψπ at the beginning and end of the stress and relief periods. Cation concentrations were determined with a Perkin-Elmer M1100 emission-absorption spectrophotometer (Perkin Elmer Co., Norwalk, CT), as described previously (Tattini et al. 1995). Soluble carbohydrates were determined by HPLC: car-bohydrates were separated on an 8 × 300 mm SC1011 column (Showa Denko, Tokyo, Japan) equipped with an 8 × 50 mm SC1011 pre-column eluted with water/acetonitrile (95/5, v/v) at a flow rate of 0.5 ml min−1. The columns were maintained at 90 °C by a column heater module (Tattini et al. 1996).
Osmotic contribution of solutes was calculated by the Van’t Hoff equation:
Ψπι=−0.002479(RDW)C, (7)
where Ψπι indicates the contribution (in MPa) of individual solutes to Ψπ, RDW is the relative dry weight at saturation (kg m−3), C is the molar concentration of solutes (mol kg−1), and −0.002479 m3 MPa mol−1 is the RT value at 25 °C. Solutes
were assumed to have an ideal osmotic behavior (Alarcon et al. 1993).
Results
Effects of salt exposure on leaf water relations
Salinity markedly decreased leaf predawn Ψw of both Frantoio
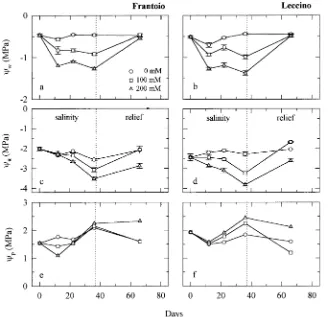
and Leccino olive plants grown in hydroponic culture. Differ-ences in Ψw were significant from 12 days after the beginning
of salinization and increased with increasing NaCl concentra-tion of the external soluconcentra-tion (Figures 1a and 1b). The effect of salinity on leaf Ψπ appeared earlier in Leccino than in Frantoio. Leaf Ψπ of Leccino was reduced from 22 days after the begin-ning of salinization, whereas Ψπ of Frantoio was affected only after 35 days (Figures 1c and 1d). As a result, Leccino plants showed a higher bulk leaf Ψp than controls after 22 and 35 days
of treatment, whereas Frantoio plants had a lower Ψp than
controls after 12 days (Figures 1e and 1f). Predawn Ψw of
salt-treated plants returned to control values at the end of the relief period in both cultivars. At that time, recovery of Ψπ was complete for plants in the 100 mM NaCl treatment, but not for plants in the 200 mM treatment, which had lower Ψπ values than the control plants. Because Ψπ of plants in the 200 mM treatment did not return to control values during relief, Ψp was
higher for 200 mM salt-treated plants than for plants in the other treatments (Figures 1e and 1f). Similar trends in Ψw, Ψπ
and Ψp were obtained for both cultivars grown in soil culture,
and both recovered their initial Ψw eight days after the
begin-ning of relief (data not shown). Recovery of Ψπ for the 100 mM salt-treated plants was complete eight days after the beginning of relief in both cultivars (data not shown).
There were no differences in predawn RWC between Fran-toio and Leccino plants during the salt treatment or relief period (Figure 2). Twenty days of salinization were sufficient to decrease the RWC of both cultivars, and this decrease was more evident in plants in the 200 mM than in plants in the 100 mM NaCl treatment. Recovery of RWC to control values was complete 27 days after the beginning of the relief period (Figure 2). The leaf DW/FW ratio increased more in Frantoio than in Leccino when both cultivars were exposed to increased salt concentrations, but differences were significant only be-tween the 0 and 200 mM NaCl treatments in Frantoio plants. There were no significant differences in dry weight to leaf area ratio (DW/LA) or succulence index between salt treatments or cultivars (Table 1).
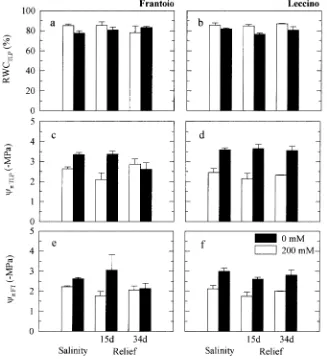
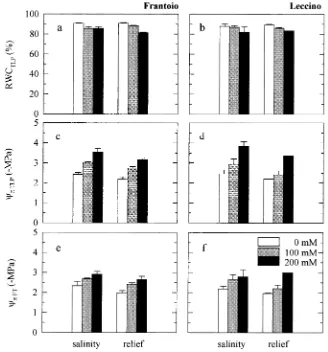
Because there were no major differences between P-V iso-therms derived from plants grown in hydroponic culture and plants grown in soil culture, the data are discussed together (Figures 3 and 4). Salinity had a similar effect on leaf RWCTLP
of both cultivars. By the end of the stress period, leaf RWCTLP
had decreased from 85.5--88.3% for Leccino control plants to 81.8--76.5% for Leccino plants in the 200 mM NaCl treatment, and from 85.2--90.6% to 77.7--85.4% for the corresponding treatments in Frantoio. Both ΨπTLP and ΨπFT were decreased
by exposure to increased salt concentration. In general, ΨπTLP and ΨπFT followed parallel patterns during the salt stress and,
corresponding values in control plants (Figures 3 and 4). For plants salinized hydroponically, the decrease of both ΨπTLP and ΨπFT was more marked in Leccino than in Frantoio
(Fig-ures 3 and 4). Salinity had no apparent effect on ε of either cultivar (data not shown).
Factors contributing to salt-induced changes in leaf osmotic potential
The differences between Ψπ of control and treated plants (∆Ψπ) increased either when salt concentration was increased or stress duration was extended (Table 2). The value of ∆Ψπ was higher in Leccino than in Frantoio (maxima of 1.54 and 0.96 MPa, respectively, Table 2). The contribution of
non-os-motic volume changes induced by salt stress accounted for less than 8.7% of the observed ∆Ψπ in both cultivars. Compared to controls, the contribution of dehydration (MPa) increased by 56--58% in the 100 mM NaCl treatment and by 20--21% in the 200 mM NaCl treatment during the 23--35-day period of stress. During the 23--35-day period, as compared with the 0--22-day period, the difference in ∆Ψπ between the 0 and 100 mM treatments increased by 118--122%, and the differ-ence in ∆Ψπ between the 0 and 200 mM treatments increased by 54--81%. Therefore, dehydration contributed less to total ∆Ψπ in the 23--35-day period of salt stress than in the 0--22-day period (Table 2). Net solute accumulation was 6.2--7.3% higher in Leccino than in Frantoio during the first 22 days of
Figure 1. Changes in predawn leaf water potential (Ψw), osmotic
poten-tial (Ψπ), and turgor potential (Ψp) of
olive cultivars Frantoio (a, c, e) and Leccino (b, d, f ) exposed to different NaCl concentrations in hydroponic culture. Vertical dotted lines indicate the beginning of the relief period. Data points are means ± SE of three to six replicate leaves, except for Ψp
which was calculated as the differ-ence between mean values of Ψw and
Ψπ.
salt exposure, but was similar for the two cultivars in the 23--35-day period. Osmotic adjustment resulting from net sol-ute accumulation reached a maximum of 70.9 and 73.6% of total ∆Ψπ in Frantoio and Leccino, respectively, at the end of the salinization period. During the first three weeks of salini-zation, net solute accumulation (percent) was higher for plants
in the 100 mM treatment than for plants in the 200 mM treatment (Table 2).
Cations contributed 39.9 and 42.1% to leaf ΨπFT in Frantoio
and Leccino control plants, respectively (Table 3). Glucose and mannitol, the two most abundant soluble carbohydrates in olive leaves (Tattini et al. 1996), contributed 27.1--30.8%. Salinity increased the osmotic contribution by Na+ in both cultivars. Leccino plants had a lower exclusion capacity for Na+ than Frantoio plants, and Na+ contribution to total ΨπFT
was lower in Frantoio than in Leccino plants. Contribution to ΨπFT by other cations (K+, Ca2+, Mg2+) was diminished in
salt-exposed plants. Mannitol concentration increased by 37--39% in both cultivars, but its relative contribution was less than 9.2% in both cultivars. Glucose contributed 17.0--22.7% of total ΨπFT. The osmotic contribution by other soluble
carbohy-drates (fructose, myo-inositol, sucrose, raffinose and stachyose) was less than 3.7% of total ΨπFT in control plants
and was reduced to 1.9--2.1% of the total ΨπFT in the 200 mM
salt-treated plants. The difference in calculated ΣΨπι between control and salt-treated plants (65--68% and 71--73% of ΨπFT,
respectively) was caused by the increase in Cl− in salt-treated leaf tissue (Tattini et al. 1995), which was not accounted for in the calculations of Table 3. Differences between the contribu-tion to osmotic pressure of cacontribu-tions and of soluble
carbohy-Figure 3. Changes in relative water content at turgor loss point (RWCTLP), leaf osmotic potential at
turgor loss point (ΨπTLP) and at full
turgor (ΨπFT) in leaves of salt-treated
olive cultivars Frantoio (a, c, e) and Leccino (b, d, f) grown in hydroponic culture. Histograms represent means of three to six replicates, except for 200 mM Leccino (relief 34 days), with only two replicates. Bars indi-cate SE.
Table 1. Changes in dry weight/fresh weight ratio (DW/FW), leaf mass/leaf area ratio (DW/LA) and succulence index (SI) of olive leaves after 35 days of salinization of hydroponically grown olive plants. Data were analyzed by a two-factor analysis of variance. The LSD refers to means (n = 4--6) significantly different at P < 0.05 within each column.
NaCl Cultivar DW/FW DW/LA SI (mM) (mg cm−2) (mg cm−2)
0 Frantoio 0.347 13.0 24.5 100 Frantoio 0.383 13.7 22.1 200 Frantoio 0.399 14.1 21.3
0 Leccino 0.366 12.8 22.2 100 Leccino 0.368 12.9 22.1 200 Leccino 0.377 12.4 20.1
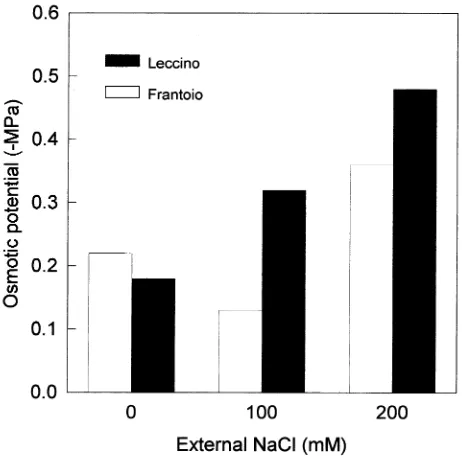
drates increased for Leccino, but not for Frantoio, over the 0--100 mM range of NaCl concentration (Figure 5). Both cultivars behaved similarly over the 100--200 mM range, al-though values of differential osmotic pressure were still lower for Frantoio than for Leccino. Although both carbohydrate and cation concentrations increased, the overall response was a result primarily of the increase in cation concentrations (Fig-ure 5).
Discussion
Through the analysis of the water relations characteristics of olive leaves, we observed a common response to salinity, regardless of the cultivar or growth substrate. Early responses to salinity included decreases in Ψw and RWC (Figures 1
and 2), similar to those reported for other species (Bañuls and Primo-Millo 1992, Alarcon et al. 1993, Walker et al. 1993).
Figure 4. Changes in relative water content at turgor loss point (RWCTLP), leaf osmotic potential at
turgor loss point (ΨπTLP) and at full
turgor (ΨπFT) in leaves of salt-treated
cultivars Frantoio (a, c, e) and Lec-cino (b, d, f ) grown in soil culture. Histograms represent means of three or four replicates, except for Leccino plants in the 200 mM NaCl treatment (relief ), with only one replicate. Bars indicate SE.
Table 2.Components of changes in leaf osmotic potential (∆Ψπ) induced by salinity in leaves of olive plants grown in hydroponic culture. Period of stress refers to days of exposure to high salt concentration. Values were calculated from means of three to six data points per treatment.
Period of NaCl Cultivar ∆Ψπ Dehydration Non-osmotic Net solute stress (days) (mM) (MPa) volume accumulation
MPa % MPa % MPa %
0--22 100 Frantoio --0.23 −0.09 39.1 −0.003 1.2 −0.14 59.7 23--35 100 Frantoio --0.51 −0.14 27.4 −0.009 1.7 −0.36 70.9
0--22 200 Frantoio --0.53 −0.25 47.2 −0.004 0.7 −0.28 52.1 23--35 200 Frantoio --0.96 −0.30 31.2 −0.054 5.6 −0.61 63.2
0--22 100 Leccino --0.44 −0.12 27.3 −0.016 3.7 −0.30 67.0 23--35 100 Leccino --0.96 −0.19 19.8 −0.063 6.6 −0.71 73.6
The decrease in RWC was a result of the high salt concentra-tion of the external soluconcentra-tion, which caused osmotic stress and dehydration at the cellular level (Greenway and Munns 1980). The high ε typical of the olive leaf (Lo Gullo and Salleo 1988), combined with leaf dehydration, probably led to the substan-tial drop in Ψw during salt stress and the rapid recovery of Ψw
on relief of stress. The salt-induced decrease in Ψw was
accom-panied by a decrease in Ψπ, thus maintaining the Ψp of
salinized plants at values similar to, or higher than, Ψp values
of control plants (Figure 1). A rapid recovery in growth pa-rameters of 100 mM salt-treated plants occurred at the end of the 30-day relief period, even though Ψp in these plants was
lower than that of the 200 mM salt-treated plants, which resumed growth more slowly (Tattini et al. 1995). These data indicate that reductions in the expansion rate of growing cells that occurred during salt stress was not related to changes in turgor of mature leaves. Higher Ψp and lower ΨπFT, ΨπTLP and
RWCTLP values in leaves of 200 mM salt-treated plants at the
end of the 30-day relief period, compared to the beginning (Figures 1, 3, and 4) were indicative of hardening processes and may represent fundamental mechanisms of adaptation to salinity or drought (Richardson and McCree 1985). There was no evidence of changes in ε of olive leaves during the salinity or relief period in our study, but the intensity of the salt treatment (duration × concentration) may not have been suffi-cient to affect ε. This possibility is supported by the observa-tion that changes in leaf morphological characteristics were less pronounced than those reported in a previous study (Bongi and Loreto 1989) in which higher NaCl concentration (250 mM), longer duration of stress (90 days), and older leaf material (6-month-old) were used.
Non-osmotic volume changes resulting from polymer accu-mulation were minor in both cultivars because only a small amount of starch is present in olive leaves exposed to increased salinity (Tattini et al. 1996). Dehydration components were higher in the 200 mM NaCl treatment than in the 100 mM
Table 3.Contribution of solutes to leaf osmotic potential at full turgor (ΨπFT) for Frantoio and Leccino olive plants after 35 days of exposure to 0,
100 or 200 mM NaCl in hydroponic culture. ‘‘Other sugars’’ includes fructose + myo-inositol, galactose, sucrose and raffinose + stachyose. ΣΨπι indicates the sum of calculated osmotic components of individual solutes. Other solutes were calculated as the difference between ΨπFT and ΣΨπι.
Percent values indicate percentage of the ΨπFT, as determined from pressure-volume isotherms. Each value is the mean of three or four
measurements.
Solute Frantoio Leccino
0 mM 100 mM 200 mM 0 mM 100 mM 200 mM
MPa % MPa % MPa % MPa % MPa % MPa %
Na+ −0.002 0.1 −0.25 8.6 −0.49 15.6 −0.05 2.1 −0.47 15.5 −0.67 20.0
K+ −0.65 26.1 −0.54 19.0 −0.51 16.1 −0.53 24.0 −0.44 14.6 −0.47 13.9
Ca2+ −0.27 10.8 −0.20 6.9 −0.17 5.3 −0.27 12.0 −0.21 7.1 −0.19 5.7
Mg2+ −0.07 2.9 −0.05 1.9 −0.05 1.5 −0.09 4.0 −0.08 2.5 −0.06 1.8
Glucose −0.49 19.5 −0.57 19.8 −0.54 17.0 −0.51 22.7 −0.56 18.7 −0.58 17.2
Mannitol −0.19 7.6 −0.26 9.1 −0.26 8.1 −0.18 8.1 −0.25 8.3 −0.25 7.4
Other sugars −0.09 3.6 −0.08 2.8 −0.06 1.9 −0.07 3.1 −0.07 2.3 −0.07 2.1
ΣΨπι −1.77 70.8 −1.95 67.9 −2.07 65.5 −1.69 75.8 −2.07 69.0 −2.29 68.2
ΨπFT −2.50 100.0 −2.87 100.0 −3.16 100.0 −2.23 100.0 −3.00 100.0 −3.37 100.0
Other −0.73 29.2 −0.92 32.1 −1.09 34.5 −0.54 24.2 −0.93 31.0 −1.07 31.8
NaCl treatment because higher NaCl concentrations increased cellular water loss (Table 2). Net solute accumulation was greater in Leccino plants than in Frantoio plants, suggesting that Ψπ values reflected the respective ability of the cultivars to exclude Na+ and Cl− (Table 3; Tattini et al. 1992, Tattini 1994). This exclusion capacity tended to become saturated when salt exposure was prolonged or when NaCl concentration was increased, consistent with current models of ion exclusion in salt-tolerant non-halophytic species (Greenway and Munns 1980, Gorham et al. 1985, Marcum and Murdoch 1994). Satu-ration occurred sooner in Leccino than in Frantoio. Leccino plants initially had a higher net solute accumulation than Frantoio plants, but the two cultivars had similar values of net solute accumulation at the end of the salinization period (Ta-ble 2). Differences in the lipid composition of root cell mem-branes may partially explain the different ion-exclusion capacities of the two cultivars during salt stress (Heimler et al. 1995).
Osmotic adjustment in olive leaves under salt stress was accomplished primarily by accumulation of inorganic ions, despite the osmotic contribution by soluble carbohydrates. Although our measurements did not account for some classes of osmotically important compounds, their relative osmotic contribution can be estimated from data reported in the litera-ture (Tattini et al. 1993, Heimler et al. 1995, Tattini et al. 1995). Leaf Cl− concentration was close to that of Na+ (Bongi and Loreto 1989, Tattini et al. 1992, Heimler et al. 1995), with presumably comparable osmotic effects. Other anions (nitrate, sulfate, and phosphate) and amino compounds contribute little to ΨπFT, and their leaf concentrations are unaffected by salinity
(Tattini et al. 1993, Tattini et al. 1995).
The two cultivars did not differ in their potential to accumu-late soluble carbohydrates as an adaptive response to salinity. The maximum osmotic contribution of carbohydrates was ob-served at an external concentration of 100 mM NaCl, indicat-ing that the potential to accumulate sugars was fully reached in the 0--100 mM range (Table 3). Both mannitol and glucose concentrations increase in response to small increases in leaf Na+ content (Tattini et al. 1996), but glucose was more abun-dant than mannitol and consequently contributed more to ΨπFT.
The accumulation of mannitol is considered to be an important contributor to the maintenance of growth and metabolism in herbaceous species exposed to increased salinity (Tarczynski et al. 1993, Everard et al. 1994), and a similar role has been proposed in olive leaf tissue (Tattini et al. 1996). Transport from the vacuole and redistribution between cellular compart-ments must occur in order for compatible solutes and osmotic agents to counteract the accumulation of toxic ions during salt stress (Marcum and Murdoch 1994, Colmer et al. 1995). As-suming that 20% of total cell volume is occupied by the cytoplasm in mesophyll cells of olive, mannitol concentration appears to exceed the critical threshold (300--400 mOsmol kg−1) of basal cytoplasmic osmotic potential indicated for compatible solutes to be effective (Gorham et al. 1985). How-ever, it is not known what conditions are necessary or what form is needed for sugar-alcohols to exert their protective role in the cytoplasm.
In conclusion, there were no major differences in the leaf water relations or in the capacity of the olive cultivars Leccino and Frantoio to accumulate mannitol, soluble carbohydrates, or other osmolytes in response to salt stress. Changes in os-motic contribution reflected the different exclusion capacities of the cultivars for Na+ and Cl−. Like other glycophytic species with medium tolerance to salinity, osmotic adjustment in olive was mainly achieved by accumulation of inorganic ions with relatively little energy expenditure.
Acknowledgments
We thank Maria Assunta Coradeschi, Piero Puntoni, and Laura Tra-versi for skillful technical assistance. Research was supported by the National Research Council of Italy, Special Project RAISA, Subpro-ject No. 2, Paper No. 2814. R. Gucci was partially supported by a contribution Fondo di Ateneo of University of Pisa.
References
Alarcon, J.J., M.J. Sanchez-Blanco, M.C. Bolarin and A. Torrecillas. 1993. Water relations and osmotic adjustment in Lycopersicon esculentum and L. pennellii during short-term salt exposure and recovery. Physiol. Plant. 89:441--447.
Bañuls, J. and E. Primo-Millo. 1992. Effects of chloride and sodium ion on gas exchange properties and water relations of Citrus plants. Physiol. Plant. 86:115--123.
Bongi, G. and F. Loreto. 1989. Gas exchange properties of salt-stressed olive (Olea europaea L.) leaves. Plant Physiol. 90:1408--1416.
Colmer, T.D., E. Epstein and J. Dvorak. 1995. Differential solute regulation in leaf blades of various ages in salt-sensitive wheat and a salt-tolerant wheat ×Lophopyrum elongatum (Host) A. Löve amphiploid. Plant Physiol. 108:1715--1724.
Erdei, L. and E. Taleisnik. 1993. Changes in water relation parameters under osmotic and salt stresses in maize and sorghum. Physiol. Plant. 89:381--387.
Everard, J.D., R. Gucci, S.C. Kann, J.A. Flore and W.H. Loescher. 1994. Gas exchange and carbon partitioning in the leaves of celery (Apium graveolens L.) at various levels of root zone salinity. Plant Physiol. 106:281--292.
Flowers, T.J. and A.R. Yeo. 1986. Ion relations of plants under drought and salinity. Aust. J. Plant Physiol. 13:75--91.
Girma, F.S. and D.R. Krieg. 1992. Osmotic adjustment in sorghum. I. Mechanisms of diurnal osmotic potential changes. Plant Physiol. 99:577--582.
Gorham, J., R.G. Wyn Jones and G. McDonnell. 1985. Some mecha-nisms of salt tolerance in crop plants. Plant Soil 89:15--40. Greenway, H. and R. Munns. 1980. Mechanisms of salt tolerance in
nonhalophytes. Annu. Rev. Plant Physiol. 31:149--190.
Heimler, D., M. Tattini, S. Ticci, M.A. Coradeschi and M.L. Traversi. 1995. Growth, ion accumulation and lipid composition of two olive genotypes under salinity. J. Plant Nutr. 18:1723--1734.
Hinckley, T.M., F. Duhme, A.R. Hinckley and H. Richter. 1980. Water relations of drought hardy shrubs: osmotic potential and stomatal reactivity. Plant, Cell Environ. 3:131--140.
Larsen, F.E., S.S. Higgins and A. Al Wir. 1989. Diurnal water relations of apple, apricot, grape, olive and peach in an arid environment (Jordan). Sci. Hortic. 39:211--222.
Lo Gullo, M.A. and S. Salleo. 1990. Wood anatomy of some trees with diffuse- and ring-porous wood: some functional and ecological interpretations. Giorn. Bot. Ital. 124:601--613.
Longstreth, D.J. and P.S. Nobel. 1979. Salinity effects on leaf anat-omy. Consequences for photosynthesis. Plant Physiol. 63:700--703. Marcum, K.B. and C.L. Murdoch. 1994. Salinity tolerance mecha-nisms of six C4 turfgrasses. J. Am. Soc. Hortic. Sci. 119:779--784.
Neumann, P.M., E. Van Volkenburgh and R.E. Cleland. 1988. Salinity stress inhibits bean leaf expansion by reducing turgor, not cell wall extensibility. Plant Physiol. 88:233--237.
Richardson, S.G. and K.J. McCree. 1985. Carbon balance and water relations of sorghum exposed to salt and water stress. Plant Physiol. 79:1015--1020.
Ritchie, G.A. and T.M. Hinckley. 1975. The pressure chamber as an instrument for ecological research. Adv. Ecol. Res. 9:165--254. Schulte, P.J. and T.M. Hinckley. 1985. A comparison of
pressure-vol-ume curve data analysis techniques. J. Exp. Bot. 36:1590--1602. Tarczynski, M.C., R.G. Jensen and H.J. Bohnert. 1993. Stress
protec-tion of transgenic tobacco plants by producprotec-tion of the osmolyte mannitol. Science 259:508--510.
Tattini, M. 1994. Ionic relations of aeroponically-grown olive geno-types during salt stress. Plant Soil 161:251--256.
Tattini, M., P. Bertoni and S. Caselli. 1992. Genotypic responses of olive plants to sodium chloride. J. Plant Nutr. 15:1467--1485.
Tattini, M., D. Heimler, M.L. Traversi and A. Pieroni. 1993. Polyamine analysis in salt stressed plants of olive (Olea europaea L.). J. Hortic. Sci. 68:613-617.
Tattini, M., R. Gucci, M.A. Coradeschi, C. Ponzio and J.D. Everard. 1995. Growth, gas exchange and ion content in Olea europaea
plants during salinity stress and subsequent relief. Physiol. Plant. 95:203--210.
Tattini, M., R. Gucci, A. Romani, A. Baldi and J.D. Everard. 1996. Changes in non-structural carbohydrates in olive (Olea europaea) leaves during root zone salinity stress. Physiol. Plant. 98:117--124. Tyree, M.T. and H. Richter. 1982. Alternate methods of analysing water potential isotherms: some cautions and clarifications. II. Curvilinearity in water potential isotherms. Can. J. Bot. 60:911--916.
Walker, R.R., D.H. Blackmore and Sun Qing. 1993. Carbon dioxide accumulation and foliar ion concentrations in leaves of lemon (Citrus limon L.) trees irrigated with NaCl or Na2SO4. Aust. J. Plant
Physiol. 20:173--185.