Usability Improvement based on Hierarchical Task
Analysis (Case Study on i-Caring)
Muhammad Zafif Muttaqy#1, Angelina Prima Kurniati∗2, Yanuar Firdaus A.W#3
#School of Computing, School of Computing
Bandung, Indonesia
i-Caring (IT Telkom i-Gracias Collaboration and e-learning) is an LMS (Learning Management System)-based e-learning integrated in i-Gracias own by IT Telkom Bandung. This application is being used to facilitate the implementation of learning activities supporting the face-to-face discussion in class. I-Caring supports some functionalities, such as instructional material storage, assignment, quizzes, and communication through chats and forum. But the great functionalities are not supported by an interactive interface, which is not comply to QUIM (Quality in Use Integrated Measurement) standard. This paper explains our research results of evaluation and recommendation process. This research is using Hierarchical Task Analysis (HTA) which has some indicators to analyze the behavior of a sample lecturers and students which are randomly selected. Based on the questionnaires answers, we analyze the relations of each points on HTA principles using SPSS Statistics 20 tools. The recommendations are then formulated to improve i-Gracias user interface quality.
I. INTRODUCTION
IT Telkom Collaboration I-Gracias and E-learning (i-Caring) are LMS (Learning Management Sistem)-based E-Learning applications integrated in i-Gracias IT Telkom Bandung. I-Caring provides learning modules to support teaching and exercise materials, assignment, communication through chats and forums, and various types of quiz facility. However, these functions lack support of interactive user interface because it does not comply to QUIM (Quality in Use Integrated Measurement) Standard [13]. QUIM is the latest requirement standard and comprises 10 factors which consist of 26 sub-factors. As a result, better recommendation is generated. Nowadays, several researches to evaluate the usability have been conducted through various methods, such as Hierarchical Task Analysis (HTA) and Focus Group Discussion (FGD) (Kumar, 1987). HTA is a systematic method to describe how well-organized some work is to achieve the goal of the work [5]. HTA is selected because this method is developed to collaborate task analyst with people involved in operations. HTA is used to examine potential mistakes and their consequences, interface design verfication, exercise procedure identification, operational precedure development and verification, workload assessment, and communication analysis [15]. HTA is very useful for interface designers because it provides task implementation model, enabling the designers to visualize the goals, task, sub-task, operation, and important plans for users. HTA helps to elaborate complex tasks to increase effectiveness in analyzing assignment yet has specific point of view on the task, and also functions as analysis framework which serves as a practical tool for the designers [4]. In accordance with the mentioned characteristics of QUIM and HTA, this method is suitable to evaluate usability of IT Telkom i-Caring. The authors selected QUIM as approach (model) tool to test the correlation of respondents answer score to identify equivalence coefficient between answer score and the method used. HTA is preferred due to its compliance with i-Caring condition in which there are structured steps to evaluate. The result will be used to upgrade website in the future.
II. LITERATUREREVIEW
A. Usability
Although ISO 9241-11 recommendation has been a standard for community specializing in usability, the most frequently adopted definition of usability is the one introduced by Nielsen. According to Nielsen [10], usability refers to: learnability, efficiency, memorability, errors, and satisfaction
B. Hierarchical Task Analysis (HTA)
Hierarchical Task Analysis (HTA) was introduced by Annett and Duncan to evaluate organizations training needs, in which the underlying technique, i.e. hierarchical decomposition, analyzes and represents the behavioral aspects of complex task such as planning, diagnosis, and decision making. HTA breaks task into sub-task and operations or actions. These tasks of components are then graphically represented using a structure chart. HTA requires tasks identification, categorization, subtask identification, and checking of the overall accuracy of the model [4].
Fig. 1. HTA Steps [6]
C. Quality in Use Integrated Measurement (QUIM)
QUIM (Quality in Use Integrated Measurement) Standard is a consolidated model for usability. QUIM is hierarchical, consisting of, from the higher to lower level, usability factors, criteria, and metrics. In regard to this, QUIM conforms to IEEE 1061 (1998) which elaborates method to determine quality requirements as well as identify, conduct, analyze, and validate the process and the metrics of product quality [13]. The relationship between factors and criteria in QUIM is shown in Figure 2.
D. Likert Scale
Fig. 2. Relationship between Factors dan Criteria in QUIM [13]
1932 to measure social attitude [3]. The scale rate of each statement is not determined by the degree of favorability but by the response distribution of agreement and disagreement from a group of respondents serving as pilot group. Scaling procedure using summed rating method is based on 2 assumptions [1]:
1) Each written attitudinal statement can be approved as favorable or unfavorable statement. 2) Response which reflects positive attitude must be rated higher than that of negative one Figure 3 shows an example of Likert Scale.
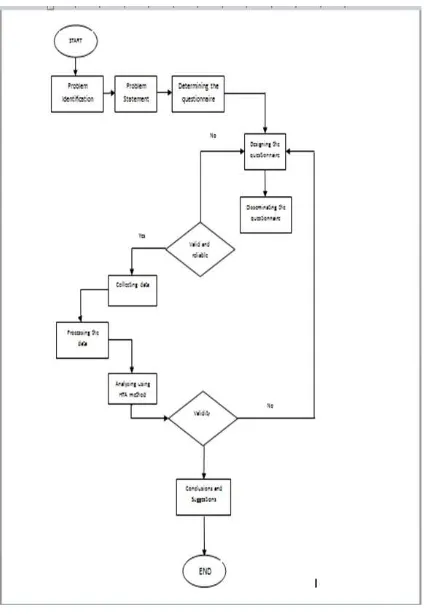
Fig. 4. Research Flow
Remarks: Process 1 is the first step to find out the problems in i-Caring. Process 2 is done by stating the problems in i-Caring. In regard to this, the research focuses on success level of i-Caring usability. Process 3 is conducted according to the desired or needed responses. This research requires responses in the form of precise value, in which the questions are correlated. Therefore, Likert Scale is preferred. Process 4 consists of designing and determining the content of questionnaire which must meet the following principles:
1) The questions of the questionnaire must be relevant to the respondents, i.e. familiar to them.
2) The clarity of the questions must conforms the respondents capacity. This is important considering the inteletuality level of the respondents might not be equal to that of the question author
Process 5 determines the distribution method of the questionnaire. The distribution type is selected personally considering the geographical distance is not that great. The language used is simple Indonesian language easier to understand by the respondents. Process 6 tests the validity and reliability of the questions. Invalid and unreliable questionnaire must be redesigned. Process 7 collects data of valid and reliable questionnaire. Then the data of the questionnaire is processed using SPSS. Process 8 analyzes data using Hierarchical Task Analysis (HTA) method. Process 9 re-tests the validity to obtain accurate result which concludes this paper.
B. Questionnaire Design
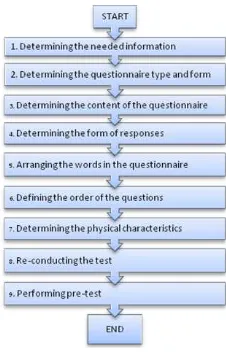
The questionnaire design is done in nine steps. The steps are shown in Figure 5.
Fig. 5. Questionnaire Design Steps
and the result is more valid. Process 5 and process 6 must be done to ensure that the word choice in the questions and its sequence are ease to understand by the respondents. Process 8 and process 9 are conducted to ensure that the questionnaire is appropriate and in accordance with the needed information. In this research, 30 sheets of questionnaire are distributed to ensure its validity and reliability [1].
C. Questionnaire Dissemination
The questionnaire dissemination is done using interview and personally administered questionnaire method. The researchers read the content of the questionnaire for the respondents and record the responses. The strength of this method is the researches can encourage the respondents to give honest responses suitable with the information needed. The population of this research is the lecturers and students of IT Telkom Bandung registered in 2009 up to 2013. The sample is selected using non-probability judgement sampling method with which the dissemination is more accurate than that of probability sampling method. The number of sample is defined based on the population size, reliability level, and the variant/heterogenity of the population.
D. Reliability and Validity Testing
Reliability test is performed using Cronbach Alpha [11] method, and the formula is shown in Formula 1
IV. TESTING AND ANALYSIS
Testing is done by defining the population located in an area where the questionnaire is easy to disseminate. The population covers several types of potential respondents background. Thus, the selected population consists of IT Telkom Students registered in 2009, 2010, 2011, 2012, and 2013, as well as IT Telkom lecturers. Based on Charles Gervitz method, population ¿ 5.000 can be represented by 100-500 samples. The selected samples are 100 students and 11 lecturers of IT Telkom
A. Pre-test Result
Pre-test is performed to find the validity and reliability value of each question and dimension distributed to the respondents. The number of respondents in pre-test is 30. The result of validity and reliability calculation of pre-test data is presented in Table 1.
All validity values meet the standard ¿0.3 and reliability values meet the standard ¿0.6. Therefore, all questions are considered valid and reliable.
B. analysis Result using HTA
Evaluation of i-Caring Usability by students can collect 127 respondents consisting of students from various faculties at IT Telkom. The results of the evaluation are:
1) I-Caring application is difficult to use at first. It is recommended to provide user guide menu to help beginners to learn i-Caring application.
users in reading numbers.
4) Simple and frequently-performed tasks cannot be accomplished in 2 seconds. It is due to insufficient support of network system and server. It is recommended to improve network system and server.
5) When delay (¿15 seconds) occurs in the system, users are not notified that the system is working. It is recommended to display feedback/warning that the program is processing ¿15 seconds.
6) The displayed system and menu organization are not well-arranged, clear, and easy to understand. For example, in calendar and my courses menu. It is recommended to rearrange both menus to make it easier for i-Caring users. 7) Instruction, notification, icon, and help information is not helpful enough to the users. It is recommended to upgrade
notification and help menu to allow users to know incoming reports and to help users who find difficulties in using the system.
8) I-Caring protects users files and data. Users files and data protection in i-Caring application is not understandable by most users. Thus, it is necessary to provide information about the limitation of users files and data protection.
9) Users interest to access i-Caring application is low. I-Caring web UI is considered not attractive. As a result, students access this application only when they have assignments and online quizzes. It is recommended to enhance the system and web UI to increase users satisfaction level.
10) I-Caring web application is difficult to access. Respondents complain that i-Caring application can only be accessed thourgh PC. It is recommended to provide mobile/Android version to make it easier to access.
11) Users find it difficult to resume their work after opening other web pages. Delay occuring when opening web pages hinders users performance. It is recommended to fix web design to quicken the loading process of web pages.
12) Icons are not familiar to the users. It is recommended to use standard icons and provide additional explanation on the icons.
13) The color is not attractive. Color combination used in the page is considered not interesting. It is recommended to harmonize the color combination of the web.
14) Text is difficult to read. It is recommended to adjust the size and type of the fonts.
15) Academic information is incomplete and inaccurate. Academic information displayed in the web is considered incomplete and inaccurate.
16) Academic information is out-of-date. It is recommended to update academic information regularly.
Furthermore, most of the evaluation results from lecturers as respondents are the same as the ones from the students, with the following additional evaluation:
1) Menus are not in a logical order and not suitable with the real work steps. This makes it difficult for users to comprehend and use the web. It is recommended to re-organize the work steps in my course menu.
2) The names of commands are not clear. The names of commands for several necessary actions are not clear and confusing. It is recommended to provide explanation appearing when cursor is directed to that action menu, to help users comprehend the functions.
3) Syllabus and materials to support the lecturing are difficult to upload. It is recommended to improve server and network connection to support the process of uploading syllabus and materials.
C. Mapping of usability problems
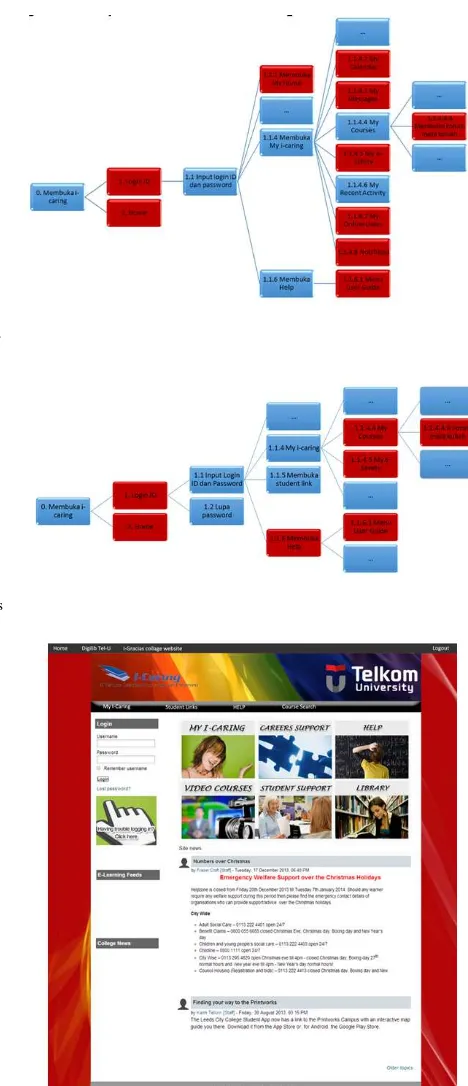
The mentioned evaluation results are then mapped into the menu in i-Caring web. The mapping of usability problems by students is shown in Figure 6, and the mapping of usability problems by lecturers is shown in Figure 7.
Fig. 6. Usability problems by students
Fig. 7. Usability problems by lecturers
Fig. 8. Home menu improvement
V. CONCLUSION AND SUGGESTION
From this research, it can be concluded that:
1) I-Caring web application usability can be evaluated using QUIM (Quality in Use Integrated Measurement) and HTA (Hierarchical Task Analysis) evaluation method.
2) The result of double regression test using QUIM shows that:
[9] Mantei, Mylopoulos. 2001. Information Sistems Analysis and Design. [10] Matera, et all. Web Usability: Principles and Evaluation Methods. Milan. Italy. [11] Nugroho, Yohanes Anton. 2011. Olah Data dengan SPSS. Skripta: Yogyakarta.
[12] Santoso, Singgih. 2010. Statistik Multivariat Konsep dan Aplikasi dengan SPSS. Elex Media Komputindo: Jakarta.
[13] Seffah, Ahmed, et all. 2006. Usability measurement and metrics: A consolidated model. Springer Science + Business Media, Inc. [14] The Human Machine Interfaces. The International engineering consortium. www.iec.org.
![Fig. 1. HTA Steps [6]](https://thumb-ap.123doks.com/thumbv2/123dok/1111072.948442/2.595.95.490.264.592/fig-hta-steps.webp)
![Fig. 2. Relationship between Factors dan Criteria in QUIM [13]](https://thumb-ap.123doks.com/thumbv2/123dok/1111072.948442/3.595.97.496.93.489/fig-relationship-factors-dan-criteria-quim.webp)