Is Earnings Management Informational or Opportunistic?
Evidence from ASEAN Countries
Dewi Kusuma Wardani
Universitas Sarjanawiyata Tamansiswa, Indonesia
Indra Wijaya Kusuma
Faculty of Economics and Business, Universitas Gadjah Mada, Indonesia
Gadjah Mada International Journal of Business
Vol. 14, No. 1 (January - April 2012): 61 - 75
Corresponding authors. E-mail: [email protected]; [email protected]
Abstract: This study explores the informational and opportunistic characteristics of earnings
manage-ment in ASEAN countries. Earnings managemanage-ment has an impact on the profitability of the companies. A positive relation between earnings management and future profitability reveals that earnings management is informational. However, negative a relation between earnings management and future profitability indicates that earnings management is opportunistic.
This study uses data from the OSIRIS database. Four hundred and eighty five (485) companies from the Philippines, Indonesia, Malaysia, Singapore, and Thailand are used as a sample. This study focuses on 2 types of earnings management: (1) accrual earnings management and (2) real earning management. Modi-fied Jones model is used for the accrual earnings management. Real earnings management follows Roychowdury (2006).
The results show that the characteristics of earnings management are not consistent. Real earnings man-agement is informational in Thailand, but opportunistic in Indonesia. Accruals earnings manman-agement is informational in the Philippines, but opportunistic in Malaysia. Country factors such as culture may ex-plain the inconsistency of the results in ASEAN.
Abstrak: Penelitian ini mengeksplorasi karakteristik informasional dan oportunistik dari manajemen laba
di negara-negara ASEAN. Manajemen laba akan berdampak pada kemampulabaan perusahaan. Hubungan positif antara manajemen laba dan kemampulabaan di masa depan mengungkapkan bahwa manajemen laba bersifat informasional. Sebaliknya, hubungan negatif antara manajemen laba dan kemampulabaan perusahaan di masa depan mengindikasikan bahwa manajemen laba bersifat oportunistik.
Keywords: accruals earnings management; ASEAN countries; future profitability; informa-tional; opportunistic; real earnings management
Introduction
Earnings management is widely prac-ticed by public companies. In general, the management’s objectives in managing earn-ings are to avoid scrutiny by investors and creditors and seek their own benefit, to get performance-based incentives, to increase stock prices, and to get benefits from gov-ernment (Cohen et al. 2008).
Therefore, the users of financial state-ments must be aware of opportunistic earn-ings management before they make a deci-sion. Opportunistic earnings management makes the current income rise but ignores future profitability. High opportunistic earn-ings management indicates low quality of earnings (Lo 2008). This low quality of earn-ings is used by the users to make decisions (Ball and Brown 1968; and Lo 2008).
Earnings management is like a coin with two sides. Besides using earnings management for opportunistic behavior, earnings manage-ment is also used for informational purposes. Subramanyam (1996), Siregar and Utama (2008), and Gunny (2009) proved that earn-ings management has informational purposes. Earnings management with informational purposes carried out by managers to assist financial statement users for better predic-tions of a company’s future performance (Subramanyam 1996; Siregar and Utama 2008; Gunny 2009).
There are two ways to manage earnings.
First, earnings are managed through the ac-crual manipulation without affecting cash flows (accrual earnings management). Secondly, earnings are managed using real activities that affect a company’s cash flows (real earnings management). Zang (2007) proved that there are trade offs between accrual earnings man-agement and real earnings manman-agement. Man-agement will shift to real earnings
manage-ment if accrual earnings managemanage-ment is eas-ily detected.
The remainder of the paper proceeds as follows. Section II provides a literature re-view and hypotheses development. Section III discuses the empirical methodology, in-cluding the data and sample selection and the variable measurement. The test and result are discussed in Section IV and Section V will conclude.
Literature Review and
Hyphoteses Development
Empirical evidence shows that manage-ment manage earnings to avoid reporting earn-ings below the target (Roychowdury 2006). Management can manage earnings for op-portunistic or informational purposes (Subramanyam 1996; Siregar and Utama 2008; and Gunny 2009). Management that manages earnings opportunisticly tends to maximize their bonuses (Scott 2009; Watts and Zimmerman 1986; and Healy 1985).
On the contrary, Demski and Sappington (1978) suggested that manage-ment obtain specialized information about future performance, such as new firm strate-gies, change in firm characteristics, or mar-ket conditions, based on their expertise. This information is not communicated directly to the investor because of its cost, so the com-munication is blocked. The blocked commu-nication can reduce the efficiency of agency contracts (Scott 2009).
One of the solutions to reduce the blockage is earnings management. If a mager announces it in the simple way, the an-nouncement would not be reacted to because of its cost to verify. To solve this problem, a manager will manage earnings to show their inside information with discretionary accru-als (Scott 2009). Stocken and Verrecchia
(2004) found that when a manager has some private information which are not captured by a firm’s financial reporting system and may manipulate the financial report, at some cost, the manager might not choose the most pre-cise financial system. This earnings manage-ment is informational.
A manager will not be so foolish as to report higher earnings than can be reached because the reduction in the future earnings would disappoint the investors who would then punish them through capital and labor market reactions (Barth et al. 1999; and Fee and Hadlock 2003).
Both earnings management purposes have economic consequences for the com-pany. Opportunistic earnings management will cause a negative relationship between earnings management and future profitabil-ity. Informational earnings management pro-vides more accurate earnings information and causes a positive relationship between earn-ings management and future positive profit-ability (Subramanyam 1996; Siregar and Utama 2008; and Gunny 2009).
Real earnings management is conducted for the opportunistic purpose that real earn-ings management will improve earnearn-ings to-day but will destroy the company in the long term (Roychowdury 2006; and Cohen et al. 2008) for these reasons:
1. Sales manipulation through increased price discount will make the future cash flow lower because consumers expect discount prices.
2. Sales manipulation through more lenient credit terms make the future cash flow lower because of the difficult the company will have collecting receivables.
4. Decreases in discretionary expenses will lead to lower future cash flow and income because of the company’s lack of com-petitiveness.
The proponents of the informational arguments stated that management manages earnings to reduce information blocked (Demski and Sappington 1987). When man-agement has additional information about future performance, he/she cannot give in-formation in the direct statement on finan-cial reporting or firm announcement to pre-vent the competitor from obtaining their se-cret information (Demski and Sappington 1990). On other hand, if management does not communicate that information, the abil-ity of investors to make good decisions is reduced. Current net income ability to pre-dict future performance is jammed (Stocken and Verrecchia 2004). Management uses earnings management to give information to reduce asymmetric information between management and investor and increasing the decision-making accuracy (Subramanyam 1996).
Tucker and Zarrowin (2006) found that manager’s use of financial reporting discre-tion is to reveal more informadiscre-tion about fu-ture earnings and cash flow. Gunny’s study (2009) uses U.S. firms as its sample, and
proves that real earnings management has a positive relationship with future profitability. Subramanyam (1996) and Siregar and Utama (2008) show that accrual earnings manage-ment is positively associate with future prof-itability.
A positive relationship between earn-ings management and future profitability is consistent with signaling theory, in which management attempts to give a signal about management’s ability to generate better fu-ture profit through a joint signal (Graham 2005). Only management that is confident about its future profitability manages earn-ings. Companies with poor future perfor-mance prospects will not use a joint signal, using earnings management, because inves-tors will be disappointed when future profit-ability is not in accordance with the signals provided by management (Graham 2005).
Based on that, the hypotheses tested in this study are:
H1: Real earnings management is positively associ-ated with future profitability
H2: Accrual earnings management is positively as-sociated with future profitability
From the hypotheses, the framework of this study is described as the Figure 1.
Real Earnings Management
Accrual Earnings Management
Future Profitability
To determine whether the purpose of earnings management is opportunistic or in-formational, this study investigates the rela-tionship between earnings management, both accrual earnings management and real earn-ings management, with future profitability. A positive relation between earnings manage-ment and future profitability reveals that earn-ings management is informational. On the other hand, a negative relation between earn-ings management and future profitability in-dicates that earnings management is oppor-tunistic. No relationship between earnings management and future profitability reveals neither opportunistic nor informational. It is just a random process.
Research Methods
Population and Sample
The population of this study is compa-nies listed on stock exchanges in the ASEAN group of countries. We select ASEAN be-cause these countries have some diversity in terms of investor protection, legal systems,
accounting standards, and history. The ob-servation period is 2008. The data used is the financial data from 2004 to 2009 because the formula requires long-range observations. The sampling method is purposive sampling, which is in the selection of samples based on the following criteria:
1. Listed in stock exchange in five original ASEAN countries (Indonesia, Singapore, Malaysia, Thailand, and the Philippines) 2. Data are available in the OSIRIS database 3. Categorized as a manufacturing company
in NAICS 2007 (Primary Code: 31-33) 4. Data from 2004 to 2009 are complete
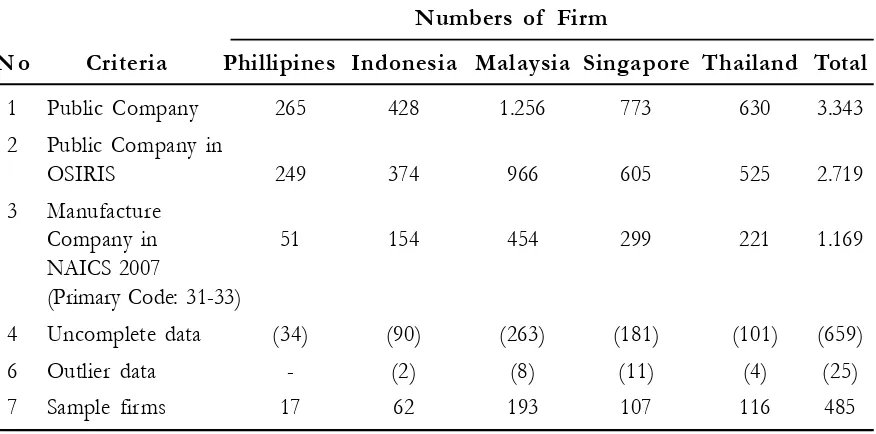
The public companies in the five ASEAN countries number 3,343 with the distribution as follows: 265 firms in the Phil-ippines, 428 firms in Indonesia, 1,256 firms in Malaysia, 773 firms in Singapore, and 630 firms in Thailand. Only 2,719 firms are avail-able in the OSIRIS database (access date 17/ 9/2010). There are 1,169 manufacturing firms that include in NAICS categorization ( Two-Digit Primary Code: 31-33). Uncompleted data
Table 1. Sampling Selection Process
Numbers of Firm
N o Criteria Phillipines Indonesia Malaysia Singapore Thailand Total
1 Public Company 265 428 1.256 773 630 3.343
2 Public Company in
OSIRIS 249 374 966 605 525 2.719
3 Manufacture
Company in 51 154 454 299 221 1.169
NAICS 2007
(Primary Code: 31-33)
4 Uncomplete data (34) (90) (263) (181) (101) (659)
6 Outlier data - (2) (8) (11) (4) (25)
are 659. From 510 complete firms, there are 485 sample firms because 25 outlier firms are excluded.
Data Collection
The study used secondary data obtained from the OSIRIS database. This database is a public company database which is produced by Bureau van Dijk Electronic Publishing, SA (Bureau van Dijk Electronic Publishing 2007).1
The OSIRIS database provides finan-cial data, ownership data, news, rankings, earnings data, and stock data of public panies, including banks and insurance com-panies. The database has more than 45,000 companies from 140 countries comprising over 34,000 companies listed on the Stock Exchange and 11,000 companies that are not listed or are no longer listed on the Stock Exchange.
Data retrieved from the database can be trusted because OSIRIS only maintains the highest level quality data of each provider and applies a combination of strict quality control systems. Before the OSIRIS data is delivered to customers, Bureau van Dijk Electronic Publishing also implements a se-ries of quality control measures to check the software and data. The OSIRIS database is updated 12 times per year in the DVD form and 52 times per year in the Internet form. (Bureau van Dijk Electronic Publishing 2007).
Measurement of Variables
Measurement of real earnings management
This study used Roychowdhury’s earn-ings management model (Roychowdhury 2006). Proxy for real earnings management is abnormal cash flows from operations (Abn CFO), abnormal production cost (Abn prod), and abnormal discretionary expense (Abn Disc Exp). The procedures to calculate the real earnings management are as follows: 1. Calculate abnormal cash flows from
opera-tions (CFO)
a. Calculate normal operating cash flow from operations as linier function from sales and the change of sales:
b. Calculate abnormal CFO
Abnormal CFO is the difference between actual cash flow and normal cash flow.
2. Calculate abnormal production cost a.Calculate normal production cost that is
defined as the sum of cost of good sold (COGS) and the change of inventory.
1 Bureau van Dijk Electronic Publishing, SA (BvDEP) is a privately owned company and business information
provider based in Brussels. BvDEP marketing center located in London and has offices around the world, like Amsterdam, Bahrain, Beijing, Bratislava, Brussels, Chicago, Copenhagen, Edinburgh, Frankfurt, Geneva, Lisbon, London, Madrid, Manchester, Mexico City, Milan, Moscow, New York, Paris, Rome, San Francisco, Seoul, Shanghai, Singapore, Stockholm, Sydney, Tokyo, Vienna and Zurich (http://www.bvdinfo.com/About-BvD, accessed 15/12/2010).
CFOit
b. Calculate abnormal production cost Abnormal production cost is difference between actual production cost and nor-mal production cost.
3. Calculate abnormal discretionary expense a.Calculate normal discretionary expense
b.Calculate abnormal discretionary expense Abnormal discretionary expense is dif-ference between discretionary expense and normal discretionary expense
4. Measurement of Real Earnings Manage-ment (REM)
Real earnings management is calculated by adding the standardized abnormal cash flows from operations (CFO Abn), abnormal pro-duction cost (Abn Prod Cost), and abnormal discretionary expenses (Abn Disc Exp.). Be-fore added, abnormal CFO and Abn Exp Disc is multiplied by -1. This is done because the three real earnings management proxies have different directions. Abn Disc Exp and Abn
CFO have negative directions, while Abn Prod Cost has a positive direction (Cohen and Zarowin 2008)
Explanation
CFOt/Assetst-1 = operational cash
flow divided by to-tal assets
1/Assetst-1 = intercept divided by
total assets
Salest-1/Assetst-1 = net sales divided by total assets
Salest-1/Assetst-1 = change of net sales divided by total as-sets
COGSit/Assetst-1 = cost of good sold divided by total as-sets
INVit1/Assetst-1 = change of inventory divided by total as-sets
Prodt = production cost
DiscExpt = discretionary
ex-pense
e = error
Measurement of accrual earnings management
This study used discretionary accruals for the accrual earnings management proxy. Discretionary accrual is measured with Modi-fied Jones Model (Dechow et al. 1995). 1. Calculate Total Accrual
TACCit= EBXTit - CFOit ...(1)
2. Estimate total accrual
Total accrual (TACC) is estimated by fol-lowing regression equation:
3. Calculate non discretionary accrual Using regression coefficient, non discre-tionary accruals (NDACC) is
4. Discretionary accrual
Discretionary accrual (DA) can be calcu-lated with formula:
Explanation
DACCit = discretionary accruals
NDACCit = non discretionary accruals
TACCit = total accruals
TAit-1 = total asset
EBXTit = earnings before extraordinary
item and tax
CFOit = operational cash flow
Revt = change of revenue
PPEt = property, plant, and equipment
Rect = change of receivable
e = error
Measurement of future profitability According to Subramanyam (1996) and Siregar and Utama (2008), future profitabil-ity can be measured by calculating the change in earnings one year ahead divided by total assets at beginning of year (NIt +1/TAt)
NIt +1 = NIt +1 – NIt
This study used NIt +1 because Subramanyam (1996) argued that NIt +1 is the most appropriate future profitability mea-surement.
Explanation
NIt+1 = one-year-ahead net income
NIt+1 = one-year-ahead change in net in-come
NIt = net income
TAt = total asset
Control variables
This study uses two control variables, firm size and growth opportunity. The proxy of firm size is the natural logarithm of assets (Ln Asset). Price earnings ratio is the proxy for growth opportunity.
Results
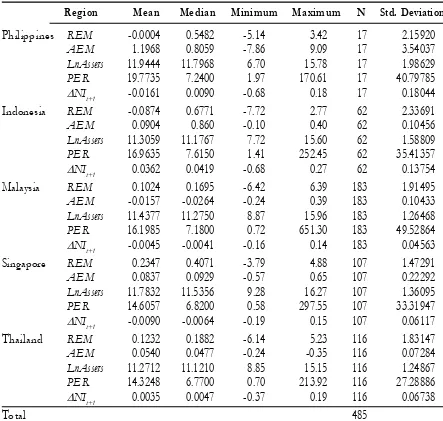
management is aggressive in Singapore, Thai-land, and Malaysia compared to the Philip-pines and Indonesia. The mean of accrual earnings management is high in the Philip-pines and Indonesia compared to Malaysia, Singapore, and Thailand. This evidence proves that real earnings management and accrual earnings management have a substi-tutive relationship. This finding corroborates Zang (2007), Cohen et.al’s study (2008) and Gunny’s study (2009). The incidence of
ac-crual earnings management is higher in coun-tries that have weak investor protection than in the countries that have strong investor pro-tection. On the other hand, the incidence of real earnings management is higher in coun-tries that have strong investor protection than in the countries that have weak investor pro-tection. Because of the substitutive relation-ship between accrual earnings management and real earnings management, we must ob-serve both of them. Focusing on one type of
Table 2. Descriptive Statistic
Region Mean Median Minimum Maximum N Std. Deviation
Philippines REM -0.0004 0.5482 -5.14 3.42 17 2.15920
AEM 1.1968 0.8059 -7.86 9.09 17 3.54037
LnAssets 11.9444 11.7968 6.70 15.78 17 1.98629
PER 19.7735 7.2400 1.97 170.61 17 40.79785
NIt+1 -0.0161 0.0090 -0.68 0.18 17 0.18044
Indonesia REM -0.0874 0.6771 -7.72 2.77 62 2.33691
AEM 0.0904 0.860 -0.10 0.40 62 0.10456
LnAssets 11.3059 11.1767 7.72 15.60 62 1.58809
PER 16.9635 7.6150 1.41 252.45 62 35.41357
NIt+1 0.0362 0.0419 -0.68 0.27 62 0.13754
Malaysia REM 0.1024 0.1695 -6.42 6.39 183 1.91495
AEM -0.0157 -0.0264 -0.24 0.39 183 0.10433
LnAssets 11.4377 11.2750 8.87 15.96 183 1.26468
PER 16.1985 7.1800 0.72 651.30 183 49.52864
NIt+1 -0.0045 -0.0041 -0.16 0.14 183 0.04563
Singapore REM 0.2347 0.4071 -3.79 4.88 107 1.47291
AEM 0.0837 0.0929 -0.57 0.65 107 0.22292
LnAssets 11.7832 11.5356 9.28 16.27 107 1.36095
PER 14.6057 6.8200 0.58 297.55 107 33.31947
NIt+1 -0.0090 -0.0064 -0.19 0.15 107 0.06117
Thailand REM 0.1232 0.1882 -6.14 5.23 116 1.83147
AEM 0.0540 0.0477 -0.24 -0.35 116 0.07284
LnAssets 11.2712 11.1210 8.85 15.15 116 1.24867
PER 14.3248 6.7700 0.70 213.92 116 27.28886
NIt+1 0.0035 0.0047 -0.37 0.19 116 0.06738
earnings management exclusively may not fully explain earnings management activities (Zang 2007).
The mean of future profitability (NIt+1) is higher in Indonesia and Thailand compared to Malaysia, the Philippines, and Singapore. The economic crisis in the U.S. influenced Indonesia and Thailand, so profitability in 2008 was worse. By 2009, the profitability was getting better. Indonesia and Thailand have positive prospects for future profitabil-ity. On the other hand, the U.S. economic cri-sis did not influence Malaysia, the Philippines, and Singapore. They have negative prospects for future profitability because, on the aver-age, the companies’ profitability in 2009 was worse than in 2008.
Firms in five ASEAN countries are of the same size. The Philippine has higher growth opportunities compared to other countries that showed by the highest PER.
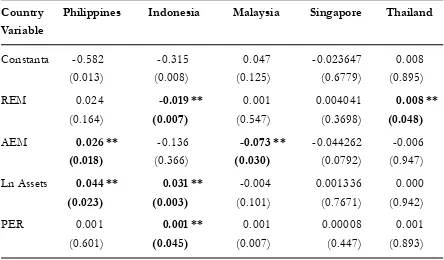
From Table 3 we can conclude that ac-crual earnings management in the Philippines is informational, but real earnings manage-ment does not have a relationship with fu-ture profitability. Firms in the Philippines manage earnings to give adequate informa-tion to the shareholder. Firms’ managed earn-ings indicate a firm has made a profit and they still have a good future profitability. The real earnings management that does not have any relation with future profitability indicates that the real earnings management in the Philip-pines is not strategically planned by manag-ers to create better future profitability. In ad-dition, in the Philippines, a firm’s future prof-itability is influenced by firm size. Bigger firms have prospects of higher future profit-ability.
By contrast, real earnings management in Thailand is informational, but future prof-itability is not influenced by accrual earnings management. Thailand’s firms manage real
Table 3. Regression Result of Hipotheses 1 and 2
Country Philippines Indonesia Malaysia Singapore Thailand
Variable
Constanta -0.582 -0.315 0.047 -0.023647 0.008
(0.013) (0.008) (0.125) (0.6779) (0.895)
REM 0.024 -0.019 ** 0.001 0.004041 0.008 **
(0.164) (0.007) (0.547) (0.3698) (0.048)
AEM 0.026 ** -0.136 -0.073 ** -0.044262 -0.006
(0.018) (0.366) (0.030) (0.0792) (0.947)
Ln Assets 0.044 ** 0.031 ** -0.004 0.001336 0.000
(0.023) (0.003) (0.101) (0.7671) (0.942)
PER 0.001 0.001 ** 0.001 0.00008 0.001
activities to show that the firm’s future profit-ability will be better and the investor can trust the firm’s performance. The real earnings management in Thailand is a firm’s strategic planning to get better profit and for investor wealth. In Thailand, future profitability is not influenced by firm size. The pro-fitability of big firms is not always better than that of small firms. Investors can be confident about investing in both of them. Further, the fu-ture profitability is not influenced by growth opportunity. The better future profitability is not because of the better growth opportu-nity, but because of the manager’s strategic planning.
In Thailand, investors can trust that the price discount and more lenient credit terms are not to accelerate the timing of sales, that increasing of production is not to report the lower cost of goods sold, and that reducing discretionary expenses, such as advertising, research and development, and SG&A ex-penses, are not to reduce the expense to boost current period earnings. All of the manager’s action are a part of strategic planning and the firm will not get worse in future. This finding conradicts Roychowdury’s argument (Roychowdury 2006). He argues that ma-nagers will manage earnings through real ac-tivity, like accelerating the timing of sales through increased price discount and more lenient credit terms, reporting lower cost of goods sold through increased production, and decreasing discretionary expenses to boost current period earnings. All of that real ac-tivity will worsen the firm’s future profit-ability (Roychowdury 2006).
In Indonesia, real earnings management is opportunistic, but accrual earnings man-agement does not have a relationship with future profitability. These findings do not support Siregar and Utama’s findings (Siregar and Utama 2008). They found that accrual
earnings management in Indonesia is infor-mational. Managers give information about insights to investors so that the asymmetricity of information is reduced and the investor can make good decisions (Siregar and Utama 2008). But in this study, accrual earnings management does not have a relationship with future profitability, so the managers’ actions do not give better information but are for their own benefit. Specificially, real earn-ings management in Indonesia is opportunis-tic. Managers will manage earnings through real activity, such as acceleration of timing of sales through increased price discount and more lenient credit terms, reporting lower cost of goods sold through increased production, and decreasing discretionary expense to boost current period earnings. In the current year, the firms has good profits but all of that real activity will worsen the firm’s future profit-ability. Investors must be careful with man-agers’ actions. This finding supports Roychowdury’s argument (Roychowdury 2006). Furthermore, future profitability in Indonesia is influenced by firm size and growth opportunity.
Future profitability in Singapore is not influenced by real earnings management, ac-crual earnings management, firm size, and growth opportunity. Singapore’s firms man-age earnings not to give more information to investor. This finding is not consistent with the previous studies (Subramanyam 2006 and Gunny 2009). The economic crisis that struck the U.S. and some other countries may have had a role to this phenomena.
Country factors such as culture may explain the inconsistencies of the result across the ASEAN countries. Some diversity in terms of investor protection, legal systems, accounting standards, and history among ASEAN countries will create variations in accounting practices, including earnings man-agement. Investors must be careful when they choose the country where they will invest money because every country has different characteristics. They must scrutinize manag-ers’ actions because sometimes managers manage earnings to benefit themselves and not investors’ interest.
Conclusion
The results show that the characteris-tics of earnings management are not consis-tent. Accrual earnings management in the Philippines is informational, but real earnings management does not have a relationship with future profitability. Managers in the Phil-ippines manage earnings through an account-ing policy to give adequate information to the shareholder, so they do not make a bad deci-sion-making. The real earnings management, which does not have any relation with future profitability, indicates that the real earnings management in the Philippines is not strate-gically planned by manager to create better profitability in the future. By contrast, real earnings management in Thailand is
informa-tional, but future profitability is not influ-enced by accrual earnings management. Thai managers manage real activities to show that the firm’s future profitability will be better and the investor can trust the firm’s perfor-mance. The real earnings management in Thailand is part of a firm’s strategic planning to get better profit and for investor wealth.
In Indonesia, real earnings management is opportunistic. However, accrual earnings management does not have a relationship with future profitability. The managers’ ac-tions do not give better information but are to benefit themselves. Real earnings manage-ment in Indonesia is opportunistic. Manag-ers manage earnings through real activity, like accelerating the timing of sales through in-creased price discount and more lenient credit terms, reporting lower cost of goods sold through increased production, and decreas-ing discretionary expenses to boost current period earnings. Accrual earnings manage-ment in Malaysia is opportunistic, but real earnings management does not have any re-lationship with future profitability. Malaysian firms manage earnings for their own benefit and ignore the investors’ wealth. Future prof-itability in Singapore is not influenced by real earnings management, accrual earnings man-agement, firm size, and growth opportunity. Singapore’s management manages earnings so as not to give more information to investor.
This study has several limitations. First, it only uses 2008 as the observation year. Therefore, we must be careful when interpret-ing this result because 2008 was the year of the U.S. economic crisis which had an impact on ASEAN countries’ economies. A sensi-tivity study to explore whether there are dif-ferences crisis and non-crisis periods could not be carried out because of data limitations.
Second, the sample was limited because of the unavailability of complete data on the OSIRIS database.
This study did not observe factors that may affect the informational of accrual earn-ings management and real earnearn-ings manage-ment. In addition, this study only uses a one-year period during the world economic crisis. Therefore, future studies can include factors that may affect the informational purposes of accrual earnings management and real earnings management and use a longer pe-riod observation.
References
Ball, R., and P. Brown. 1968. An empirical evaluation of accounting income numbers. Journal of Accounting Research 6 (2): 159-178.
Barth, M. E., J. A. Elliot, and M. W. Finn. 1999.Market rewards associated with patterns of increasing earnings. Journal of Accounting Research (Autumn): 387–413.
Bureau van Dijk Electronic Publishing. 2007.OSIRIS: Data Guide.Singapore: Bureau van Dijk Electronic Publishing.
Cohen, D., A. Dey, and T. Lys. 2008. Real and accrual-based earnings management in the pre- and post-sarbanes oxley periods. Accounting Review 83: 757–787.
Cohen, D., and P. Zeroing. 2008. Economics consequences of real and accrual based earnings manage-ment activities. Working Paper. New York University.
Dechow, P. M, R. G. Sloan, and A. P. Sweeney. 1995. Detecting earnings management. Accounting Review 70 (2): 193–225.
Demski, J., and D. E. M. Sappington. 1987. Delegated expertise. Journal of Accounting Research (Spring): 68–89.
Demski, J., and D. E. M. Sappington. 1990. Fully revealing income measurement. The Accounting Review
(April): 363–383.
Fee, C. E., and C. J. Hadlock. 2003. Raids, rewards, and reputations in the market for managerial talent.
The Review Financial Studies 16 (4) (Winter):1315–1357
Gunny, K. 2009. The relation between earnings management using real activities manipulation and future performance: Evidence from meeting earnings benchmarks. Working Paper. University of Colo-rado.
Healy, P. M. 1985. The effect of bonus schemes on accounting decisions. Journal of Accounting and Economics
(April): 85–107.
Leuz, C. 2010. Different approaches to corporate reporting regulation: How juridictions differ and why.
Leuz, C., D. Nanda, and P. D. Wysocki. 2003. Earnings management and investor protection: An interna-tional comparison. Journal of Financial and Economics 69: 505–527.
Lo, K. 2008. Earnings management and earnings quality. Journal of Accounting and Economics 45: 350–357. Roychowdhury, S. 2006. Earnings management through real activities manipulation. Journal of Accounting
and Economics 42: 335–370.
Scott, W. R. 2009. Financial Accounting Theory (5th.). Ontario: Pearson Canada Inc.
Siregar, S. V., and S. Utama. 2008. Type of earnings management and the effect of ownership structure, firm size, and corporate-governance practices: Evidence from Indonesia. International Journal of Accounting 43: 1–27.
Stocken R. K., and D. E. M. Verrecchia. 2004. Financial reporting system choice and disclosure manage-ment. The Accounting Review (October): 1181–1203
Subramanyam, K. R. 1996. The pricing of discretionary accruals. Journal of Accounting and Economics 22: 249–281.
Subramanyam, K. R., and J. Jeweled. 2009. Financial Statement Analysis (10th ed.). Singapore: McGraw-Hill
Tucker, J. W., and P. A. Zarowin. 2006. Does income smoothing improve earnings informativeness? The Accounting Review 81 (1): 251–270.
Watts, R. L., and J. L. Zimmerman.1986. Positive Accounting Theory. New Jersey: Prentice-Hall International Inc.