Full Terms & Conditions of access and use can be found at
http://www.tandfonline.com/action/journalInformation?journalCode=cbie20
Download by: [Universitas Maritim Raja Ali Haji] Date: 17 January 2016, At: 23:28
Bulletin of Indonesian Economic Studies
ISSN: 0007-4918 (Print) 1472-7234 (Online) Journal homepage: http://www.tandfonline.com/loi/cbie20
Assessing Poverty Trends in Indonesia by
International Poverty Lines
Andy Sumner & Peter Edward
To cite this article: Andy Sumner & Peter Edward (2014) Assessing Poverty Trends in Indonesia
by International Poverty Lines, Bulletin of Indonesian Economic Studies, 50:2, 207-225, DOI: 10.1080/00074918.2014.938404
To link to this article: http://dx.doi.org/10.1080/00074918.2014.938404
Published online: 30 Jul 2014.
Submit your article to this journal
Article views: 432
View related articles
View Crossmark data
ISSN 0007-4918 print/ISSN 1472-7234 online/14/000207-19 © 2014 Indonesia Project ANU http://dx.doi.org/10.1080/00074918.2014.938404
* Many thanks to the two anonymous referees for their comments, and to Arief Anshory Yusuf, Asep Suryahadi, Dharendra Wardhana, Lukas Schlögl, and seminar participants at the SMERU Research Institute, Jakarta, on 2 May 2013, and at the Centre for Economic and Development Studies, Department of Economics, Padjadjaran University, Bandung, on 3 May 2013.
ASSESSING POVERTY TRENDS IN INDONESIA BY
INTERNATIONAL POVERTY LINES
Andy Sumner*
King’s College London
Peter Edward*
Newcastle University Business School (United Kingdom)
Indonesia has made well-documented and drastic progress in raising average in-comes and reducing poverty. This article adds to the literature by providing a com-plementary perspective of poverty between 1984 and 2011. We discuss the evolution of poverty in Indonesia using international poverty lines—$1.25 per person per day (in 2005 purchasing power parity dollars) and $2.00 per day, and we add $10.00 per day. We generate estimates of poverty since 1984 and make projections based on var-ious trends in growth and inequality. We ind that Indonesia has the potential to be -come a high-in-come country by around 2025 and end $1.25-per-day and $2.00-per-day poverty by 2030, but this will require strong economic growth and favourable changes in distribution. Looking ahead, the end of poverty in Indonesia may mean that a large proportion of the population will remain vulnerable to poverty for some time to come, suggesting that public policy priorities will need to balance insurance and risk-management mechanisms with more ‘traditional’ poverty policy.
Keywords: poverty, inequality
JEL classiication: D63, I32
INTRODUCTION
Over the last 30 years Indonesia has made well-documented and drastic improve-ments to its average incomes and in the reduction of poverty. Recently, however, the context for poverty reduction in Indonesia has increasingly been a discus-sion of its slowing rate (see Suryahadi, Hadiwidjaja, and Sumatro 2012) and how
to reduce poverty suficiently to meet the National Medium-Term Development
Plan’s poverty target of 8%–10% (according to the national poverty line) by 2014. This article adds to the literature by offering a complementary perspective. We analyse international poverty lines—$1.25 per person per day (in 2005 purchasing
power parity [PPP] dollars) and $2.00 per day, and we add $10.00 per day—in our discussion of trends and patterns in poverty reduction. We use a model of growth, inequality, and poverty to produce estimates for previous years and to project future poverty-reduction patterns by examining various trends in growth and inequality.
We are, of course, not the irst to consider the evolution of poverty in Indone -sia; a number of studies that we review consider the evolution of poverty by the national poverty line. Yet, to our knowledge, no study considers the evolution of poverty by international poverty lines or makes poverty projections in various scenarios. We also discuss trends in inequality and the distributional pattern of growth.
INDONESIA’S DEVELOPMENT SINCE 1984 Economic Development
Between 1984 and 2011, gross national income (GNI) per capita (Atlas method) in Indonesia increased almost sixfold, from $540 to $2,940,1 and GDP per capita,
in 2005 PPP dollars, almost tripled, from $1,500 to just under $4,100.2 Average
PPP income stood at about $11 per person per day in 2011. Few countries have
achieved such a drastic change.3 That said, there was a noticeable dip after the
1997–98 Asian inancial crisis, and the poverty impact of the crisis beyond the
immediate reverberations has been contentious.
Indicators of structural change in Indonesia’s economic development have also shifted substantially since the 1980s (and this transformation can, of course, be traced to before the 1980s).4 Indonesia fares reasonably well when assessed
against countries at a similar level of per capita income—except in comparisons of poverty levels by international standards. Indonesia is close to the
upper-middle-income group weighted mean in indicators of oficial development assistance; but
it is close to the lower-middle-income group weighted mean in the proportional increase in GDP (PPP) per capita since 1990 and the contribution of agriculture
1. Measured using the Atlas method of exchange-rate conversion, used by the World Bank to categorise countries’ income status as low, middle, or upper income.
2. Data from the World Bank’s World Development Indicators.
3. The Commission on Growth and Development (2008, 20) identiied just 13–15 coun -tries—including Indonesia, Thailand, Malaysia, and Vietnam—that had achieved average growth rates of 7% a year or more (at which speed the economy doubles in size every 10 years) for 25 years or longer. Booth (1999) argues that initial conditions were crucial in dif-ferentiating the more recent Southeast Asian ‘miracle’ from the older East Asian ‘miracle’. 4. Large shifts occurred, for example, in the importance of non-agricultural sectors to GDP and to the labour force (although with noticeable reverse trends around the 1997–98 crisis): the value added in agriculture fell from 22.7% of GDP in 1984 to just 14.7% in 2011, and employment in agriculture fell from 54.7% of the labour force to 35.9% in the same period. In comparison, the value added in industry rose as a share of GDP from 39.1% to 47.1%, while services increased drastically as a share of employment (from 32.0% in 1984 to 43.5% in 2011) but their share of value added in GDP remained steady (from 38.2% in 2004 to 38.1% in 2011). Several studies (Fane and Warr 2002, for example) argue that this economic growth in the services sector was more beneicial to the poor than economic growth in the agriculture sector.
to GDP, and close to the low-income-group weighted mean in primary export dependency (Sumner, Suryahadi, and Thang 2012).
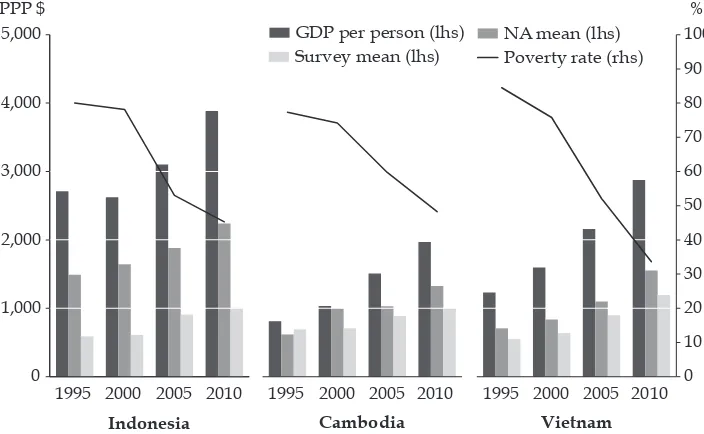
Indonesia’s $2.00-per-day poverty rate is, surprisingly, comparable with or
higher than those of its poorer neighbours, such as Cambodia and Vietnam (igure
1). It is startling that Vietnam, which in 2010 had less than three-quarters of the GDP per capita income of Indonesia, has a much lower $2.00-per-day poverty rate (34% in 2010 compared with Indonesia’s 45%) and that Indonesia’s poverty rate
is close to Cambodia’s poverty rate, which is 48%.5 Although the data for GDP
per capita (PPP) differ, the survey means are similar, and are higher in Vietnam in
2010 than in Indonesia or Cambodia—which explains why Vietnam has the low -est poverty rate of the three.
The Evolution of Income Poverty and Distribution in Indonesia
Many studies published since the 1997–98 Asian inancial crisis consider the evolution of poverty in Indonesia. We identiied about 60 such studies, most of
which are based on time-series analysis of data from the National Socio-economic Survey (Susenas), conducted by Badan Pusat Statistik (BPS), the central statistics
5. Income shares of the bottom 40% were as follows: Indonesia, 19% in 2010; Cambodia, 19% in 2008; and Vietnam, 19% in 2008. Gini coeficients were as follows: Indonesia, 35 in 2010; Cambodia, 38 in 2008; and Vietnam, 36 in 2008.
FIGURE 1 Poverty, GDP per Person, and National Account and Survey Means in Indonesia, Cambodia, and Vietnam, 1995–2010
1995 2000 2005 2010 1995 2000 2005 2010 0 10
Source: Authors’ estimates based on data from the World Bank (2013a, 2013b).
Note: PPP = purchasing power parity (in 2005 dollars). NA = national account (household inal con -sumption). Poverty measured against the international poverty rate of $2.00 per person per day. NA and survey means taken, respectively, from the World Bank’s World Development Indicators and PovcalNet database.
agency. Susenas data are available every three years from 1984 to 2002, and every year from 2002 onwards. A few studies draw on data from Sakernas, the national labour-force survey (conducted annually from 1986 onwards), and from the
RAND Corporation’s regular Indonesia Family Life Survey to estimate expendi -ture poverty and, in particular, to examine chronic and transient poverty.
We can group these identiied studies into three relevant themes: trends over
time in expenditure poverty, the relation between expenditure poverty and eco-nomic growth over time, and trends in inequality. The studies that focus on trends in expenditure poverty typically use Susenas data over a period of time, and use either the national monetary poverty lines of BPS or a variation of the poverty lines calculated by Pradhan et al. (2001). They tend to agree that absolute poverty
declined in Indonesia during the Soeharto years (Asra 2000; Booth 2000; Fried
-man 2005); yet poverty was still a problem in the lead-up to 1997–98 Asian inan -cial crisis, and its rate may have been underestimated owing to national poverty lines being set low (Asra 2000). Moreover, welfare improvements have slowed
since the crisis (Friedman and Levinsohn 2002; Lanjouw et al. 2001; Skouias,
Suryahadi, and Sumarto 2000; Suryahadi, Hadiwidjaja, and Sumatro 2012). Some studies disagree about how quickly Indonesia’s poverty level, as an indi-cator of Indonesia’s recovery, returned to pre-crisis levels after the 1997–98 Asian
inancial crisis. Those arguing that poverty fell quickly after the crisis, or that
the social consequences were less severe than expected, include Suryahadi and
Sumarto (2003a, 2003b), while those arguing that the crisis had more signiicant or
lasting consequences for poverty in Indonesia include Dhanani and Islam (2002) and Ravallion and Lokshin (2007). To a certain extent, the use of different poverty
indicators plays a part in the different indings.
McCulloch and Grover (2010) suggest that the 2008 global inancial crisis had
only a moderate impact on Indonesia’s poverty rate. Suryahadi, Hadiwidjaja, and Sumarto (2012) note that this rate has risen only twice since the 1990s: during the
1997–98 crisis, owing to job losses and hyperinlation, and in 2005–6, owing to inlation caused by rises in the domestic fuel price and in the cost of rice (the latter because of the 2004 ban on rice imports—see McCulloch 2008).
Studies focused on the relation between expenditure poverty and economic growth typically use Susenas data, and use either the national monetary poverty lines of BPS or a variation of the poverty lines calculated by Pradhan et al. (2001).
They tend to agree that economic growth in Indonesia has, overall, beneited the
poor, and that Indonesia has had a high and stable growth elasticity of poverty,
even after the 1997–98 crisis (Baliscan, Pernia, and Asra 2010; Friedman 2005;
Suryahadi, Hadiwidjaja, and Sumatro 2012; Timmer 2004). Yet economic growth in different sectors has different impacts on poverty—economic growth in the ser-vices sector, for example, has been found to do more to increase the incomes of the
poor than has growth in agriculture (Fane and Warr 2002; Suryahadi, Suryadarma,
and Sumarto 2006; Suryahadi, Hadiwidjaja, and Sumatro 2012). This is important, since rural poverty dominates the poverty count in Indonesia when the national poverty line is used. Suryahadi, Hadiwidjaja, and Sumatro (2012, 216) estimate that rural poverty composed two-thirds of total poverty in 2010.
Studies focused on inequality trends typically use Susenas data and
com-pute the Gini coeficient or the Theil index. In general, they agree that inequal -ity was relatively low or declining before the 1997–98 crisis (Akita, Kurniawan, and Miyata 2011) and that inequality did not increase drastically as a result of
economic growth (Van der Eng 2009). There are some detractors, however, who
argue that inequality was high or increasing before the crisis (Frankema and Marks 2009; Leigh and Van der Eng 2010; Van Leeuwen and Foldvari 2012); or that
growth has largely been distributionally neutral, although areas such as Java have grown slightly faster than the national average (Hill 2008; Hill, Resosudarmo, and Vidyattama 2008); or that inequality, mainly intragroup and urban–rural inequal-ity, has increased in the aftermath of the crisis (Akita 2002; Akita and Miyata 2008;
Skouias 2001; Suryadarma et al. 2005; Suryadarma et al. 2006) and intraregional
inequality (Yusuf, Sumner, and Rum 2014, in this issue).
INDONESIA AND INTERNATIONAL POVERTY LINES: METHODOLOGY
The Growth, Inequality, and Poverty (GrIP) model, described in detail in Edward and Sumner (2013a, 2013b, 2014), allows us to compare trends in poverty and inequality over time across countries and across different input assumptions, and to make projections based on these trends. Our main objective in using the GrIP model is to construct a truly global model of consumption distribution that allows ready comparison of different assumptions and approaches to estimat-ing poverty (such as comparisons of estimatestimat-ing poverty by usestimat-ing survey income or expenditure means and estimating poverty by using national account [NA] income means).
Survey distributions (quintile and upper and lower decile data) are taken, in the following order of preference, from the World Bank’s PovcalNet database, the World Bank’s World Development Indicators, or the United Nations University’s World Income Inequality Database V2.0c (May 2008). Survey means are taken from PovcalNet, and NA means are taken from World Development Indicators. All analysis and results are in 2005 PPP dollars.
The data for Indonesia in the GrIP model, as shown in table 1, are as follows:
• Decile values and survey means are taken from PovcalNet, which provides data at three-yearly intervals from 1984 to 2005 and annually thereafter up to 2011 (values for intermediate years are determined by interpolation).
• Data on household expenditure (household inal consumption) are taken from World Development Indicators, which provide annual data from 1984 to 2011. • Urban and rural population data are taken from PovcalNet for all the survey
years except 2011, which is not presented. We estimate the 2011 igures from
the trends in urban–rural shares in earlier years. The urban–rural split in the projected populations is based on a linear extrapolation of the change in the shares from 1990 to 2010, which we then applied to the United Nations’ total population forecast.6
In order to produce future projections of income and poverty, we use similar assumptions to those of Karver, Kenny, and Sumner (2012) and derive the forecast
rates from the IMF’s World Economic Outlook (WEO). The estimates are based on
6. This approach has now been superseded by the recent publication of the BPS and Bap-penas population projections (See McDonald 2014).
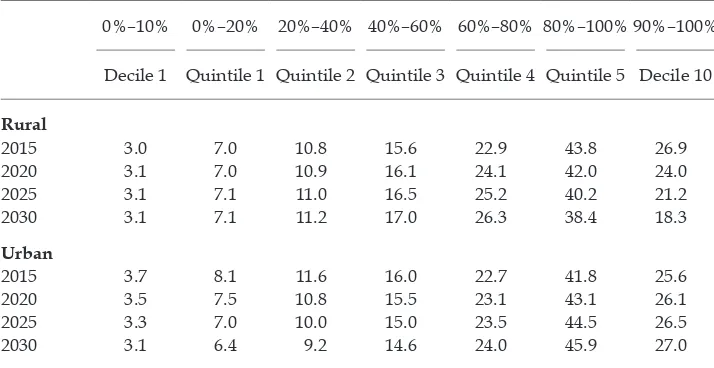
TABLE 1 Share of Consumption, Rural and Urban, by Income Distribution, 2015–30 (%)
0%–10% 0%–20% 20%–40% 40%–60% 60%–80% 80%–100% 90%–100%
Decile 1 Quintile 1 Quintile 2 Quintile 3 Quintile 4 Quintile 5 Decile 10
Rural
2015 3.0 7.0 10.8 15.6 22.9 43.8 26.9
2020 3.1 7.0 10.9 16.1 24.1 42.0 24.0
2025 3.1 7.1 11.0 16.5 25.2 40.2 21.2
2030 3.1 7.1 11.2 17.0 26.3 38.4 18.3
Urban
2015 3.7 8.1 11.6 16.0 22.7 41.8 25.6
2020 3.5 7.5 10.8 15.5 23.1 43.1 26.1
2025 3.3 7.0 10.0 15.0 23.5 44.5 26.5
2030 3.1 6.4 9.2 14.6 24.0 45.9 27.0
Source: Authors’ estimates derived from Growth, Inequality, and Poverty (GrIP) model v.1.0, described in detail by Edward and Sumner (2013a, 2013b, 2014).
Note: Shares extrapolated based on current trends.
the average growth rate during 2010–17. We use the following three scenarios for GDP PPP growth estimates for Indonesia for 2010–30:
• optimistic economic growth, which assumes that the average national growth rate in the WEO is sustained to whatever point in the future, producing an average of 6.7% aggregate economic growth per year
• moderate economic growth, which is the ‘optimistic’ GDP growth rate minus
one percentage point (based on the assumption that IMF projections are on
average 1% too high, as Aldenhoff 2007 has demonstrated), producing an average of 5.7% aggregate economic growth per year
• pessimistic economic growth, which is half of ‘optimistic’ GDP growth, producing an average of 3.4% aggregate economic growth per year
Comparing these scenarios with past rates of aggregate growth suggests that
the ‘optimistic’ growth rate is indeed optimistic, but not overly so. The average
aggregate growth rate since the Asian inancial crisis is 5.3% per year (from 2000
to 2011) and the aggregate growth rates of 2010 and 2011 are much closer to the ‘optimistic’ growth scenario, at 6.2% and 6.5% respectively.
We use three inequality scenarios to illustrate the impact of different inequality assumptions on future poverty:
• static inequality from 2011 onwards
• extrapolated inequality, in which dynamic changes in distribution are estimated by linear extrapolation of the trends calculated from 1990 to 2010 (table 1) • lowest inequality, which represents a return to the distribution with the lowest
level of inequality in the PovcalNet dataset for Indonesia (which is 1999 for rural Indonesia and 1987 for urban Indonesia)
The main purpose of this dynamic inequality analysis is illustrative—to
investi-gate the extent to which the assumption of static distribution introduces a signii -cant difference to poverty projections in the calculations. We explore the potential implications of decreases in within-country inequality by providing forecasts cal-culated using the lowest inequality for Indonesia since 1984.
If we considered inequality trends of the past decades, we would be more likely to think that inequality will rise further. Yusuf, Sumner, and Rum (2014, in this issue) use various measures and disaggregations in discussing in some depth the trend in inequality during the last 20 years, and note the unequivocal rises in inequality across various measures but a much smoother rise in inequality when a consistent methodology is used compared with the BPS data series (on which
PovCal is based).7
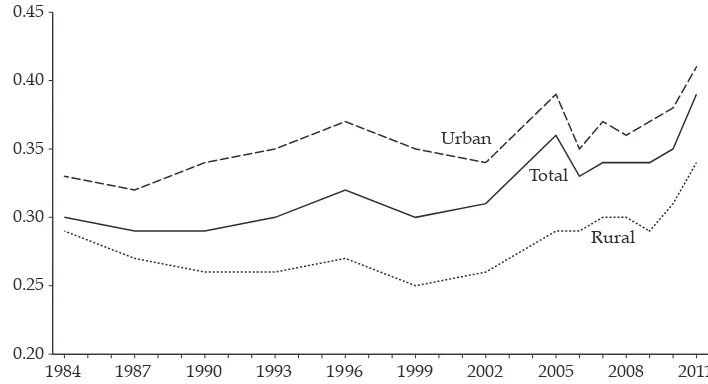
Figure 2 shows the Gini coeficient based on the GrIP data. It illustrates that
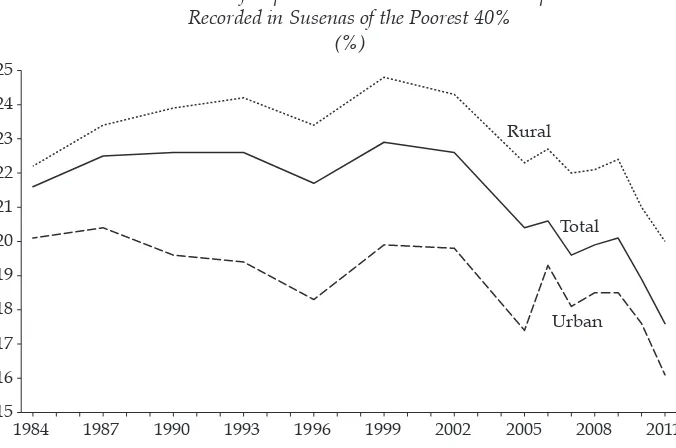
inequality in Indonesia rose in between 1984 and 2011. In light of the rising pat-tern of inequality since the late 1990s, projections of future poverty based on static or falling inequality should be viewed with these part trends in mind (meaning it is unlikely that inequality will remain static or fall in Indonesia without major pol-icy interventions). The graphs are consistent with the story that although growth was broad-based at the lower end of the distribution, that there were greater gains in the middle and at the top end of the distribution (and thus inequality rose). At the bottom end of the distribution, the share of expenditure in total household expenditure recorded in Susenas of the poorest 40% shrank during 2001–10 in
both urban and rural areas (igure 3), which is consistent with the slowing of pov -erty reduction noted earlier. Of concern to policymakers is that rising inequality will slow the rate of poverty reduction if there is a fall in the share of the lower end of the distribution; it may also slow economic growth or shorten the growth
7. See discussion by Yusuf, Sumner, and Rum (2014, in this issue). FIGURE 2 Indonesia’s Gini Coeficient, 1984–2011
Total
Rural Urban
1984 1987 1990 1993 1996 1999 2002 2005 2008 2011
0.20 0.25 0.30 0.35 0.40 0.45
Source: Authors’ estimates derived from Growth, Inequality, and Poverty (GrIP) model v.1.0, described in detail by Edward and Sumner (2013a, 2013b, 2014).
episode, or both (see, for example, Cornia, Addison, and Kiiski 2004; Berg and
Ostry 2011; Easterly 2005).
We use international poverty lines of $1.25 per person per day (in PPP dollars) and $2.00 per day, and we add a poverty line of $10.00 per day. The $1.25 line is now approximately equivalent to the current PPP dollar value of the 2012 Indone-sian national poverty line, which has been getting closer to the $1.25 international poverty line since the revisions to the setting of Indonesia’s national poverty line in 1998. We include the $2.00 poverty line because it is well established as the World Bank’s moderate international poverty line, which is close to the median poverty line across all developing countries ($2.36 per person in 2008) (Ravallion 2012, 25).8
We introduce a $10.00-per-day poverty line on the basis that this threshold broadly separates those with ‘rich world’ lifestyles from those with ‘developing world’ lifestyles.9 Given the inevitable degree of arbitrariness in the precise
loca-tion of these thresholds, the $10.00 line seems a reasonable point of separaloca-tion.
López-Calva and Ortiz-Juarez’s (2011) study of Chile, Mexico, and Brazil sug -gests that $10.00 is an approximate security-from-poverty line, and that the risk of falling below the national poverty lines of those countries (of $4.00–$5.00 in PPP
8. The mean for developing-country poverty lines is $4.64 per person per day—which is rather higher than the median, because poverty lines can be $11.00–$12.00 (the mean in Latin America, the Caribbean, and Eastern Europe) or closer to $4.00 (the mean in East Asia and Paciic) (Ravallion 2012, 25).
9. From the GrIP model, 87% of the population of high-income countries are above $10.00 per person per day, while 98% of the populations of low-income and lower-middle-income countries are below this level.
FIGURE 3 Share of Expenditure in Total Household Expenditure Recorded in Susenas of the Poorest 40%
(%)
Urban Rural
Total
1984 1987 1990 1993 1996 1999 2002 2005 2008 2011
15 16 17 18 19 20 21 22 23 24 25
Source: Authors’ estimates derived from Growth, Inequality, and Poverty (GrIP) model v.1.0, described in detail in Edward and Sumner (2013a, 2013b, 2014).
dollars) was as low as approximately 10% at an initial income of $10.00 per per-son per day. The authors refer to this as a ‘vulnerability approach to identifying
the middle classes’. Further, Birdsall, Lustig, and Meyer (2013) note that $10.00
is the mean per capita income of those who have completed secondary school across Latin America, suggesting that the completion of such schooling is asso-ciated with some kind of greater security.10 We propose that those living above
the $2.00-per-day line but below the $10.00-per-day line could be referred to as the ‘global insecure’, and those living above the $10.00-per-day line the ‘global secure’.
To validate our data, we compare the Gini coeficient from the GrIP model to those from BPS and PovcalNet. We ind a close correlation. The GrIP model tends to underestimate the Gini coeficient, owing to the way that the model extrapo -lates and interpo-lates across the distribution. GrIP uses a method for estimating
fractile shares of income from ventiles and deciles. It is extremely dificult to esti -mate from this data the detailed distribution across (particularly) the top 5% of the distribution. The method in GrIP is designed to be inherently conservative in this region (see Edward 2006, 1692) so that GrIP slightly underestimates Gini
coef-icients for individual countries. We would expect the BPS Gini coeficient to be
slightly higher, which they are. PovcalNet also underestimates the national Gini
coeficient; GrIP is close to PovcalNet, and it may arguably be better given that its
estimates are closer to those of BPS. PovcalNet uses a kernel distribution method and GrIP a linear distribution method to estimate the distribution detail from the decile and quintile data, which yields slightly different estimates of the Lorenz
curve and hence of the Gini coeficient.
As is well known, expenditure survey data (such as those from Susenas and thus those from PovcalNet for Indonesia) understate income inequality since they ignore savings (for example) while top incomes largely escape surveys (Leigh and Van der Eng 2010). Those are inherent shortcomings of all such surveys, not just Susenas. The decile data in PovcalNet, and on which GrIP is based, are, in general, widely recognised as likely to underestimate inequality and the incomes
of the rich—so it is not surprising that the GrIP results relect these shortcomings
in the underlying data. Nugraha and Lewis (2013) use Susenas data to argue that
the different forms of non-market income should be taken into account. We ind
(see below) that in the GrIP data the $10.00 poverty line questions the quality of information on higher incomes.
PAST TRENDS AND FUTURE PROJECTIONS, 1984–2030
In igures 4–9, we consider growth, distribution, and poverty during 1984–2011
and, where appropriate, project their trends to 2030. The discussion is grouped by trends in (a) income per capita; (b) patterns of economic growth; and (c) poverty. We use the scenario of optimistic economic growth to show the extent of possi-bility (and because it is close to the higher end of the Indonesian’s government’s own target range). The data for other growth scenarios are presented in Sumner and Edward’s (2013) study.
10. In contrast, Ravallion (2010) uses a higher threshold, the US poverty line of $13.00 per person per day.
Trends in Income per Capita, 1984–2030
Extrapolation of Indonesia’s GNI per capita (Atlas method) to 2030 suggests that Indonesia’s GNI per capita (Atlas method) would cross $12,000 between 2025 and
2030 if the ‘optimistic’ economic growth scenario held (that is, the IMF’s WEO
forecast extrapolated to 2030 at 6.7% a year, which is clearly optimistic). Such projections of GNI per capita (using the Atlas method) show that Indonesia may
cross the threshold into the upper-middle-income country classiication in 2015
and could become a high-income country between 2025 and 2030.
Patterns of Growth, 1984–2011
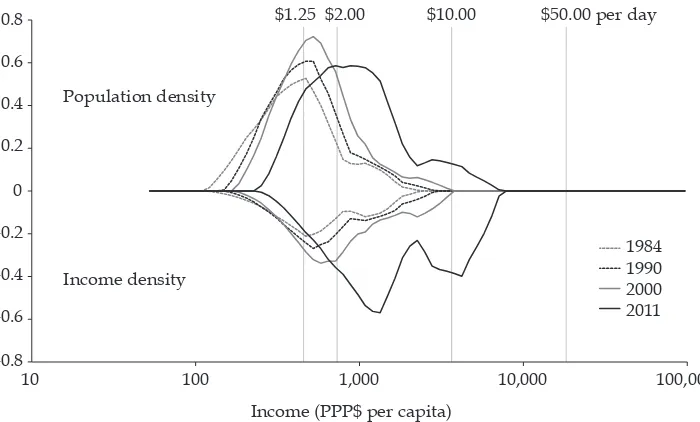
Figures 4 and 5 show Indonesia’s density curve and growth incidence curve. Fig -ure 4 shows the gradual shift of the poverty peak (and the decline in size of the peak) between 1984 and 2011, and thus the emergence of the ‘global insecure’ in Indonesia. The rise in consumption is particularly visible in the middle and at the top end of the distribution (the bottom half of the graph). The change between 2000 and 2011 is quite striking.
In igure 4, consumption per capita (in 2005 PPP dollars) is plotted on a log scale
on the horizontal axis. The vertical lines represent the $1.25-per-day, $2.00-per-day,
and $10.00-per-day consumption levels (and in this igure we add a
$50.00-per-day to show consumption at the top of the distribution). The population curves plotted above the horizontal axis represent the number of people living at each consumption level. The segment to the left of the $2.00 line represents the propor-tion of the 2011 populapropor-tion who were living on less than $2.00 per day. The verti-cal density axis is dimensionless (it is normalised so that the area bounded by the
FIGURE 4 Density Curve by International Poverty Lines, 1984–2011
-0.8 -0.6 -0.4 -0.2 0 0.2 0.4 0.6 0.8
10 100 1,000 10,000 100,000
$1.25 $2.00 $10.00 $50.00 per day
1984 1990 2000 2011 Population density
Income density
Income (PPP$ per capita)
Source: Authors’ estimates derived from Growth, Inequality, and Poverty (GrIP) model v.1.0, described in detail by Edward and Sumner (2013a, 2013b, 2014).
Note: PPP = purchasing power parity.
population curve and the horizontal axis aggregates to unity).11 The lower curves
(plotted negatively) work in the same way, but they represent the consumption of the people living at any given level of consumption (as shown on the horizontal axis). The area between the consumption curve and the horizontal axis indicates how much the corresponding population (as indicated by the population curve) collectively consumes per year (in 2005 PPP dollars).
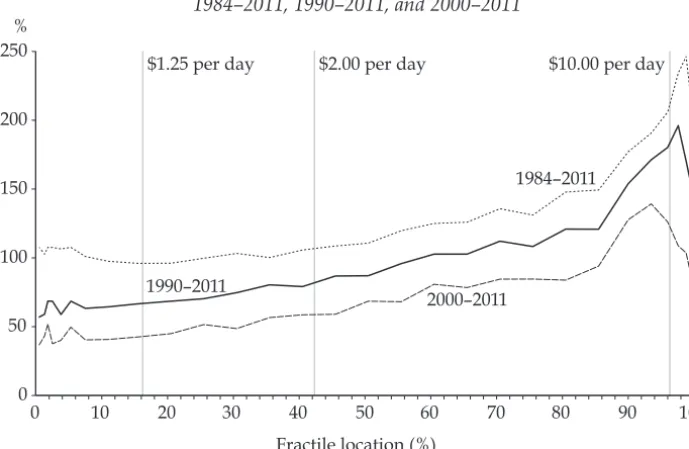
Figure 5 is the growth incidence curve (percentage changes in real con -sumption). The horizontal axis represents fractile rank ordered by the level of consumption. The vertical axis represents the percentage change in consumption per capita with plots for 1984–2011, 1990–2011, and 2000–2011.12 The igure shows
that the broad base to economic growth over the periods at the lower end of the
distribution is accompanied by more signiicant beneits accruing to the top 15%–
25% of the population over the period.
11. In theory, it would be possible to assign to this axis a value for actual population count, but that would also require us to specify a bandwidth along the horizontal axis over which that aggregation was calculated. Since this is a log-scale, that bandwidth would not trans-late readily into a simple concept such as the current ‘X thousand people per dollar of consumption’. Our approach thus allows us to present the population and consumption curves in one graph on the same scale.
12. There is some sensitivity to the base years whenever drawing a growth incidence curve. For example, if for Indonesia we take 2003 as the base year (as in the World Bank’s [2014, 38] report) and consider the 2003–11 period, we get the lowest growth incidence possible for the lower deciles (just 1.3% per year for the poorest 40%).
FIGURE 5 Change in Consumption per Person, by Fractile, 1984–2011, 1990–2011, and 2000–2011
0 10 20 30 40 50 60 70 80 90 100
0 50 100 150 200 250
$1.25 per day $2.00 per day $10.00 per day %
Fractile location (%)
1984–2011
1990–2011
2000–2011
Source: Authors’ estimates derived from Growth, Inequality, and Poverty (GrIP) model v.1.0, described in detail by Edward and Sumner (2013a, 2013b, 2014).
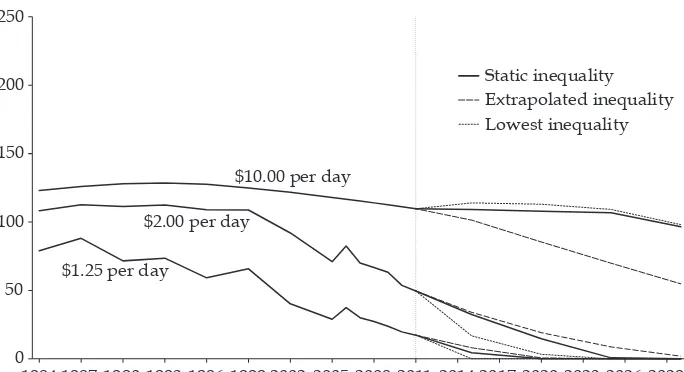
Lines and in Three Inequality Scenarios, 1984–2030 (millions)
$10.00 per day
$2.00 per day
$1.25 per day
Static inequality Extrapolated inequality Lowest inequality
1984 1987 1990 1993 1996 1999 2002 2005 2008 2011 2014 2017 2020 2023 2026 2029 0
50 100 150 200 250
Source: Authors’ estimates derived from Growth, Inequality, and Poverty (GrIP) model v.1.0, described in detail by Edward and Sumner (2013a, 2013b, 2014).
Note: Projected headcounts assume an optimistic level of economic growth from 2011 to 2030.
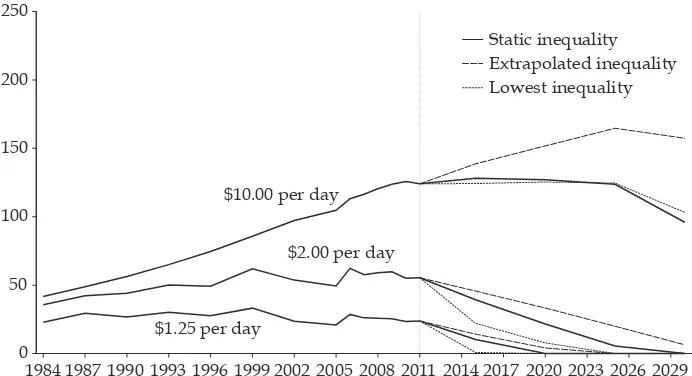
FIGURE 7 Past and Projected Poverty Headcounts (Rural) by International Poverty Lines and in Three Inequality Scenarios, 1984–2030
(millions)
$10.00 per day
$2.00 per day
$1.25 per day
Static inequality Extrapolated inequality Lowest inequality
1984 1987 1990 1993 1996 1999 2002 2005 2008 2011 2014 2017 2020 2023 2026 2029 0
50 100 150 200 250
Source: Authors’ estimates derived from Growth, Inequality, and Poverty (GrIP) model v.1.0, described in detail by Edward and Sumner (2013a, 2013b, 2014).
Note: Projected headcounts assume an optimistic level of economic growth from 2011 to 2030.
Trends in Poverty, 1984–2030
Figures 6 to 8 show total, rural, and urban poverty headcounts in millions of peo -ple from 1984–2030, and estimates of poverty by $1.25, $2.00, and $10.00 poverty lines (see also appendix table A1). In considering the trends of poverty in Indo-nesia, it is evident that the curve for poverty reduction is not very smooth. The two spikes noted by Suryahadi, Hadiwidjaja, and Sumatro (2012) are visible in
igure 6. The data suggest that the end of $1.25 and $2.00 poverty in 2015–25 is
plausible under the scenario of optimistic economic growth if distribution returns to the lowest inequality level. This scenario is unequivocally optimistic, however, and simply illustrates what is possible.13
Figure 6 also shows that $10.00-per-day poverty will not start to fall until 2025.
And if we accept the basis of a $10.00, ‘security from poverty’ poverty line, the end of extreme and moderate poverty could be accompanied by an increase in the number of the ‘global insecure’ (possibly to 200 million by 2030).14 Conversely, we
13. In 1998, Thailand had similar levels of $2.00-per-day poverty to Indonesia today. After almost two decades of GDP growth at 3.8% per person per year and largely static inequal-ity, Thailand has reduced $2.00-per-day poverty to under 4.0% of the population. A similar pattern of growth and inequality could mean the end of poverty in Indonesia by 2030. 14. The emergence of a substantial group of the ‘global insecure’ raises questions for evolv-ing public policy priorities and the balance between insurance and risk-management mechanisms versus ‘traditional’ poverty policy. See Dartanto and Nurkholis’s (2013, 62) taxonomy of chronic and transient poverty programs. See also the detailed policy review of Suryahadi et al. (2012).
FIGURE 8 Past and Projected Poverty Headcounts (Urban) by International Poverty Lines and in Three Inequality Scenarios, 1984–2030
(millions)
$10.00 per day
$2.00 per day
$1.25 per day
Static inequality Extrapolated inequality Lowest inequality
1984 1987 1990 1993 1996 1999 2002 2005 2008 2011 2014 2017 2020 2023 2026 2029 0
50 100 150 200 250
Source: Authors’ estimates derived from Growth, Inequality, and Poverty (GrIP) model v.1.0, described in detail by Edward and Sumner (2013a, 2013b, 2014).
Note: Projected headcounts assume an optimistic level of economic growth from 2011 to 2030.
could argue that the fact that high incomes are not well captured in the data gravi-tates against the use of this higher poverty line.15 The $10.00-per-day poverty rate
rose during 1984–2010 because about 99% of the population were below this line in 2010 (96% in 2011) and the population increased. According to the data, up to 2010 nearly all of the population was below the $10.00 line (and thus to the left
of the $10.00 line in igure 4), which suggests that the rich are under-represented
in Susenas samples. Moreover, the population increased fastest in urban areas, meaning that poverty was becoming more urbanised.
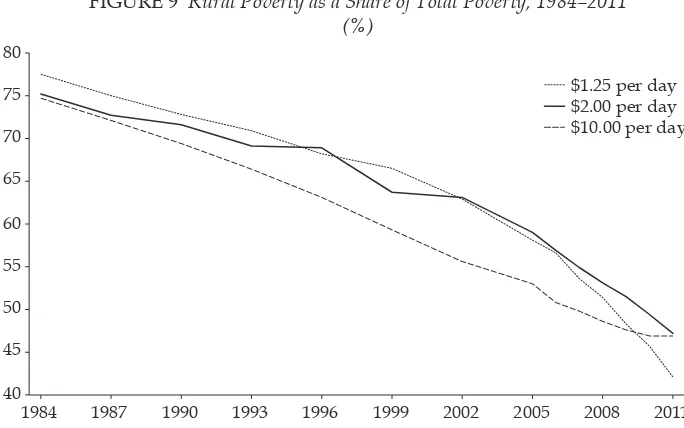
Figure 9 shows the urban–rural proportions of total poverty. The rural com -ponent of total poverty by each poverty line is falling drastically, and poverty by international poverty lines is far more urbanised than by the national poverty line. Rather than two-thirds of the poor being rural, less than half of the poor in Indonesia are rural according to international poverty lines. Such poverty lines are commonly thought to underestimate urban poverty, owing to urban–rural price differentials and the presence of items that urban dwellers pay for that rural dwellers may not pay for (Mitlin and Satterthwaite 2002; Satterthwaite 2004).
However, the data collected for PPPs and prices in Indonesia may have a strong
urban bias, in that the International Comparison Program’s PPP and Indonesian government’s CPI data are typically collected in urban areas. Thus the indings
here should be treated with caution, and further exploration is needed on the impact of PPP and price data in Indonesia on the urbanisation of poverty before
making deinitive conclusions.
15. For an estimate of $10.00-per-day poverty, we could add an amount for income tax and household savings and increase this in line with the NA-to-survey ratio (which in 2010 was about 2.2 for Indonesia) to allow for consumption that is not captured in surveys.
FIGURE 9 Rural Poverty as a Share of Total Poverty, 1984–2011 (%)
1984 1987 1990 1993 1996 1999 2002 2005 2008 2011
40 45 50 55 60 65 70 75 80
$1.25 per day $2.00 per day $10.00 per day
Source: Authors’ estimates derived from Growth, Inequality, and Poverty (GrIP) model v.1.0, described in detail by Edward and Sumner (2013a, 2013b, 2014).
CONCLUSION
Indonesia experienced rapid economic development and poverty reduction dur-ing 1984–2011. So what do analyses of past and forecast future patterns of Indo-nesia’s growth, inequality, and poverty using international PPP poverty lines tell
us? First, that Indonesia could become a high-income country by 2030. Yet past
growth rates would probably err towards caution on this matter as would the
experience of OECD countries where growth slowed at higher levels of GDP per
capita. Second, that Indonesia could end $1.25-per-day and $2.00-per-day poverty
by 2030 if economic growth meets the IMF’s WEO forecasts and if distribution
moves to lowest inequality. Again, current and past trends suggest that this is very optimistic and growth would need to be accompanied by falling inequality from current levels. Another way of looking at this is that the opportunity cost of current inequality trends is an extra 10–20 years of $2.00 poverty in Indonesia. Third, that much of the population will continue to live at levels between
day-to-day $2.00 poverty and security from poverty (deined here as the $10.00-per-day-to-day line) for some time to come. Fourth, that poverty measured by international pov -erty lines seems to be far more urban compared to measurement by the national poverty line and on a steep curve to a greater urban proportion of poverty though this needs further exploration.
How different from the national poverty line are our indings using interna -tional poverty lines? In this article, we reviewed studies of trends in expenditure poverty, of the relation over time between expenditure poverty and economic
growth, and of trends in inequality. On the irst trend, we noted that much research
using national poverty lines—meaning non-PPP lines—concludes that absolute poverty declined during the Soeharto era. Yet poverty was still a problem in the
lead-up to the 1997–98 inancial crisis, and it may have been underestimated. Fur -ther, welfare improvements slowed in the aftermath of the crisis. Using consistent
international poverty lines of $1.25 and $2.00 (the irst of which is close now to the national poverty line), we ind that $1.25-per-day poverty declined greatly during
the Soeharto era. The substantial decline of $2.00-per-day poverty seems to date largely from the post-Soeharto era, and the $10.00-per-day poverty count appears to have changed surprisingly little in 25 years. It is true that poverty was at high levels even before the 1997–98 crisis (more than 40% of the population lived below
the $1.25-per-day poverty line and 80% below the $2.00-per-day line). We ind
that the rate of poverty reduction by $1.25 per day and $2.00 per day was
particu-larly fast in 2000–2005—faster than it was before the crisis—which may relect the
range of social programs introduced or extended after the crisis. However, that rate of poverty reduction has slowed since the rice-price-induced poverty spike in 2005–6, notably for the $1.25 poverty count and somewhat notably for the $2.00 poverty count.
In studies of the relation between expenditure poverty and economic growth, we noted that research based on national poverty lines found that, overall,
eco-nomic growth in Indonesia has beneited the poor. We ind that the beneits of
growth to those under the $2.00-per-day line have been substantial during 1984–
2011. Economic growth appears to have beneited the poor considerably— using
the $1.25 or $2.00 poverty lines—and overall growth has been reasonably broad-based at the lower end of the distribution, even though the rich have gained most.
Some studies of trends in inequality have found that inequality was relatively low or declining in the lead-up to the 1997–98 crisis, and that inequality did not
increase drastically as a result of economic growth. Others have found that
ine-quality was high or increasing before the crisis. Further, many have noted that inequality has increased since the crisis. We ind that total inequality (measured by the Gini coeficient or expenditure deciles) fell in the early 1990s (although this
masked rising urban inequality, because it was rural inequality that fell substan-tially). Since the crisis, however, inequality has risen. This is potentially alarming; rising inequality could slow not only poverty reduction but also the rate and lon-gevity of future economic growth.
In conclusion, we ind that using international poverty lines, which are compa -rable across countries in PPP terms, to analyse the evolution of poverty in Indo-nesia complements analyses based on the national poverty line. Our projections, which should be taken cautiously as illustrations of what is possible and not as predictions, show the extent to which poverty reduction in Indonesia is feasible and the potential opportunity cost of rising inequality.
REFERENCES
Akita, Takahiro. 2002. ‘Regional Income Inequality in Indonesia and the Initial Impact of the Economic Crisis’. Bulletin of Indonesian Economic Studies 38 (2): 201–22.
Akita, Takahiro, Puji Agus Kurniawan, and Sachiko Miyata. 2011. ‘Structural Changes and Regional Income Inequality in Indonesia: A Bidimensional Decomposition Analysis’. Asian Economic Journal 25: 55–77.
Akita, Takahiro, and Sachiko Miyata. 2008. ‘Urbanization, Educational Expansion, and Expenditure Inequality in Indonesia in 1996, 1999, and 2002’. Journal of the Asia Paciic Economy 13 (2): 147–67.
Aldenhoff, Frank-Oliver. 2007. ‘Are Economic Forecasts of the International Monetary Fund Politically Biased? A Public Choice Analysis’. Review of International Organizations 2 (3): 239–60.
Asra, Abuzar. 2000. ‘Poverty and Inequality in Indonesia: Estimates, Decomposition and Key Issues’. Journal of the Asia Paciic Economy 51 (1–2): 91–111.
Baliscan, Arsenio M., Ernesto M. Pernia, and Abuzar Asra. 2010. ‘Revisiting Growth and Poverty Reduction in Indonesia: What Do Subnational Data Show?’. Bulletin of Indone-sian Economic Studies 39 (3): 329–51.
Berg, Andrew G. and Jonathan D. Ostry. 2011. ‘Inequality and Unsustainable Growth: Two Sides of the Same Coin?’. IMF Staff Discussion Note. Washington DC: International Monetary Fund.
Birdsall, Nancy, Nora Lustig, and Christian J. Meyer. 2013. ‘The Strugglers: The New Poor in Latin America’. CGD Working Paper 337. Washington DC: Center for Global Devel -opment.
Booth, Anne. 1999. ‘Initial Conditions and Miraculous Growth: Why is South East Asia Dif -ferent from Taiwan and South Korea?’ World Development 27 (2): 301–21.
Booth, Anne. 2000. ‘Poverty and Inequality in the Soeharto Era: An Assessment’. Bulletin of Indonesian Economic Studies 36 (1), 73–104.
Commission on Growth and Development (2008) The Growth Report: Strategies for Sus -tained Growth And Inclusive Development. Washington DC: World Bank.
Cornia, Giovanni Andrea, Tony Addison, and Sampsa Kiiski. 2004. ‘Income Distribution Changes and Their Impact in the Post–Second World War Period’. In Inequality, Growth, and Poverty in an Era of Liberalization and Globalization, edited by Giovanni Andrea Cor -nia. Oxford: Oxford University Press.
Dartanto, Teguh, and Nurkholis. 2013. ‘The Determinants of Poverty Dynamics in Indo-nesia: Evidence from Panel Data’. Bulletin of Indonesian Economic Studies 49 (1): 61–84. Dhanani, Shaiq, and Iyanatul Islam. 2002. ‘Poverty, Vulnerability and Social Protection in
a Period of Crisis: The Case of Indonesia’. World Development 30 (7): 1211–31.
Easterly, William. 2005. Inequality Does Cause Underdevelopment. Washington DC: Center for Global Development.
Edward, Peter. 2006. ‘Examining Inequality: Who Really Beneits from Global Growth?’.
World Development, 34 (10): 1667–95.
Edward, Peter, and Andy Sumner. 2013a. ‘The Future of Global Poverty in a Multi-Speed World: New Estimates of Scale and Location, 2010–2030’. Working Paper 327. Washing-ton DC: Center for Global Development.
Edward, Peter, and Andy Sumner. 2013b. ‘The Poor, the Prosperous and the “Inbetween-ers”: A Fresh Perspective on Global Society, Inequality and Growth’. IPC-IG Working Paper 122. Brasília: International Policy Centre for Inclusive Growth.
Edward, Peter, and Andy Sumner. 2014. ‘Estimating the Scale and Geography of Global Poverty Now and in the Future: How Much Difference Do Method and Assumptions Make?’ World Development 58: 67–82.
Fane, George, and Peter Warr. 2002. ‘How Economic Growth Reduces Poverty: A General Equilibrium Analysis for Indonesia’. UNU-WIDER Discussion Paper 2002/19. Hel-sinki: United Nations University World Institute for Development Economics Research. Frankema, Ewout, and Daan Marks. 2009. ‘Was It Really “Growth with Equity” under
Soeharto? A Theil Analysis of Indonesian Income Inequality, 1961–2002’. Economics and Finance in Indonesia 57 (1): 47–76.
Friedman, Jed. 2005. How Responsive Is Poverty to Growth? A Regional Analysis of Pov -erty, Inequality and Growth in Indonesia, 1984–1999’. UNU-WIDER Discussion Paper 2003/57. Helsinki: United Nations University World Institute for Development Eco-nomics Research.
Friedman, Jed, and James Levinsohn. 2002. ‘The Distributional Impacts of Indonesia’s Financial Crisis on Household Welfare: A “Rapid Response” Methodology’. The World Bank Economic Review 16 (3): 397–423.
Hill, Hal. 2008. ‘Globalization, Inequality, and Local-Level Dynamics: Indonesia and the Philippines’. Asian Economic Policy Review 3 (1): 42–61.
Hill, Hal, Budy P. Resosudarmo, and Yogi Vidyattama. 2008. ‘Indonesia’s Changing Eco -nomic Geography’. Bulletin of Indonesian Economic Studies 44 (3): 407–35.
Karver, Jonathan, Charles Kenny, and Andy Sumner 2012. ‘MDGs 2.0: What Goals, Targets, and Timeframe?’. Working Paper 297. Washington DC: Center for Global Development. Lanjouw, Peter, Menno Pradhan, Fadia Saadah, Haneen Sayed, and Robert Sparrow. 2001.
‘Poverty, Education and Health in Indonesia: Who Beneits from Public Spending?’. World Bank Policy Research Working Paper 2739. Washington DC: World Bank. Leigh, Andrew, and Pierre van der Eng. 2010. ‘Inequality in Indonesia: What Can We Learn
from Top Incomes?’. Journal of Public Economics 93 (1–2): 209–12.
López-Calva, Luis F., and Eduardo Ortiz-Juarez. 2011. ‘A Vulnerability Approach to the Deinition of the Middle Class’. Policy Research Working Paper 5902. World Bank, Washington, DC.
McCulloch, Neil. 2008. ‘Rice Prices and Poverty in Indonesia’. Bulletin of Indonesian Eco-nomic Studies. 44 (1): 45–63.
McCulloch, Neil, and Amit Grover. 2010. ‘Estimating the National Impact of the Financial Crisis in Indonesia by Combining a Rapid Qualitative Study with Nationally Repre -sentative Surveys’. IDS Working Paper. Brighton: Institute of Development Studies. McDonald, Peter. 2014. ‘A Population Projection for Indonesia, 2010–2035’. Bulletin of
Indo-nesian Economic Studies 50 (1): 123–29.
Mitlin, Diana, and David Satterthwaite. 2002. ‘How the Scale and Nature of Urban Poverty Are Under-Estimated—The Limitations of the US$1 a Day Poverty Line’. Paper presented at the World Bank’s Urban Research Symposium, Washington DC, 9–11 December. Nugraha, Kunta, and Phil Lewis. 2013. ‘Towards a Better Measure of Income Inequality in
Indonesia’. Bulletin of Indonesian Economic Studies 49 (1): 103–12.
Pradhan, Menno, Asep Suryahadi, Sudarno Sumarto, and Lant Pritchett. 2001. ‘Eating Like Which “Joneses?” An Iterative Solution to the Choice of a Poverty Line “Reference Group”’. Review of Income and Wealth 47 (4): 473–87.
Ravallion, Martin, and Michael Lokshin. 2007. ‘Lasting Impacts of Indonesia’s Financial Crisis’. Economic Development and Cultural Change 56 (1): 27–56.
Ravallion, Martin. 2010. ‘The Developing World’s Bulging (but Vulnerable) Middle Class’.
World Development 38 (4): 445–54.
———. 2012. ‘Benchmarking Global Poverty Reduction’. Policy Research Working Paper 6205. Washington DC: World Bank.
Satterthwaite, David. 2004. ‘The Under-Estimation of Urban Poverty in Low and Middle-Income Nations’. IIED Poverty Reduction in Urban Areas Series Working Paper 14. London: International Institute for Environment and Development .
Skouias, Emmanuel. 2001. ‘Changes in Regional Inequality and Social Welfare in Indone -sia from 1996 to 1999’. Journal of International Development 13 (1): 73–91.
Skouias, Emmanuel, Asep Suryahadi, and Sudarno Sumarto. 2000. ‘Changes in House -hold Welfare, Poverty and Inequality during the Crisis’. Bulletin of Indonesian Economic Studies 36 (2): 97–114.
Sumner, Andy, and Peter Edward. 2013. ‘From Low Income, High Poverty to High Income, No Poverty? An Optimistic View of the Long-Run Evolution of Poverty in Indonesia by International Poverty Lines, 1984–2030’. Working Paper in Economics and Develop-ment Studies 201310. Bandung: DepartDevelop-ment of Economics, Padjadjaran University. Sumner, Andy, Asep Suryahadi, and Nguyen Thang. 2012. ‘Poverty and Inequalities in
Middle-Income Southeast Asia’. IDS Working Paper. Brighton: Institute of Develop-ment Studies.
Suryadarma, Daniel, Rima Prama Artha, Asep Suryahadi, and Sudarno Sumarto. 2005. ‘A Reassessment of Inequality and Its Role in Poverty Reduction in Indonesia’. SMERU Working Paper. Jakarta: SMERU Research Institute.
Suryadarma, Daniel, Wenefrida Widyanti, Asep Suryahadi, and Sudarno Sumarto. 2006. ‘From Access to Income: Regional and Ethnic Inequality in Indonesia’. SMERU Work -ing Paper. Jakarta: SMERU Research Institute.
Suryahadi, Asep, Gracia Hadiwidjaja, and Sudarno Sumarto. 2012. ‘Economic Growth and Poverty Reduction in Indonesia before and after the Asian Financial Crisis’. Bulletin of Indonesian Economic Studies 48 (2): 209–27.
Suryahadi, Asep, and Sudarno Sumarto. 2003a. ‘Poverty and Vulnerability in Indonesia before and after the Economic Crisis’. Asian Economic Journal 17 (1): 45–64.
Suryahadi, Asep, and Sudarno Sumarto. 2003b. ‘The Evolution of Poverty during the Crisis in Indonesia’. SMERU Working Paper. Jakarta: SMERU Research Institute.
Suryahadi, Asep, Daniel Suryadarma, and Sudarno Sumarto. 2006. ‘Economic Growth and Poverty Reduction in Indonesia: The Effects of Location and Sectoral Components of Growth’. SMERU Working Paper. Jakarta: SMERU Research Institute.
Suryahadi, Asep, Umbu Reku Raya, Deswanto Marbun, and Athia Yumna. 2012. ‘Accel-erating Poverty and Vulnerability Reduction: Trends, Opportunities, and Constraints’. SMERU Working Paper. Jakarta: SMERU Research Institute.
Timmer, C. Peter. 2004. ‘The Road to Pro-Poor Growth: The Indonesian Experience in Regional Perspective’. Bulletin of Indonesian Economic Studies 40 (2): 177–207.
Van der Eng, Pierre. 2009. ‘Growth and Inequality: The Case of Indonesia, 1960–1997’. MPRA Paper 12725. Munich: Munich Personal RePEc Archive.
Van Leeuwen, Bas, and Peter Foldvari. 2011. The Development of Inequality and Poverty in Indonesia, 1932–1999. CGEH Working Paper 26. Utrecht: Centre for Global Economic History, Utrecht University.
World Bank. 2014. Indonesia Economic Quarterly: Investment in Flux. Jakarta: World Bank. Yusuf, Arief Anshory, Andy Sumner, and Irlan Adiyatma Rum. 2014. ‘Twenty Years of
Expenditure Inequality in Indonesia, 1993–2013’. Bulletin of Indonesian Economic Studies 50 (2): 243–54.
APPENDIX TABLE A1 Headcount (millions) and Total Poverty Gap (PPP 2005 $ billion), by International Poverty Lines, 1984–2011
1984 1987 1990 1993 1996 1999 2002 2005 2006 2007 2008 2009 2010 2011
Rural Headcount
$1.25 79.0 88.1 71.6 73.6 59.2 65.8 40.2 28.9 37.4 30.1 27.3 23.8 19.7 17.3
$2.00 108.3 112.6 111.4 112.4 108.9 108.8 92.0 71.0 82.4 70.1 66.8 63.3 53.7 49.6 $10.00 123.0 126.0 127.9 128.5 127.7 124.9 121.7 118.0 116.7 115.4 114.0 112.6 111.1 109.7 Population 123.0 126.0 127.9 128.5 127.7 124.9 121.7 118.0 116.7 115.4 114.0 112.6 111.1 109.7 Total poverty gap
$1.25 12.3 13.4 9.3 9.5 6.9 8.0 3.7 2.7 4.0 2.8 2.4 1.9 1.5 1.2
$2.00 39.6 42.5 36.0 36.8 30.7 33.6 22.3 16.7 20.8 16.9 15.6 14.1 11.7 10.5
$10.00 394.7 407.2 404.6 407.4 395.2 393.7 367.2 341.5 348.6 334.1 327.8 320.8 304.3 291.3 Urban
Headcount
$1.25 22.9 29.5 26.7 30.2 27.6 33.2 23.7 20.9 28.6 26.1 25.9 25.5 23.5 23.8
$2.00 35.7 42.2 44.1 50.2 49.2 62.0 53.7 49.4 62.3 57.7 59.1 59.8 55.1 55.4
$10.00 41.7 48.8 56.4 65.0 74.6 85.8 97.3 104.7 113.2 116.5 120.5 123.8 125.7 124.1 Population 41.7 48.8 56.4 65.0 74.6 85.8 97.3 109.3 113.2 117.0 120.9 124.8 128.8 132.7 Total poverty gap
$1.25 3.6 4.8 3.7 4.2 3.6 4.0 2.2 1.9 3.0 2.6 2.6 2.4 2.1 2.1
$2.00 11.9 15.1 13.6 15.3 14.4 17.3 13.1 11.7 15.7 14.2 14.3 14.2 13.0 13.1
$10.00 130.6 154.7 172.0 197.3 217.4 254.3 271.8 283.8 315.7 313.9 324.9 332.8 330.2 331.6 Total
Headcount
$1.25 101.9 117.6 98.3 103.8 86.8 99.0 63.9 49.8 66.0 56.2 53.2 49.2 43.2 41.1 $2.00 144.0 154.8 155.5 162.6 158.1 170.7 145.7 120.4 144.7 127.8 125.8 123.1 108.7 104.9 $10.00 164.7 174.8 184.3 193.5 202.3 210.6 219.0 222.7 229.9 231.9 234.5 236.4 236.8 233.7 Population 164.7 174.8 184.3 193.5 202.3 210.6 219.0 227.3 229.9 232.5 235.0 237.4 239.9 242.3 Total poverty gap
$1.25 15.9 18.2 13.1 13.7 10.5 12.0 6.0 4.6 7.0 5.4 5.0 4.4 3.6 3.2
$2.00 51.5 57.6 49.6 52.1 45.0 50.9 35.4 28.3 36.5 31.1 29.9 28.3 24.7 23.6
$10.00 525.2 562.0 576.6 604.6 612.6 648.0 639.0 625.3 664.3 648.0 652.7 653.6 634.4 622.9
Source: Authors’ estimates derived from Growth, Inequality, and Poverty (GrIP) model v.1.0, described in detail by Edward and Sumner (2013a, 2013b, 2014).