Full Terms & Conditions of access and use can be found at
http://www.tandfonline.com/action/journalInformation?journalCode=vjeb20
Download by: [Universitas Maritim Raja Ali Haji] Date: 11 January 2016, At: 20:31
Journal of Education for Business
ISSN: 0883-2323 (Print) 1940-3356 (Online) Journal homepage: http://www.tandfonline.com/loi/vjeb20
Incorporating Multiple-Choice Questions Into
an AACSB Assurance of Learning Process: A
Course-Embedded Assessment Application to an
Introductory Finance Course
Michael R. Santos , Aidong Hu & Douglas Jordan
To cite this article: Michael R. Santos , Aidong Hu & Douglas Jordan (2014) Incorporating Multiple-Choice Questions Into an AACSB Assurance of Learning Process: A Course-Embedded Assessment Application to an Introductory Finance Course, Journal of Education for Business, 89:2, 71-76, DOI: 10.1080/08832323.2012.757542
To link to this article: http://dx.doi.org/10.1080/08832323.2012.757542
Published online: 17 Jan 2014.
Submit your article to this journal
Article views: 82
View related articles
ISSN: 0883-2323 print / 1940-3356 online DOI: 10.1080/08832323.2012.757542
Incorporating Multiple-Choice Questions Into an
AACSB Assurance of Learning Process: A
Course-Embedded Assessment Application
to an Introductory Finance Course
Michael R. Santos, Aidong Hu, and Douglas Jordan
Sonoma State University, Rohnert Park, California, USA
The authors offer a classification technique to make a quantitative skills rubric more opera-tional, with the groupings of multiple-choice questions to match the student learning levels in knowledge, calculation, quantitative reasoning, and analysis. The authors applied this classifi-cation technique to the mid-term exams of an introductory finance course in six sections, with 191 junior and senior business students using a course-embedded assessment methodology and a regional test in California revealing that there were shortcomings in our teachings of financial facts and concepts.
Keywords:AACSB, Business Assessment Test, Bloom’s taxonomy, course-embedded assess-ment, quantitative skills rubric
Increasingly, business schools around the world see Associ-ation to Advance Collegiate Schools of Business (AACSB) accreditation as one of the most desirable qualifications. The AASCB accreditation standards (AACSB, 2012) specify the course-embedded assessment (CEA) as one of the direct as-sessment methods in student learning. It is well known in the academic circles that the type of assessment methodol-ogy greatly affects faculty participation. CEA may be more appealing to faculty because it uses existing course mate-rial; assignments, exams, projects, cases, and other course activities. Other benefits are also reported in the literature by Ammons and Mills (2005), Cross and Angelo (1998), and McConnell, Hoover, and Miller (2008) as being less intrusive and helpful to curriculum revisions by supporting program and course level assessments with quick feedback.
This method has been applied to general education fields (Gerretson & Golson, 1994, 2005) and business disciplines in accounting (Herring & Izard, 1992), management, infor-mation systems (Kerby & Romine, 2010; Manton & En-glish, 2002), and marketing (LaFleur, Babin, & Lopez, 2009). Despite having many invaluable papers in the literature, there
Correspondence should be addressed to Michael R. Santos, Sonoma State University, School of Business and Economics, 1801 Cotati Avenue, Stevenson 2026D, Rohnert Park, CA 94928, USA. E-mail: [email protected]
is no published article explicitly showing how to classify multiple-choice questions to match learning levels of a rubric aligned with Bloom’s taxonomy (Bloom, 1956). We believe that the technique presented in this paper uncovers a great potential for the CEA method to become the prevalent as-sessment tool for the AACSB asas-sessment practices because the multiple-choice questions are widely used and easy to score with scantrons.
The motivation of our article is to show how to group multiple-choice questions to match various learning levels of a quantitative skills rubric used in an introductory finance course. Thus, other finance faculty can apply to their own rubrics. Additionally, we share a finding of our CEA ap-plication revealing structural problems in our teaching that otherwise may go unnoticed. Furthermore, we linked our course embedded application to a regional general test in California similar to the study of Barboza and Pesek (2012). Both applications showed that our student learning skills for financial knowledge was inadequate.
Our target audience is the assessment managers and as-surance of learning leaders as well as faculty members who are asked to assess their classes using a specific rubric in the business schools for the qualification and maintenance of the AACSB accreditation. Because the assessment appli-cations require continuous technical and monetary support, the selected assessment methodology must be sustainable in
72 M. R. SANTOS ET AL.
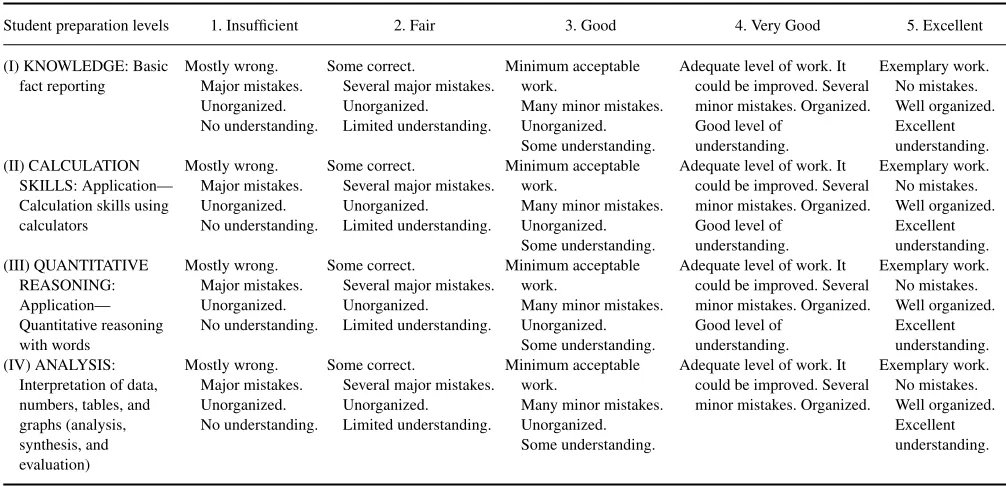
TABLE 1
Quantitative Skills Assessment Rubric
Student preparation levels 1. Insufficient 2. Fair 3. Good 4. Very Good 5. Excellent
(I) KNOWLEDGE: Basic
Adequate level of work. It could be improved. Several minor mistakes. Organized.
Adequate level of work. It could be improved. Several minor mistakes. Organized.
Adequate level of work. It could be improved. Several minor mistakes. Organized.
Adequate level of work. It could be improved. Several minor mistakes. Organized.
Note.Our assessment did not include the (IV) analysis level for this cycle.
terms of its simplicity, cost, and applicability. Our classifi-cation technique for the multiple-choice questions applied to a course-embedded method satisfies all these desirable properties.
THE HISTORY OF ASSESSMENT PRACTICES AT THE BUSINESS DEPARTMENT
Before the course-embedded assessment application, the business department hired a private firm to score student achievement based on course assignments, projects, and cases. Also, the same firm provided technical assistance to assure uniformity of assessment applications in the areas of accounting, finance, management, marketing, information systems, and wine business strategies. After two years of col-lecting and transferring data to the firm, the business faculty members were not satisfied with the quality of the assess-ment reports by the firm. In addition, the costly annual fees and low faculty participation in the assessment process raised questions about the sustainability of this process, and finally the faculty decided to end the practice.
Our course-embedded approach is a pilot project to ex-plore if the methodology can be applied successfully in finance area before it can be extended to other courses and concentration areas. Our finance faculty members believe this methodology has the following advantages: (a) cheap; (b) easy to apply any course through exams, assignments, and cases; (c) can be easily scored with
scantrons; and (d) maximizes faculty participation in the assessment.
THE LEARNING GOAL AND THE QUANTITATIVE SKILLS RUBRIC
At our business department, the learning goal for quantita-tive skills at the program level is: Students will demonstrate critical thinking skills in identifying, evaluating, and provid-ing solutions to problems and opportunities in the business environment.
After the consultation with the assurance of learning man-ager, the business faculty from all areas revised the quanti-tative skills rubric based on Bloom’s taxonomy. The rubric is shown in Table 1, and vertically shows that there are four learning skill levels ranked from lowest to highest as (I) knowledge, (II) calculation, (III) quantitative reasoning, and (IV) analysis. The first level, knowledge, measures basic facts and concepts of financial statements, markets, tools, and the-ories, and answering knowledge type of questions do not require any analysis or calculation. The second skill level, calculation, measures application skills of students using a financial calculator. The third level, quantitative reason-ing, measures problem-solving skills of students based on abstract statements of numbers, relationships, logical state-ments, and financial theories. Similar to the knowledge ques-tions, answering quantitative reasoning questions do not usu-ally require a calculator. The fourth, analysis, is the highest in the skill set and measures students’ understanding and
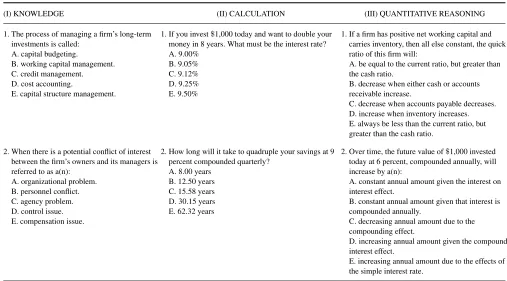
TABLE 2
Examples of Multiple-Choice Questions to Three Levels of Quantitative Skills Rubric
(I) KNOWLEDGE (II) CALCULATION (III) QUANTITATIVE REASONING
1. The process of managing a firm’s long-term investments is called:
A. capital budgeting.
B. working capital management. C. credit management. D. cost accounting.
E. capital structure management.
1. If you invest$1,000 today and want to double your money in 8 years. What must be the interest rate? A. 9.00%
B. 9.05% C. 9.12% D. 9.25% E. 9.50%
1. If a firm has positive net working capital and carries inventory, then all else constant, the quick ratio of this firm will:
A. be equal to the current ratio, but greater than the cash ratio.
B. decrease when either cash or accounts receivable increase.
C. decrease when accounts payable decreases. D. increase when inventory increases. E. always be less than the current ratio, but greater than the cash ratio.
2. When there is a potential conflict of interest between the firm’s owners and its managers is referred to as a(n):
A. organizational problem. B. personnel conflict. C. agency problem. D. control issue. E. compensation issue.
2. How long will it take to quadruple your savings at 9 percent compounded quarterly?
2. Over time, the future value of$1,000 invested today at 6 percent, compounded annually, will increase by a(n):
A. constant annual amount given the interest on interest effect.
B. constant annual amount given that interest is compounded annually.
C. decreasing annual amount due to the compounding effect.
D. increasing annual amount given the compound interest effect.
E. increasing annual amount due to the effects of the simple interest rate.
interpretation of data from tables or graphs. In our original quantitative skills rubric, we had six levels of learning skills, knowledge, comprehension, application, analysis, synthesis, and evaluation, due to our desire to match the exact learn-ing levels specified in the Bloom’s taxonomy. However, after obtaining the assessment results from the private firm, we observed many overlapping results for comprehension and knowledge skills as well as the analysis, synthesis, and eval-uation skills. In short, we were not able to separate more refined levels of learning in our assessment. Therefore, we, the faculty, decided to reduce our rubric to have only four learning levels to make our rubric assessable.
Our current rubric horizontally shows that there are five performance levels for each type of quantitative skills rang-ing from lowest to the highest described as (a) insufficient (mostly wrong, major mistakes, unorganized, and no un-derstanding), (b) fair (some correct answers, several major mistakes, being unorganized, and limited understanding), (c) good (minimum acceptable work, many minor mistakes, un-organized, and some understanding), (d) very good (adequate level of work, it could be improved, several minor mistakes, organized, and good level of understanding), and (e) excellent (exemplary work, no mistakes, well organized, and excellent understanding).
After the assurance manager’s consultations with the busi-ness faculty in our school, there was a desire to synchronize the lowest student achievement level with our syllabuses. A quick survey of the syllabuses in all concentration ar-eas showed that a 60% student achievement corresponding
to a passing grade of D was accepted by all faculty mem-bers. Therefore, a score of 3 was accepted as satisfactory (good) specifying that “minimum acceptable work for a stu-dent should have minor mistakes perhaps it is unorganized but demonstrating that some understanding of the work is provided.”
CLASSIFICATION OF MULTIPLE CHOICE QUESTIONS TO MATCH LEARNING
LEVELS OF THE RUBRIC
In Table 2, we classify two multiple-choice questions in each category to match the corresponding skill levels of knowl-edge, calculation, quantitative reasoning. The first column of Table 2 has two questions about capital budgeting and agency problems, and these questions can be answered eas-ily from memory without requiring any calculation or in-debt analysis. In the second column of Table 2, the examples for calculation type of questions are about time value of money concepts. Here, students will need a financial calcu-lator to solve both questions. Finally, the last column has the quantitative reasoning type of examples about ratio analysis and time value of money and these questions can be solved with abstract thinking without a calculator.
Even though we did not include analysis type of questions in our own assessment, we provide two sample questions in Table 3. With the analysis type of questions, the students may interpret data from tables or graphs and process more
74 M. R. SANTOS ET AL.
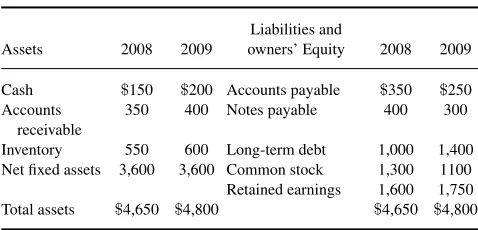
TABLE 3
Examples to Analysis Type of Multiple-Choice Questions
Assets 2008 2009
Liabilities and
owners’ Equity 2008 2009
Cash $150 $200 Accounts payable $350 $250 Accounts
receivable
350 400 Notes payable 400 300
Inventory 550 600 Long-term debt 1,000 1,400 Net fixed assets 3,600 3,600 Common stock 1,300 1100 Retained earnings 1,600 1,750 Total assets $4,650 $4,800 $4,650 $4,800
Note.The students were instructed answer questions 1 and 2 by using the following financial statements for years 2008 and 2009:
Example: Telus Corporation Balance Sheets (December 31, 2008 and 2009)
1. Which of the following statement is incorrect? A.$100 as source of cash from notes payables B.$50 as source of cash from account receivables C.$200 as source of cash from common stock D.$100 as use of cash from accounts payable E. none of the above
2. Which of the following statement would best describe Telus Corpo-ration’s debt levels if the industry average for total debt ratio was 45% for year 2008?
A. Good because it is slightly above the industry average B. Bad because it is slightly below the industry average C. Ok because it is below the industry average
D. Unacceptable because it is below the optimum debt level E. None of the above
information. In the design of an analysis type of question, perhaps several multiple-choice questions may be used for the same table or graph. For example, both sample questions use the same financial statements (balance sheets) for years 2008 and 2009 in Table 3.
APPLICATION OF CEA AND THE FINDINGS
In our CEA application, we used 30 multiple-choice ques-tions during our midterm exams with each learning skill having 10 questions assigned to in knowledge, calculation, and quantitative reasoning, similar to the examples shown on Table 2. After administering the midterm exams and ob-taining results by using scantrons, we scored performance levels of each skill area by using a schedule where 0–2 cor-rect answers=1 point (insufficient), 3–4 correct answers= 2 points (fair), 4–5 correct answers=3 points (good), 6–7 correct answers=4 points (very good), and 8–10 correct an-swers=5 points (excellent). Our scoring results are shown in Table 4 where we recorded each student’s score separately in knowledge, in calculation, and in quantitative reasoning.
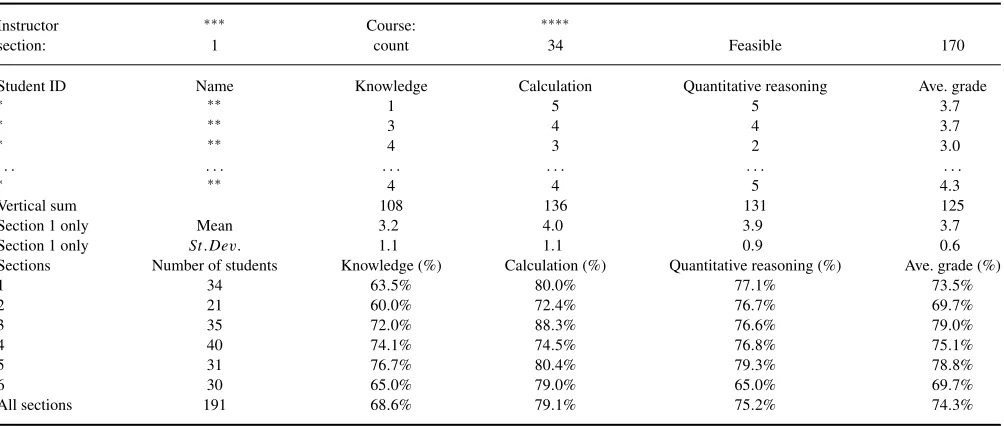
Table 4 shows the scores of 34 students from Section 1 recorded in an Excel spreadsheet. We found that the average performance for Section 1 was 63.5% in knowledge, 80.0% in calculation, and 77.1% in quantitative reasoning.
In Table 4, we sum all the students’ individual scores ver-tically in each skill level by using the =SUM(.) function, and generate a row of vertical sums. For Section 1, these vertical sums are 108, 136, and 131, respectively. To find the percentage achievement in each skill level, first find the highest feasible number for all students in the class achiev-ing collectively as (5 points×34 students) 170. Then, divide each vertical sum number with the feasible score of 170, and generate percentage achievements in each skill area as 108/170=63.5% in knowledge, 136/170=80.0% in cal-culation, and 131/170 =77.1% in quantitative reasoning. Additionally, if desired, use the Excel spreadsheet functions of =AVERAGE(.) and STDEV(.) to generate the sample means and standard deviations for each skill area.
Last, Table 5 shows the aggregated results from all six sections with 191 junior and senior students participated in the assessment. On the average, the introductory finance stu-dents achieved 68.6% in knowledge, 79.1% in calculation, and 75.2% in quantitative reasoning. Even though the over-all results are satisfactory, the lowest performance level of 68.6% in knowledge skill area is unsettling to us because we consider knowledge to be at the lowest level of Bloom’s taxonomy. This finding is in line with our intensive focus of calculation applications but requires our school to improve the instruction of financial knowledge.
Additionally, our finance students scored poorly in the regional test in comparison to the students from five other California state schools. Using the classification technique described in this paper, we grouped finance multiple-choice questions of this test, and identified that the regional test in-cluded disproportionately high number of knowledge ques-tions in comparison with that of calculation and quantitative reasoning types of questions. This further confirms that our teaching of financial knowledge was inadequate. Because we spend more time solving questions with calculators and less time on teaching financial facts and concepts, this outcome was perhaps fair but undesirable. Due to our own experience, we caution other finance instructors to balance their teaching times between financial facts and concepts, and calculations.
EXTERNAL ASSESSMENT BY THE BUSINESS ASSESSMENT TEST
In a recent article, Barboza and Pesek (2012) linked the implementation of CEA to an external test, called the Major Field Test in Business (MFT-B; Educational Testing Service, 2013) and found that their students achieved higher scores at MFT-B due the assessment applications in their courses.
Similar to Johnson (2012), we also linked our method-ology to a general regional test, called the Business Assess-ment Test (BAT), administered by California State University (CSU), and there were 6 CSU campuses participating in the test. The test had 80 multiple-choice questions from busi-ness fields of accounting, busibusi-ness law, finance, information
TABLE 4
A Sample Application in Excel Worksheet and the Summary of Findings
Instructor ∗∗∗ Course: ∗∗∗∗
section: 1 count 34 Feasible 170
Student ID Name Knowledge Calculation Quantitative reasoning Ave. grade
∗ ∗∗ 1 5 5 3.7
∗ ∗∗ 3 4 4 3.7
∗ ∗∗ 4 3 2 3.0
. . . .
∗ ∗∗ 4 4 5 4.3
Vertical sum 108 136 131 125
Section 1 only Mean 3.2 4.0 3.9 3.7
Section 1 only St .Dev. 1.1 1.1 0.9 0.6
Sections Number of students Knowledge (%) Calculation (%) Quantitative reasoning (%) Ave. grade (%)
1 34 63.5% 80.0% 77.1% 73.5%
2 21 60.0% 72.4% 76.7% 69.7%
3 35 72.0% 88.3% 76.6% 79.0%
4 40 74.1% 74.5% 76.8% 75.1%
5 31 76.7% 80.4% 79.3% 78.8%
6 30 65.0% 79.0% 65.0% 69.7%
All sections 191 68.6% 79.1% 75.2% 74.3%
Note.The scoring schedule was the following: 0–2 correct answers=1, insufficient; 3–4 correct answers=2, fair; 4–5 correct answers=3, good; 6–7 correct answers=4, very good; and 8–10 correct answers=5, excellent.
systems, management, marketing, and statistics. The same group of students who participated at our assessment also took BAT test at the end of the semester and performed poorly with finance questions in comparison with the students from five other CSU campuses. In order to understand better why our students performed so poorly, we analyzed 12 finance multiple-choice questions by classifying them into knowl-edge, calculation, and quantitative reasoning. We found that the BAT exam was heavily skewed toward knowledge type of questions with a 50% weight (six of 12). This confirmed our findings from our own assessment that our students were not well prepared for the financial facts and concepts, and per-haps this result was due to our intensive focus on calculations and financial mathematics.
We shared the assessment findings with our students and asked them what may be the reasons. Many of our students were not surprised with these findings because skimming textbook chapters rather than reading carefully was a general practice among many students. Also, some students observed that the finance instructors (three of us) spent more time on problem solving with calculators and less time on teaching financial concepts and facts, and therefore these students decided to allocate less time on financial facts and concepts.
CLOSING THE LOOP AND CONCLUSIONS
In closing the loop, we presented the course-embedded as-sessment findings to other faculty members in the business department, and made decisions to (a) spend more time on explaining financial facts and concepts during the lectures, (b) improve course syllabuses by writing explicitly the
im-portance of textbook readings to gain financial knowledge, and (c) announce and include all financial facts or concepts covered in the textbook chapters in the exams regardless of those financial concepts or facts being mentioned or covered by the faculty members during lecturing hours.
In conclusion, we hope that the classification technique presented in this article will encourage more faculty members to participate in the AACSB assessment process because multiple-choice questions are widely used in the exams and easily scored with scantrons. Also, the groupings of multiple-choice questions can be applied to other types of rubrics used in accounting, finance, management, marketing, and information systems.
REFERENCES
Ammons, J. L., & Mills, S. K. (2005). Course-embedded assessments for evaluating cross-functional integration and improving the teaching-learning process.Issues in Accounting Education,20, 1–19.
Association to Advance Collegiate Schools of Business. (2012). Eligibil-ity procedures and accreditation standards for business accreditation. Tampa, FL: Author.
Barboza, G. A., & Pesek, J. (2012). Linking course-embedded assessment measures and performance on the Educational Testing Service Major Field Test in Business.Journal of Education for Business,87, 102–111. Bloom, B. S. (1956).Taxonomy of educational objectives, handbook I: The
cognitive domain. New York, NY: David McKay.
Cross, P. K., & Angelo, T. A. (1993).Classroom assessment techniques: A handbook for college teachers(2nd ed.). San Francisco, CA: Jossey-Bass. Education Testing Service. (2013).The ETS Major Field Test. Retrieved
from http://www.ets.org/s/mft/pdf/mft testdesc business 4jmf.pdf Gerretson, H., & Golson, E. (1994). Introducing and evaluating
course-embedded assessment in general education.Assessment Update,16(6), 4–6.
76 M. R. SANTOS ET AL.
Gerretson, H., & Golson, E. (2005). Synopsis of the use of course-embedded assessment in a medium sized public university’s general education program.The Journal of General Education,54, 139–149. Herring, H. C. III, & Izard, C. D. (1992). Outcomes assessment of accounting
majors.Issues in Accounting Education,7, 1–17.
Johnson, L., (2012). Closing the loop: Using assessment results to modify the curriculum so that student quantitative reasoning skills are enhanced. American Journal of Business Education,5, 465–468.
Kerby, D., & Romine, J. (2010). Develop oral presentation skills through accounting curriculum design and course-embedded assessment.Journal of Education for Business,85, 172–179.
LaFleur, E. K., Babin, L. A., & Lopez, T. B. (2009). Assurance of learn-ing for principles of marketlearn-ing students: A longitudinal study of a course-embedded Direct assessment.Journal of Marketing Education, 31, 131–141.
Manton, E. J., & English, D. E. (2002). The college of business and tech-nology’s course embedded student outcomes assessment process.College Student Journal,36, 261–267.
McConnell, C., Hoover, G., & Miller, G. (2008). Course embed-ded assessment and assurance of learning: Examples in business disciplines. Academy of Educational Leadership Journal, 12(3), 19–34.