Full Terms & Conditions of access and use can be found at
http://www.tandfonline.com/action/journalInformation?journalCode=vjeb20
Download by: [Universitas Maritim Raja Ali Haji] Date: 11 January 2016, At: 22:32
Journal of Education for Business
ISSN: 0883-2323 (Print) 1940-3356 (Online) Journal homepage: http://www.tandfonline.com/loi/vjeb20
The Education of a Leader: Educational Credentials
and Other Characteristics of Chief Executive
Officers
Joseph Martelli & Patricia Abels
To cite this article: Joseph Martelli & Patricia Abels (2010) The Education of a Leader: Educational Credentials and Other Characteristics of Chief Executive Officers, Journal of Education for Business, 85:4, 209-217, DOI: 10.1080/08832320903449592
To link to this article: http://dx.doi.org/10.1080/08832320903449592
Published online: 08 Jul 2010.
Submit your article to this journal
Article views: 81
View related articles
ISSN: 0883-2323
DOI: 10.1080/08832320903449592
The Education of a Leader: Educational Credentials
and Other Characteristics of Chief Executive Officers
Joseph Martelli and Patricia Abels
The University of Findlay, Findlay, Ohio, USA
The authors identified and described the CEOs of Fortune 500 companies in terms of several education-related and other demographic variables. Specifically, they identified the type and level of degrees earned, including specific majors, and additionally explored several demo-graphic variables, including age, gender and ethnicity. They also identified trends among CEOs and across industries in order to further understand the educational profile of these leaders. Secondary data covering more than 50 variables and 500 cases were collected from various business-related and research databases.
Keywords: business executive education, CEO demographics, CEO education, leader creden-tials, leader profiles
According to the Bureau of Labor Statistics (2010), top ex-ecutives held nearly two million jobs in the United States in 2008, with over 400,000 incumbents holding the title of Chief Executive Officer (CEO). Many of these top executives hold a bachelor’s or graduate degree in business administra-tion, liberal arts, or even a more specialized discipline. Other executives have no postsecondary degrees. The specific de-grees often depend on the type of organization for which they work. In the present study, we explored the various educa-tional credentials and other demographic factors of Fortune 500 CEOs as reported by Fortune Magazine’s 2008 listing (The 500 largest, 2008). We also identified trends among CEOs and across industries in order to further understand the leadership characteristics of these prominent leaders in North America.
The discussion begins with a review of literature ad-dressing the level of education attained, the types of ma-jors pursued, and the institutions attended by business lead-ers throughout the United States. We subsequently include our methodology, data analysis, results, and discussion for this descriptive research study. Following the discussion ad-dressing the results of our analysis, we address conclusions and suggestions for further research can be found. Overall, we hope to increase readers’ awareness of what it takes to
Correspondence should be addressed to Joseph Martelli, The University of Findlay, College of Business, 1000 N. Main Street, Findlay, OH 45840, USA. E-mail: martelli@findlay.edu
become a successful business leader within these powerful Fortune 500 companies.
LITERATURE REVIEW
Level of Degree(s) Earned by CEOs
In 1976, Fortune Magazine (Burck, 1976) conducted a sta-tistical profile revealing the traits of executives who manage Fortune 500 companies. Their findings revealed that 27.9% of CEOs held an undergraduate degree, 24.1% of CEOs ac-quired a master’s degree, 18.4% attended postgraduate study, and 15.5% advanced in pursuit of their doctorate (Burck). Overall, 85.9% of all CEOs held at minimum an under-graduate degree, with the remaining 13.8% of CEOs having dropped out of college or having a high school diploma or less (0.3% difference due to rounding; Burck).
Chandy’s (1991) research extended the 1976 Fortune ar-ticle by looking at the changes in composition of the CEO 15 years later. CEOs of the era tended to be well educated. For example, over 60% of CEOs surveyed have taken at least one course beyond their undergraduate degree, as compared to only 58% in 1976. Additionally, 66% of CEOs held at least one graduate degree, as compared to 39.6% in 1976.
Educational Major(s) of CEOs
In the earliest of times, management of large firms tended to be the proprietor(s) or founder(s) for organizations. As a
210 J. MARTELLI AND P. ABELS
result, executives with a formal education were not an im-portant factor for success of the enterprise. Successes were accomplished through hard and dedicated work in order to achieve the desired outcome. As the U.S. economy entered the industrial age, professional skills beyond grammar school became important. Companies such as Armstrong Cork, Gen-eral Mills, and U.S. Steel felt that the higher education re-ceived by students should be within the liberal arts versus that of a specialization (Newcomer, 1955). However, other leading organizations of the days were primarily interested in hiring potential employees who had a business admin-istration or engineering degree versus that of a liberal arts degree, which, in turn, led to the decline in the liberal arts (Newcomer).
Fortune Magazine revealed from its research that top ex-ecutives primarily either held an undergraduate (27.9%) or a master’s (24.1%) degree with a shift in emphasis toward legal or business as the parameter for the field of study, followed by engineering and economics (Burck, 1976). The swings in the education pendulum were a result of the changing needs exhibited by organizations as they expanded operations into a global organization. This expansion resulted in a demand for financial planning, which necessitated the acquired foun-dation for skills within business. As a result of globalization, additional government regulations entered the picture, which, in turn, created a demand for those CEOs that could provide legal advice to the organizations.
Chandy’s (1991) research 15 years after the Fortune study showed that at the undergraduate level, 19% of CEOs pos-sessed an engineering degree, whereas 51% of the CEOs had earned degrees within business administration with special-ization in the areas of accounting, finance, and management. Additionally, the CEOs of the survey indicated that for suc-cessful preparation for the CEO position, courses pertaining to general business or the liberal arts would be the most ben-eficial, followed by accounting and finance (Chandy). Those CEOs graduating with advanced degrees primarily majored in business administration (60%), followed by engineering and law (Chandy). In the data gathered by Business Week (1991) for its Corporate Elite, CEOs indicated that in order to climb the corporate ladder, most CEOs begin their career path within organizations by being employed in the areas of accounting and finance, followed by that of marketing, regardless of whether the employee has a major within that particular discipline.
In an article published in the Wall Street Journal, Erin White (2005) claimed that many CEOs with undergraduate degrees have graduated from either universities that were state supported or not well recognized, and those CEOs tended to major in subjects such as accounting, business administration, and engineering. She stated further that as businesses continue to mature, future CEOs’ education was predicted to shift toward a broader liberal arts education, in-cluding international experience, in order to function within this complicated and global economy of the 21st century.
The maturity and leadership qualities that a potential CEO hold are a key ingredient within the CEO selection process for companies, instead of the volume of business courses taken, which results in more CEOs being hired that possess undergraduate degrees in disciplines such as culture, history, and philosophy (White).
Institution(s) Attended by CEOs
In decades past, the primary universities that were frequently reported as being the dominant schools for attendance by the top executives were also among the list of today’s Ivy League schools: in 1900, there were 44 executives; in 1925, 53 executives; followed by 247 executives in 1950 attended these Ivy League universities (Newcomer, 1955). However, in 1950 one third of the granting degrees awarded came from state and city institutions, whereas in 1900 this group repre-sented one sixth of the institutions (Newcomer). The social prestige associated with attending such an institution was evident. According to Chandy (1991), CEOs of the Fortune 500 companies were inclined to pursue their undergraduate degrees from Yale (8%), Princeton (6%), Minnesota (5%), or Penn State (4%). Although the graduate degrees awarded to CEOs tended to be from Harvard (15%), Stanford (7%), Northwestern (6%), or Michigan (6%).
There is a notion that degrees received from a prestigious school, such as those classified as Ivy League, were essential in order for students to attain their high level of achievement within the business world. Ivy League schools were con-sidered as having a reputation for academic excellence, and consist of eight private institutions within the United States. According the Admissions Consultants (2007), these schools have been in operation for several years, located in the north-eastern portion of the United States, with large endowments and alumni support. Admission into the Ivy League was and is very competitive, with an acceptance rate between 9–20.5%, with 87–95% of the students accepted having grad-uated within the top 10% of their respective high schools, and attained a score of 1280–2370 on their SAT exams (Ad-missions Consultants). The eight schools considered by the Admission Consultants as being Ivy League were Brown, Columbia, Cornell, Dartmouth, Harvard, Penn, Princeton, and Yale.
According to Business Week (1991), Princeton University became the top producer of the 1,000 Corporate Elite CEOs, followed by Yale and Harvard. Other institutions, including the University of Pennsylvania (and its Wharton School), Northwestern, Stanford, and Cornell, still graduated many of the top business executives. However, when speaking about the graduate degree, which is earned by nearly 50% of the Corporate Elite, almost 10% of those CEOs held a Harvard degree in business, law, or some other specialty, followed by a degree from Stanford (Business Week).
Numerous research studies have revealed that students graduating from small liberal arts colleges do in fact
outperform students graduating from prestigious schools (such as on medical entrance exams) and there tends to be a higher percentage of liberal arts graduates who pursue their terminal degrees (Sowell, 2008). According to Sowell, these smaller colleges dominate the list of universities where grad-uates seek their doctoral degrees. In 2006, Sowell investi-gated where the CEOs of the 50 largest U.S. corporations received their degrees, and his findings revealed that only four had degrees from institutions classified as Ivy League. He also reported that over 50% of the CEOs have in fact graduated from state colleges, city colleges, or community colleges.
Goettesman and Morey (2006) defined the level of edu-cation obtained by a CEO as being an indicator of a high-quality CEO who should yield high performance for their organizations. The quality of the education received was de-termined by the prestige of the university from which CEOs graduated. The prestige factors utilized in the research were based on similar approaches used by Chevalier, Ellison, and Palia, who utilized the entrance scores (SAT, Graduate Man-agement Admission Test [GMAT], and Law School Admis-sion Test [LSAT]) necessary for admisAdmis-sion (Goettesman & Morey). Goettesman and Morey found very little evidence that organizations managed by CEOs from more prestigious universities perform better than firms with CEOs from less prestigious schools. Additionally, they discovered that com-pany leadership of CEOs that held an MBA or law (JD) degree, did not perform any better than firms with CEOs without graduate degrees, which suggests that an advanced degree is not needed for enhanced company performance.
PURPOSE
The purpose of the present study was to explore, describe, and explain the educational credentials and other demographic characteristics of Fortune 500 CEOs as reported by Fortune Magazine’s 2008 listing. We also identified trends among CEOs and across industries in order to further understand the leadership characteristics of these prominent organizations in North America. Our research not only identifies and de-scribes these characteristics, but also we intended to increase readers’ awareness of what it takes to become a successful business leader within powerful Fortune 500 companies.
Research Questions
Research Question 1: What is the composition of Fortune 500 organizations based on North American Industry Classification System (NAICS)?
Research Question 2: What are the key demographic vari-ables (age, gender, diversity) of Fortune 500 CEOs? Research Question 3: What are the educational qualifications
(level of degree, educational major, institution attended) of Fortune 500 CEOs?
METHOD
Research Design
We used a cross-sectional, quantitative descriptive study de-sign in which the CEOs of Fortune 500 companies were identified and described in terms of several demographic and psychographic variables. The descriptive analysis was not designed to make a generalization for the entire pop-ulation of CEOs. Providing some level of insight concern-ing the characteristics of CEOs managconcern-ing large companies within the United States was the goal of the present study. We presented the research proposal to the Human Subject Review Committee of the university seeking approval for the study to commence. We obtained their permission and began the study. The data for the descriptive analysis were gath-ered from various online business databases and other online sources.
Selection of Participants and Population Description
The study included all 500 companies from the 2008 For-tune 500 listing. From that listing, the companies were cross-referenced to the Mergent Online database, and the CEOs were selected as reported in the Mergent Online database (Mergent, 2008). The CEOs from Mergent Online were cross-checked to the Fortune 500 listing to ensure accuracy, and any discrepancies between the two sources were then investigated and clarified by the researchers. Using the For-tune 500 listing did limit the study to those organizations located within the boundaries of the United States. Our se-lection process permitted those CEOs managing the top 500 companies within the United States to be included in the study. Because this is a census study of Fortune 500 CEOs, no statistical inferences or generalizations are made outside of this population.
Data Collection and Instrumentation
We gathered archival evidence through the use of sec-ondary data that were obtained from the examination of online business-oriented databases and other secondary on-line resources. An onon-line search examining several business-oriented databases and other secondary data sources to locate the pertinent data regarding the CEOs were utilized.
Data Processing and Analysis
The selection process identified a total of 500 executives and we were able to collect data on 100% of our population. After developing the coding scheme, data were entered with SPSS (Version 16.0), and we physically examined and statistically cleansed the database. Any outliers were reviewed to ensure that the data were inputted correctly into SPSS for process-ing. We then performed a descriptive statistics analysis and summarized the reported observations from the Fortune 500 executives.
212 J. MARTELLI AND P. ABELS
FIGURE 1 Distribution of Fortune 500 companies based on the North American Industry Classification System (NAICS).
RESULTS
Research Question 1
The composition of Fortune 500 companies can be appro-priately compared by distinguishing factors, which include industry sectors and products or services offered. A de-tailed product classification system established by the Fed-eral Government (U.S. Census Bureau, 2010) was utilized for this study. The North American Industry Classification System (NAICS) is a group of six-digit codes, which per-mits organizations located in North America to be compared. The NAICS classification system organizes companies based upon their principal product or service.
Our analysis of the Fortune 500 based on the NAICS cod-ing system was limited to the two-digit level; representcod-ing the broadest concentration of firms within North America. The two-digit NAICS categorization revealed in Figure 1 that North America has 20 unique distinct industry sectors that label the corporations for the U.S. Fortune 500. As shown, Fortune 500 companies were represented in only 18 of the 20 unique industry divisions. Note that firms in the public administration sector would always be excluded from inclu-sion because this diviinclu-sion provides a variety of services to citizens and as such is classified as governmental throughout North America. It can be seen in Figure 1 that within the United States, the manufacturing sector clearly dominates U.S. industries and consists of 178 (35.6%) of the Fortune 500. The second highest Fortune 500 segment conducted its business in the finance and insurance sector, with a total of 80 (16.0%) firms, followed by the retail trade sector, with 57 (11.4%) organizations.
Research Question 2
We explored demographic variables to describe the com-position of top executives within organizations. Within our list of distinguishing traits, age, diversity, and gender were examined.
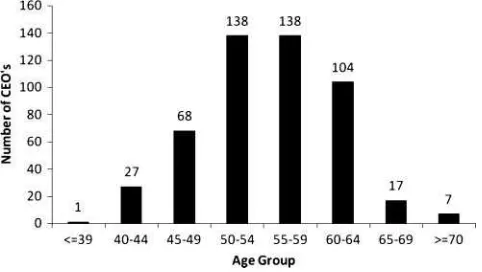
FIGURE 2 Age distribution of CEOs.
As shown in Figure 2, 76.0% of the CEOs listed on the Fortune 2008 listing belong in the age bracket of 50–64 years, which represents a decline of 7.4% since 1976. Si-multaneously, those CEOs aged 65 years and older increased by 41.2%, which could explain a portion of the 7.4% shift as CEOs enter into their maturity years of employment. The most notable change in the age of CEOs between 1976 and 2008 was that CEOs at present are considerably younger. Those CEOs between the ages of 40 and 44 years have grown by 107.7% and those between ages of 45 and 49 years have grown by 36.0%. The change in the composition of the CEOs could be attributed to the fact that CEOs are retiring and their replacements are younger. Overall, the present range of CEO ages was found to be between the ages of 38 and 81 years, yielding an average age of the Fortune 500 remaining con-sistent at 55.1 years as compared to the reports in 1976 and 1991 (SD=6.40).
As late as 1991, the CEO population consisted exclusively of White men. At present, this is not the case. The White men still dominate the high-profile executive environment, which is reflected by 472 (94.4%) male CEOs within the Fortune 500, although representing a decline of 5.6% since 1991. On the rise, non-White men presently comprise 15 (3.0%) of the CEOs ethnic backgrounds, with 11 (2.2%) White female executives coming in second, followed by non-White women at 2 (0.4%).
When reviewing the age of the 17 non-White executives exclusively, 41.2% of the executives were between the ages of 55 and 59 years, 17.6% were between the ages of 50 and 54 years, and 17.6% belonged in the bracket of people between the ages of 45 and 49 years, with the remaining 17.6% over the age of 60 years and 5.9% below age of 39 years. Given the ages of the non-Whites, it suggests that they are older and need to work harder as well as obtain more expe-rience and education in order to be elected by the Board of Directors into the CEO position.
In what industry sectors are non-Whites employed? From this group, 6 (35.3%) were running companies within the top 95 firms in terms of sales revenue within the United States. The non-Whites portrayed in Figure 3 were managing
FIGURE 3 Diversity and gender of CEOs.
establishments ranked in two of the top three NAICS in-dustries, manufacturing and finance and insurance. Overall, their presence is found within 8 of the 20 unique NAICS categories. The top three industries were found to be the manufacturing sector, employing 6 (35.3%) of the diversi-fied ethnic group; followed by finance and insurance, with 4 (23.5%); and professional, scientific, and technical services at 2 (11.8%).
The non-White population tends to be well educated, with 100% of the group holding at least a bachelor’s degree, with 7 (41.2%) earning a degree in the engineering or technol-ogy discipline, 5 (29.4%) earning a degree in business, fol-lowed by 3 (17.6%) earning a degree in the liberal arts, and 2 (11.8%) in the science discipline. In addition, 11 (64.7%) of the non-White CEOS hold a master’s degree, with 6 (54.5%) having a master’s in science, 3 (27.3%) holding a concen-tration in business management, and 2 (18.2%) with a law degree. There were 4 (23.5%) CEOs who pursued their ter-minal degree.
When reviewing the age of the 13 women exclusively, 53.8% of the female executives were between the ages of 50 and 54 years, 23.1% belong to the 45–49 years of age bracket, and the remaining 23.1% were between the ages of 55 and 64 years. Given the ages of the women, it appears that women are older and need to work harder, as well as obtain more experience and education in order to be elected by the Board of Directors into the CEO position.
In 1995, Catalyst began tracking employment data sur-rounding women and it reported that the Fortune 500 con-tained just one female CEO (Vaida, 2004). The lack of women holding the title of CEO could be attributed to a mother’s de-sire to balance the amount of time spent with her children and that of employment. Additionally, the low number of women within these larger firms could be attributed to few women earning an MBA in order to pursue these high-profile positions. As more women enroll into business schools, there should be an increase in the number of qualified women be-coming CEOs. Between the years of 1995 and 2005, the number male full-time graduate students increased by 27%,
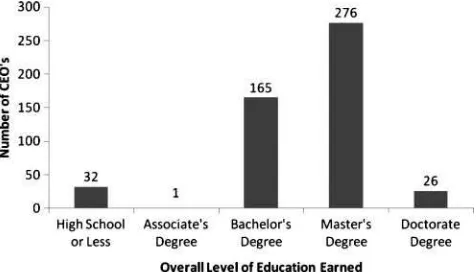
FIGURE 4 Level of education achieved by CEOs.
whereas there was a 65% increase for female graduate stu-dents (U.S. Department of Education, 2008).
Women who are running Fortune 500 companies grew to 12 CEOs in 2007, which is 2.4% of the present Fortune 500 executives (Jones, 2008). At present, the figure has risen, and 13 women (2.6%) hold the title of CEO. Since 1995, although still low in raw number, this represents a 1,200.0% increase in the number of female executives. The women are predom-inately White (84.6%) and educated (92.3%). The increase in female graduates may explain why the number of women running Fortune 500 companies has grown. Despite the fact that female enrollment in business-oriented degree programs at the undergraduate and graduate levels has been increas-ing, the number of women occupying executive management positions overall still remains low.
In what industry sectors were women employed? Among these women, 5 (38.5%) were managing companies that ranked within the top 63 firms in terms of sales revenue generation. The women illustrated in Figure 3 were manag-ing establishments that were found to be exclusively within the top three NAICS industry sectors. Eight (61.5%) were managing firms listed by NAICS as the manufacturing sec-tor, with 3 (23.1%) of the executives operating companies listed in the finance and insurance sector, and the remain-ing 2 (15.4%) of women were runnremain-ing establishments in the retail trade market.
At the undergraduate and graduate level, female students have been increasing at a faster pace than their male counter-parts, which could explain the growth witnessed by qualified female CEOs into this top position. Twelve women (92.3%) in the sample population held a minimum of a bachelor’s de-gree, with 5 (41.7%) earning a degree in business followed by 4 (33.3%) earning a degree in the liberal arts, with 2 (16.7%) in the science discipline and 1 (8.3%) of the women with an international degree. In addition, 6 (46.2%) of the women held a master’s degree, with 4 (66.7%) having a concentra-tion in business management. One female CEO pursued her terminal degree from an Ivy League university. Furthermore, one woman held an honorary doctorate from an international university.
214 J. MARTELLI AND P. ABELS
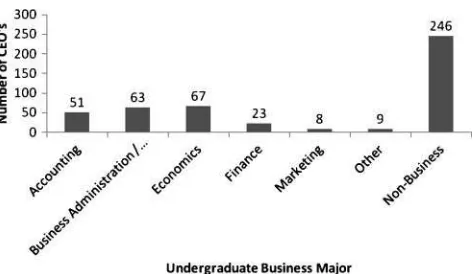
FIGURE 5 CEOs’ undergraduate area of study.
Research Question 3
Previous research published in Fortune Magazine (Burck, 1976) revealed that 27.9% of corporate CEOs held a bache-lor’s degree, 24.1% held a master’s degree, and 15.5% had obtained a doctoral degree. Research by Chandy (1991) re-vealed that 66% of Fortune CEOs had at least one graduate degree. Although the number of CEOs with at least a bache-lor’s degree has increased substantially, those moving on to a graduate degree have declined. One note of importance, the reported data of Chandy’s research yielded a 36% response rate among Fortune 500 CEOs, whereas our census study collected data from the entire Fortune 500 CEO population.
The overall composite picture of the level of education of 2008 Fortune 500 CEOs revealed that a master’s degree was the most commonly attained education level of Fortune 500 CEOs. In fact, over 55% of CEOs held a master’s degree. Figure 4 displays the distribution of education level from high school through doctorate.
Greater than 93% of CEOs had at least a bachelor’s de-gree, resulting in just fewer than 7% having less than a bach-elor’s degree. Further exploration of the data revealed that over 47% of CEOs undergraduate degrees were in a business degree program. Other high frequency undergraduate ma-jors include engineering or technology, liberal arts, and the sciences. Figure 5 provides a further breakdown of the un-dergraduate areas of study among CEOs. Further exploration of the sample data pertaining to the area of undergraduate degrees revealed that 222 (47.5%) were from private insti-tutions, 202 (43.3%) were earned from public instiinsti-tutions, 35 (7.5%) were earned from international institutions, and 8 (1.7%) were from military schools.
Ivy League schools granted 7.2% of the undergraduate business degrees. Overall, Ivy League schools granted 10.9% of all undergraduate degrees. This is compared to Sowell’s (2008) findings from 2006 in which his study revealed that 8% of the CEOs of the top 50 U.S corporations graduated from Ivy League schools. Furthermore, our research shows that Big Ten schools granted 9.0% of business-oriented dergraduate degrees, and, overall, nearly 10.0% of CEO un-dergraduate degrees were awarded from Big Ten schools.
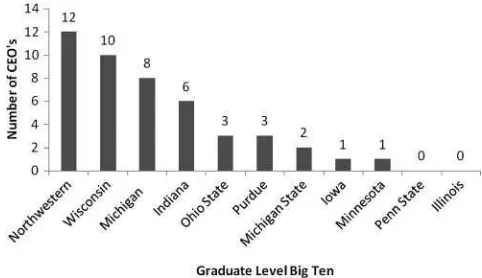
FIGURE 6 CEOs’ undergraduate business major.
Figure 6 displays the specific areas of study for those CEOs with a business degree as their undergraduate major, with nearly 82% of all business majors having studied busi-ness administration, economics, or accounting. Majors in finance, marketing and other majors made up the other 18% of those degrees. Note that there were 54 CEOs that either obtained a second undergraduate degree or had a dual major, with those numbers not reflected in Figure 6. The second majors for these CEOs were 18 in the area of business and 36 outside of the business discipline. Moreover, we note a consistent trend with Chandy (1991), showing that majors in business and engineering led the way, with a focus on man-agement, economics, accounting, and finance majors within the area of studies in business. As reported by Business Week (1991), Princeton University granted the most overall under-graduate degrees among the Corporate Elite, followed by Yale and Harvard. Results from the present study revealed that Harvard University and the University of California tied as having the most degrees awarded to these CEOs, followed by Duke University, Stanford University, the University of Missouri, and the University of Wisconsin.
Among CEOs holding a master’s degree, the MBA was the most widely held degree (297). Sixty-six percent of these 297 CEOs possess an MBA, with nearly 9% of these MBA-holding CEOs having a second master’s degree. Among those holding a master’s degree, a major in business administration and management was reported as the most common concen-tration or area of study. As shown in Figure 7, few CEOs specialized in areas such as finance, economics, marketing, and accounting. Seventy-six (25.6%) of those with a mas-ter’s degree were non-business-oriented, as shown in Figure 7. As reported by Business Week (1991), Harvard University graduated the highest volume of business degreed CEOs, fol-lowed by Stanford University, among the Corporate Elite. We found that Harvard University granted 44 of the 221 business-oriented master’s degrees, followed by Stanford University, with 13 of the 221 business-oriented master’s degrees for our Fortune 500 population, with University of Pennsylva-nia and Northwestern following with 9 and 8, respectively. Overall, for all master’s degrees, Harvard University clearly
FIGURE 7 CEOs’ graduate business major.
dominated the market for this advanced degree by awarding 50 (16.8%) of those 297 master’s degrees.
A stand-alone JD and a stand-alone master of science (MS) were the second most common master’s degree, at 13.8% and 14.8%, respectively. A total of 8.6% of CEOs with an MBA also held a second master’s degree with com-binations of an MBA and JD at 3.0% and MBA and other master’s degree at 5.6% for the population.
Chandy (1991) reported that Harvard, Stanford, North-western, and Michigan were top producers of CEOs, with 15%, 7%, 6%, and 6%, respectively, with graduate degrees in business, engineering, and law leading the way, in that particular order. Results from the present study found that Harvard led the way in producing master’s degrees among the CEOs, with a total 16.8%, with Stanford being the next runner-up at 5.7%, followed by Columbia University and the University of Pennsylvania, with 4.4% each. Of those CEOs holding a master’s degree from Harvard, 88% (44) held a Harvard MBA.
Figure 8 shows the distribution Ivy League master’s-degree-producing CEOs. Harvard University led the pack with 50 of the 84 graduate degrees. Columbia University and the University of Pennsylvania came in a distant second each producing 13 Ivy League master’s degreed CEOs. Figure 9 displays the distribution of Big Ten schools graduating the
FIGURE 8 Number of CEOs graduating from Ivy League schools.
FIGURE 9 Number of CEOs graduating from Big Ten schools.
most CEOs among those in our study. As can be seen, North-western University and the University of Wisconsin led the pack with 12 and 10 CEOs, respectively, earning their mas-ter’s degree from those schools.
Corporate CEOs held a total of 297 master’s degrees (23 CEOs had multiple master’s degrees). Of these, our data showed that 199 of the degrees (67.0%) were earned from private universities, 85 (28.6%) were earned from public stitutions, and 13 (4.4%) were earned from international in-stitutions. Overall, 84 master’s degrees (28.3%) were earned from Ivy League schools, and 46 (15.5%) were earned from Big Ten institutions.
An earned doctorate degree was held by 26 (5.2%) of CEOs. Additionally, as shown in Figure 10, 13 CEOs had an honorary doctorate. We suspect that the number of CEOs holding an honorary doctorate might be higher than reported. At the earned doctoral level, we found 26 CEOs with such a degree, with 53.8% granted from private institutions and 23.1% from public institutions, whereas 23.1% were granted from international universities. Furthermore, both the Mas-sachusetts Institute of Technology and the University of Cali-fornia led the way with 3 each (11.5% each) of the 26 earned doctorates. Overall, at the doctoral level (including Hon-orary), 51.3% were awarded by private universities, 28.2%
FIGURE 10 Type of doctoral degree earned.
216 J. MARTELLI AND P. ABELS
from public universities, and 20.5% from international uni-versities. Moreover, overall degrees awarded were 12.8% from Ivy League schools and 7.7% from Big Ten schools.
DISCUSSION
The purpose of this study was to explore, describe, and explain the educational credentials and other demographic characteristics of Fortune 500 CEOs. In order to achieve our objective, we used a highly detailed coding classification sys-tem (NAICS) established by the U.S. Federal Government, at the two-digit level for comparison. Our findings revealed that the manufacturing sector continues to hold a dominant role within the U.S. economy.
Key demographic variables (age, gender, diversity) were explored in order to describe the composition of top execu-tives within organizations. At present, CEOs were found be-tween the ages of 38 and 81, yielding an average age of 55.1 years. Our results indicated that White men still dominate the high-profile executive environment, which is reflected by 472 (94.4%) male CEOs. Since 1991, on the rise among CEOs were non-White men presently comprising 15 (3.0%) of the CEOs’ ethnic backgrounds, with 11 (2.2%) White fe-male executives coming in second, followed by non-White women at 2 (0.4%).
More than 93% of CEOs had at least a bachelor’s degree, resulting in just fewer than 7% having less than a bach-elor’s degree. Our data revealed that over 47% of CEOs undergraduate degrees were in a business degree program, with the private institutions granting the most degrees of 222 (47.5%) Further exploration revealed Ivy League schools granted 10.9% of all undergraduate degrees and Big Ten schools granted nearly 10.0% of CEO undergraduate degrees. The specific areas of study for those CEOs with a business degree revealed nearly 82% of all business majors having studied business administration, economics, or accounting. Majors in finance, marketing, and other majors made up the other 18% of those degrees. Results from the study revealed that Harvard University and the University of California tied as having the most degrees awarded to these CEOs.
Our research indicated that a master’s degree was the most commonly attained education level of CEOs. In fact, our research indicated that over 55% of CEOs held a mas-ter’s degree. Corporate CEOs held a total of 297 masmas-ter’s degrees, with private institutions granting the most degrees of 199 (67.0%). Further exploration revealed that Ivy League schools granted 84 (28.3%) of all graduate degrees and Big Ten schools granted 46 (15.5%) of CEO graduate degrees. Among CEOs holding a master’s degree, the MBA in busi-ness administration and management were reported by 66% of CEOs. Our study revealed that Harvard University domi-nated the market by awarding 50 (16.8%) of the 297 master’s degrees to these CEOs.
An earned doctorate degree was held by 26 (5.2%) of CEOs. Our research indicated that the highest volume
of earned degrees were granted from private institutions (53.8%). Moreover, overall degrees awarded were 12.8% from Ivy League schools and 7.7% from Big Ten schools. Furthermore, both the Massachusetts Institute of Technol-ogy and the University of California led the way with 3 each (11.5% each) of the 26 earned doctorates to these CEOs.
We explored the various educational credentials and other demographics factors of Fortune 500 CEOs as reported by Fortune Magazine’s 2008 listing. We also identified trends among CEOs and across industries in order to further understand the leadership characteristics of these prominent organizations in the United States. We hope that the present research increases the awareness of what it takes to become a successful business leader within these powerful Fortune 500 companies. Leaders who manage these huge conglomerates were no longer exclusively White men. The 21st century CEO still remained well educated and about 55 years of age, although at the same time, the number non-White women and younger CEOs has been increasing, albeit slowly. We anticipate this trend may continue into the future at an increasing pace.
Newcomer (1955) studied business executives across the first half of the 20th century, specifically looking at execu-tive composition by demographic and psychographic factors in three distinct time periods—1900, 1925, and 1955. She wrote “Graduate study in business administration has not been generally available to even the 1950 generation, and consequently graduate degrees in business administration are few” (p. 74–75). She cited Harvard Business School as one of the few institutions in which the CEOs in pursuit of an educa-tion were available. Newcomer went on to state that “It may be in the future graduate training in business administration will become essential in top business positions as graduate training has become in [the discipline of] law. Certainly, such training is one of the tests of a profession” (p. 75).
Our research seems to confirm Newcomer’s prediction of over a half a century ago. A master’s degree has become the most sought after degree by CEOs, with a graduate degree in business administration being the norm. Despite what may be thought, CEOs do not graduate exclusively from Ivy League schools or Big Ten universities. These CEOs were found to be graduating from private and public institutions primarily across the United States. No matter the prestige or the size of the college, educators need to provide students—future CEOs—with the best management, ethical, and moral training.
We focused on trying to establish a composite profile of top corporate executives, choosing the CEOs of the 2008 Fortune 500 as our population, and we studied the entire population of these Fortune 500 executives. The data were not selected as a random sample of CEOs in general. Any generalizations made outside of the sample population were spurious and nonstatistical. Further research along these lines can expand in many different areas. For one, including execu-tives from the Global 500 and comparing these leader profiles
from across the globe would add an interesting perspective. Additionally, in the present study, we did not particularly address whether these leaders were successful in leading their organizations. In today’s turmoil-filled business envi-ronment, especially in the handling of financial matters of the organization, it is plausible that some of these executives have been less than diligent in managing the matters of their organizations, and, at worst, even guilty of corporate malfea-sance. A comparative study of characteristics of successful and unsuccessful executives, whether the CEO or some other lower level executive, would be interesting to ascertain if any of these demographic and psychographic variables are shown to discriminate between CEOs shown to be successful or unsuccessful in leading their respective corporations.
REFERENCES
Admissions Consultants. (2007). Ivy league college admission sum-mary. Vienna, VA: Author. Retrieved July 2, 2008, from http://www. admissionsconsultants.com/college/ivy league table.asp
Bureau of Labor Statistics. (2010). Occupational outlook handbook 2010–2011 edition, top executives. Retrieved February 22, 2010 from http://www.bls.gov/oco/ocos012.htm
Burck, C. G. (1976, May). A group profile of the Fortune 500 Chief Execu-tive Officers.Fortune,125, 173–177, 308–312.
Business Week. (1991, November 25). The corporate elite.Business Week, 174–216.
Chandy, P. R. (1991, Winter). Chief executive officers: Their backgrounds and predictions for the 90s.Business Forum,16(1), 18–19.
Goettesman, A. A., & Morey, M. R. (2006, April). Does a better edu-cation make for better managers? An empirical examination of CEO educational quality and firm performance.Social Science Research Net-work. Retrieved December 26, 2008, from http://ssrn.com/abstract=
564443
Jones, D. (2008, January 3). Female CEOs make more gains in 2007.USA Today.
Mergent, Inc. (2008). Mergent online. Retrieved July 1, 2009, from http://www.mergentonline.com
Newcomer, M. (1955).The big business executive: The factors that made him 1900–1950. New York: Columbia University Press.
Sowell, T. (2008, January 18). A prestigious degree doesn’t always equal success.Chronicle of Higher Education,54(19), A34.
The 500 largest U.S. corporations. (2008, May).Fortune,157(5), 217. U.S. Census Bureau. (2010).North American industry classification
sys-tem. Retrieved February 24, 2010, from http://www.census.gov/eos/ www/naics
U.S. Department of Education. (2008). Digest of educational statistics, 2007. Washington, DC: National Center for Education Statistics. U.S. Department of Labor. (2006).Women still underrepresented among
highest earners. Washington, DC: Bureau of Labor Statistics.
Vaida, B. (2004, February 21). Still a man’s world.National Journal,36(8), 528–529.
White, E. (2005, April 12). Future CEOs may need to have broad liberal-arts foundation.Wall Street Journal, B4.