Graduates Receive Unequal Pay?
Judith A. McDonald
Robert J. Thornton
a b s t r a c t
We analyze the female-male gap in starting-salary offers for new college graduates using data from the annual surveys of the National Association of Colleges and Employers (NACE), unique (and proprietary) data that have not previously been used for this purpose. A major advantage of working with a data set on salaries for new college graduates is that we can remove the possible influence of gender differences in experience, promotions, job changes, and other factors on the salary gap. We find that as much as 95 percent of the overall gender gap in starting-salary offers can be explained by differences in college majors selected.
I. Introduction
It is well known that the overall gender pay gap in the United States has fallen over the past 25 years. Also well known are the reasons for gender earn-ings differences, although the relative importance of these reasons remains open to debate (see Altonji and Blank 1999 and Polachek 2004 for recent surveys). Consid-erably less attention has been directed to the gender earnings gap for college grad-uates and the underlying reasons, especially the difference between female and male earnings immediately after graduation. In recent years the female-male annual earnings ratio for young college graduates with a bachelorÕs degree has generally
Judith McDonald is an associate professor and Robert Thornton is a professor of economics at Lehigh University. The authors thank Gauri Karve for research assistance. They also thank NACE for access to its restricted-use salary surveys. Any errors remain the sole responsibility of the authors. The authors would be happy to provide guidance to other researchers seeking these data; please contact Judith A. McDonald, Department of Economics, Lehigh University, 621 Taylor Street, Bethlehem, PA 18015-3117,
email: djm0@lehigh.edu.
[Submitted July 2005; accepted May 2006]
ISSN 022-166X E-ISSN 1548-8004Ó2007 by the Board of Regents of the University of Wisconsin System
averaged about 0.90.1However, because the reported earnings averages are for per-sons in the 18–24 age range, they reflect starting salaries upon graduation as well as possible gender differences in other factors, including earnings growth for several years after graduation, attending graduate school after college, and working before college. Using data on starting salaries from the National Association of Colleges and Employers (NACE), we find that as much as 95 percent of the overall gender gap in starting-salary offers in the NACE data can be attributed to differences in col-lege majors selected.
In this paper we analyze the female-male gap in starting-salary offers for new col-lege graduates using a data set that, with the exception of Paglin and Rufolo (1990), has not previously been used by economists in their research on gender pay differ-entials. A major advantage of working with a data set onstartingsalaries for new college graduates is that we can remove the possible confounding effects of gender differences in experience, promotions, job changes, and other factors on the gender earnings gap. The difficulty in controlling for such factors has been in part respon-sible for the disagreement among researchers as to just how much of the gender earn-ings gap is attributable to labor-market discrimination.
The data set we use is taken from the annual surveys of NACE (previously known as the College Placement Council), which since 1967 has surveyed beginning salary offers for a large sample of male and female college graduates. We seek to determine the extent to which differences in the overall gender gap in starting-salary offers made to new college graduates in the NACE data can be explained by differences between men and women in the majors they have selected.
In the next section we review the prior studies in the labor economics literature that have attempted to determine how much of the gender earnings gap can be attrib-uted to male-female differences in college majors. As OÕNeill (2003, p. 313) says, college major contributes significantly to the wage gap, but the magnitude of the ef-fect is far from certain, as will be seen below. We then discuss the NACE salary sur-veys (along with their limitations) and use data from the sursur-veys to construct an annual time series of the ratio of female-male average starting-salary offers from 1969-2001. Using simulation we then estimate what these salary ratios would have been if women had the same distribution of majors and numbers of offers as men.
II. Previous Studies of the Effect of College Major on
the Gender Pay Gap
Over the past several decades there has been a marked shift in the college major decisions of women: As womenÕs expected years in the labor force have risen, they have chosen traditionally more lucrative fields of study, as the human-capital model would predict (see, for example, Polachek 2004; and Manning and Swaffield 2005). Women have been moving away from majors in
1. This ratio, calculated from the P-60 series, is based on average annual earnings of persons 18–24 with a bachelorÕs degree working year-round full-time. (Calculated from U.S. Census Bureau, ‘‘Money Income in the United States,’’ Current Population Reports, P-60 series, 1995–2001.) The standard errors associated with annual earnings estimates for each group are rather high, and there is sometimes considerable year-to-year variation in the estimates and therefore in the ratio.
which they were disproportionately concentrated (such as education and the liberal arts) and into majors in which they have been underrepresented (such as business, computer science, and engineering); see, for example, Joy (2000), Turner and Bowen (1999), and Eide (1994).
Although there has been much prior research analyzing gender differences in the choice of college majors, only a handful of studies have attempted to estimate how much of the gender wage gap among college graduates might be due to differences in the majors selected. No previous study is quite comparable to ours, however, as only two—Gerhart (1990) and Graham, Hotchkiss, and Gerhart (2000)—have analyzed starting salaries, but both focused on single institutions. The NACE surveys, on the other hand, cover about 350 U.S. colleges and universities. Table 1 summarizes the results of the previous studies.
As the table shows, previous studies have found that the choice of major has had some effect on the gender earnings gap for college graduates. However, depending on the study, gender differences in major have been found to explain from less than 10 percent to nearly 50 percent of the gender earnings gap. Of course, differences in the approaches taken, years studied, and control variables used are partially responsible for the variability in the findings. In most prior research the salaries studied were for college graduates with several years of work experience, however, and as a result we cannot tell whether the gap begins immediately upon graduation. Another characteris-tic of most studies is the very high degree of aggregation in the definition of major. Lumping majors together in such broad categories may mask sizeable field-specific sal-ary differences.
As we will see in the next section, use of the NACE data set allows us to overcome many of the limitations of previous studies. The NACE data on average salary offers by college major are currently reported for about 80 major fields. In addition, salaries are beginning salaries and thus control for the effects of experience. Perhaps most importantly, the NACE survey can be used to compare gender differences for a rel-atively long period of time, with annual data on average male and female starting salaries by major available for the period from 1974 through 2001.
III. The NACE Survey
The National Association of Colleges and Employers began its an-nual salary survey of college graduates in 1960. The survey reports beginning salary offers made to new graduates by employers in business, industry, government, and nonprofit institutions each year over the period September through August, what NACE calls the recruiting year. The NACE survey is currently based on information solicited from about 350 career planning and placement offices of colleges and uni-versities across the United States. The institutions participating in the survey are broadly representative of all colleges and universities with respect to size, region, and public-private mix. (See Appendix 1.)
Table 1
Principal Studies of the Effect of College Major on the Gender Pay Gap
Study
1967–75 6 4,508 (NLS of
Labor Market
About 10 percent of the gender difference in hourly wages can be explained by major
Black et al. (2005)
1993 144 74,613 from
NSCG causes the log wage gap to fall by just under half of the observed earnings gap
Daymont and Andrisani (1984)
1978 10 2,835 (NLS72) 2 years after
Table 1 (continued)
Eide (1994) 1979 and
1986 about 27 percent of wage gap
Gerhart (1990) 1976–86 65 2,895 college
grads; hiring by account for 43 percent of differences in
1985–88 5 951 graduates of
a single women were paid less than men is different fields of study—they account for between 19–38 percent of the gender pay gap
Hecker (1998) 1993 27 NSF sample of
215,000 people
4–13 years after graduation (‘‘young’’ group)
Occupation About 1/3 of the gender
Joy (2003) 1994 26 4,502 (NCES) account for less than 10 percent of the male-female wage gap
Loury (1997) 1979 and
1986
Only a small part of the decline in gender earnings gap in the 1980s was due to changes in the distribution of majors Weinberger
(1998)
1985 12 and 246 5,952 (NCES)
Survey of explain less than half the wage gap relative to white men. (Adding controls for narrowly
1985 12 5,025 (NCES
SRCG)
Same as above Same as above and
math content of each major
arts, quality control, and social work). (See Appendix 2.) The NACE salary data are reported only as averages, and salary data by individual or by institution are neither published nor available. The number of salary offers reported varies over the years (see Table 2); for example, the total for 2001 was 26,899.
There are a number of limitations of the NACE data. In describing its survey meth-ods and scope, NACE states that itsSalary Surveysreport salary offers rather than acceptances. It should also be noted again that the NACE survey period is truncated, with information collected for each graduating class only through the recruiting year. This corresponds roughly to a studentÕs senior year in college and the summer fol-lowing graduation. This means that salary offers in those majors where job offers are plentiful—those majors most in demand by employers—are overrepresented in the NACE data.
The NACE data are not detailed enough to allow us to control for exogenous fac-tors, for example, job location or college quality, which might differ by gender and thus bias our results. Also, although only about 10 percent of graduates nationally find their jobs through college placement centers (Choy and Geis 1997, p. 25), the NACE data probably overrepresent students in this category as well. Students are more likely to use these centers while on campus than they are after they graduate. However, there is no way to measure the degree of overrepresentation because the NACE survey is not restricted only to those students who use college placement cen-ters. For all these reasons, it is not necessarily correct to label the averages reported by NACE as representing average salary offers ofallcollege graduates.
Despite these limitations, however, the NACE data still possess the considerable advantages of providing us with a series on starting salaries broken down by gender for a large number of college major categories. Moreover, the salary surveys have been conducted annually over nearly a 30-year period.
IV. The Female-Male Starting-Salary-Offer Gap:
What the NACE Data Show
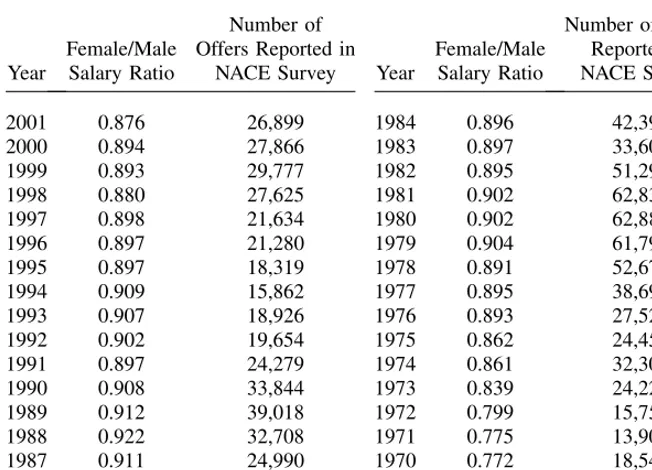
In Table 2 we have presented our calculations of the overall ratios of average female-male beginning salary offers (for all majors combined) along with the number of reported offers using NACE data for each year since 1969. Several interest-ing observations can be made. First, with their values fluctuatinterest-ing around 0.90 from 1976 on, the overall female-male salary ratios in Table 2 are high and comparable both to those based on Current Population Survey (CPS) data for young college graduates with a bachelorÕs degree and also to those of the Graham, Hotchkiss, and Gerhart (2000) and Gerhart (1990) studies (which were based on data from one university and one firm respectively). These two studies, it should be noted from Table 1, also analyzed averagestarting salariesof new college graduates. However, the gender sal-ary ratios in Table 2 are somewhat higher than those found in most of the other studies summarized in Table 1, but these studies examined average salaries within broader age ranges. This observation suggests that the gender pay gap begins to widen shortly after college graduation.
a percentage point or two. It is also clear that the period of the early 1970s was one of a substantial narrowing of the gap. During the span of only eight years (1969–76) the female-male starting-salary ratio rose by about 13 percentage points. Furthermore, this increase in the ratios based on the NACE data seems to lead the increase in the ratios based on the CPS series for all females and males by about 10 years. Female-male earnings ratios based on the CPS series began to rise in the early 1980s (OÕNeill and Polachek 1993, p. 206).2Such a lead-lag relationship is reason-able, since it would take time for the effects of changes in the earnings ratios for
recentcollege graduates to show up in the general series for all men and women. How much of the gender starting-salary gap in the NACE data can be explained by gender differences in majors and offers? We make use here of a simple simulation technique similar to that used by Chiswick et al. (1974) and Treiman and Hartmann Table 2
Female-Male Starting Salary Ratios,a1969–2001
Year
Female/Male Salary Ratio
Number of Offers Reported in
NACE Survey Year
Female/Male Salary Ratio
Number of Offers Reported in NACE Survey
2001 0.876 26,899 1984 0.896 42,393
2000 0.894 27,866 1983 0.897 33,604
1999 0.893 29,777 1982 0.895 51,290
1998 0.880 27,625 1981 0.902 62,835
1997 0.898 21,634 1980 0.902 62,887
1996 0.897 21,280 1979 0.904 61,792
1995 0.897 18,319 1978 0.891 52,670
1994 0.909 15,862 1977 0.895 38,697
1993 0.907 18,926 1976 0.893 27,525
1992 0.902 19,654 1975 0.862 24,451
1991 0.897 24,279 1974 0.861 32,306
1990 0.908 33,844 1973 0.839 24,226
1989 0.912 39,018 1972 0.799 15,757
1988 0.922 32,708 1971 0.775 13,907
1987 0.911 24,990 1970 0.772 18,545
1986 0.904 32,965 1969 0.762 39,451
1985 0.904 44,479
Source: Annual Salary Surveys of the National Association of Colleges and Employers, 1969–2001. a. Ratios for each year are calculated asðSn
c=1wcfN f c=SN
f cÞ=ðS
n c=1wmcN
m c=SN
m
cÞ wheref= female,m= male, wis the average salary offer for each major, N refers to the number of salary offers reported for each major (c), and n is the total number of majors. The number of major fields reported by NACE in its salary surveys varies by year (see Column 4 of Table 5), but is currently 79. For a complete list of the majors used by NACE for which salary information is reported, see Appendix 2.
2. OÕNeill and Polachek (1993) attribute the narrowing of the general gender earnings gap primarily to the convergence in measurable work-related characteristics (such as schooling and experience) as well as to an increase in womenÕs returns to experience.
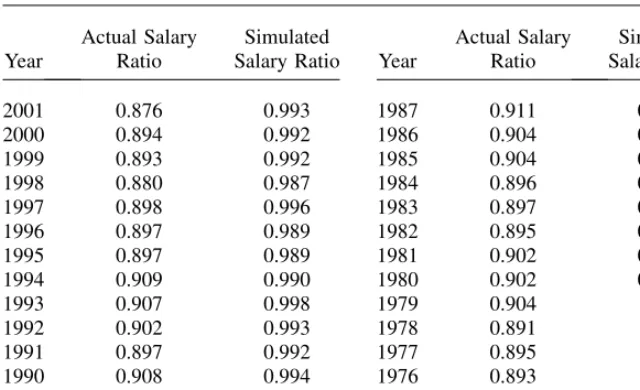
(1981) in estimating what the overall female-male starting pay ratios would have been if women had the same distribution of offers by major as men. In other words, we apply female average salary offers by major to the male distribution of the num-ber of offers by major and recalculate the overall gender salary ratios for each year. The resulting simulated gender salary ratios are reported in Table 3 along with the actual gender salary ratios calculated in Table 2.3What is remarkable is that the sim-ulated gender pay ratio rises to about 0.99 in most years and for several years in the late 1970s actually reaches unity. In other words, almost all, that is, about 95 percent of the roughly ten percentage-point overall gender starting-salary gap present in the NACE salary data, is explained by gender differences in majors and number of offers.4 This finding differs from those of the previous studies that found that college major Table 3
Actual and SimulatedaFemale-Male Starting Salary Ratios, Based on Average Salary Offers by Curriculum (Major Field), 1974–2001
Year
Actual Salary Ratio
Simulated
Salary Ratio Year
Actual Salary Ratio
Simulated Salary Ratio
2001 0.876 0.993 1987 0.911 0.991
2000 0.894 0.992 1986 0.904 0.994
1999 0.893 0.992 1985 0.904 0.996
1998 0.880 0.987 1984 0.896 0.991
1997 0.898 0.996 1983 0.897 0.993
1996 0.897 0.989 1982 0.895 0.996
1995 0.897 0.989 1981 0.902 0.996
1994 0.909 0.990 1980 0.902 0.997
1993 0.907 0.998 1979 0.904 1.003
1992 0.902 0.993 1978 0.891 1.002
1991 0.897 0.992 1977 0.895 1.006
1990 0.908 0.994 1976 0.893 1.006
1989 0.912 0.994 1975 0.862 1.003
1988 0.922 0.993 1974 0.861 0.990
a. Simulated salary ratios indicate what the female-male salary ratio would be if the number of female sal-ary offers in each curriculum (major) were identical to that of males. In other words, simulated ratios for each year are calculated as:ðSn
c=1wcfN m c=SN
m cÞ=ðS
n c=1wmcN
m c=SN
m
cÞwith the symbols defined as in the footnote of Table 2. The number of major fields reported by NACE in its salary surveys varies by year (see Column 4 of Table 5), but is currently 79. For a complete list of the majors used by NACE for which salary information is reported, see Appendix 2.
3. In Table 3 we were unable to calculate the simulated ratios before 1974. Prior to that year, female sal-aries were not reported by major but only by functional ( job) area.
could generally explain somewhere between 10–50 percent of the earnings gap. Again, though, most of these prior studies did not look atstartingsalaries immedi-ately after graduation, and most also used extremely broad major groupings.5On the other hand, the NACE data only reflect salary offers during the recruiting year.
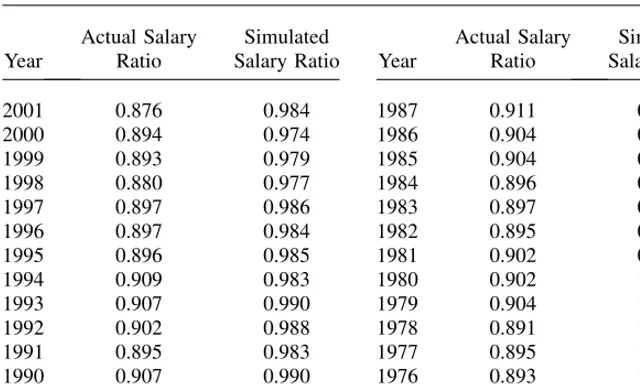
College major, of course, is one indicator of the types of occupations that college graduates enter after graduation. Fortunately, the NACE survey also reports informa-tion on starting salaries by funcinforma-tional area, or type of job, as well. For 2001, 84 dif-ferent detailed functional areas were reported, such as public relations, bioengineering, insurance, and social work. (See Appendix 2.) In Table 4 we have presented the results of a similar set of simulations, the result of our computing what the overall female-male starting pay ratios would have been if women had the same distribution of job offers by functional area as men. As can be seen from the table, the resulting simulated salary ratios are very similar to those presented in Table 3. In most years, about 80–90 percent of the roughly ten percentage-point gender salary gap disap-pears, being explained by differences in the types of job offers that men and women receive.6
V. Discussion
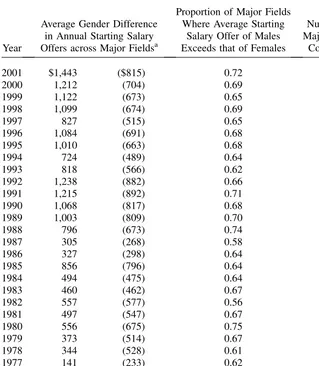
In light of the simulation results and subject to the limitations of the NACE data, can we conclude that the magnitude of salary discrimination against females immediately after college graduation is neither large nor pervasive? Table 5 presents yet another look at gender differences in starting salaries from a different perspective using the NACE data. In the second column of the table we have calcu-lated the mean difference in average annual starting salary offers (nominal and real) averaged across all reported majors for each year from 1974–2001. (The salary offers have not been weighted for the number of offers reported within each major field.)
As can be seen for each year over this period, average male starting salaries exceeded average female starting salaries across all major fields. Although male sal-aries are not higher than female salsal-aries for all major fields, the third column of Table 5 shows that this is the case about two-thirds of the time. Furthermore, this fraction is
5. In using a small number of highly aggregated major fields, previous studies may well have underesti-mated the proportion of the gender salary gap that college major can explain. When we repeated our sim-ulation for the year 2000 using the ten more general major categories that NACE provides, we found that the simulated gender salary ratio fell from 0.992 to 0.977. As expected, by aggregating majors into far fewer categories, the proportion of the gender earnings gap that college major can explain falls. Therefore, the smaller proportion of the gender salary gap that college major has been able to explain in previous stud-ies is probably due in part to the highly aggregated specification of major field of study.
6. Because the NACE data are based on salary offers received by students during the recruiting year, they overrepresent some majors, particularly engineering. To ascertain how much of a difference this made, we calculated the actual and simulated female/male salary ratios for engineering majors only and found that female salary offers on average exceeded those of males both with and without controls for the gender dif-ferences in the engineering specialties. When we recalculated the female/male salary ratios with offers for engineering majors excluded, we found that the actual gender salary ratioroseby several percentage points.
relatively constant over most of the 1974–2001 period. Just as Eide (1994) observed, pay disparities between males and females still exist within most major fields.7
A closer examination of gender differences in salary offers by specific major fields (not shown in the table) reveals some further interesting patterns. For example, NACE reported average salary offers by gender for 20 different engineering major fields in 2001. In 12 of these engineering major fields, average starting-salary offers for females exceeded those of males. On the other hand, in three other broad major categories (business, with ten different major fields reported; humanities and social sciences, with 12 different major fields; and physical sciences, with nine different major fields), average salary offers for males usually exceeded those for females (in 23 of 31 major fields). Moreover, this pattern persists over virtually the entire period from 1974–2001. Usually in more than half of the engineering major fields, Table 4
Actual and SimulatedaFemale-Male Starting Salary Ratios, Based on Average Salary Offers by Functional Area (Type of Job), 1974–2001
Year
Actual Salary Ratio
Simulated
Salary Ratio Year
Actual Salary Ratio
Simulated Salary Ratio
2001 0.876 0.984 1987 0.911 0.991
2000 0.894 0.974 1986 0.904 0.992
1999 0.893 0.979 1985 0.904 0.995
1998 0.880 0.977 1984 0.896 0.992
1997 0.897 0.986 1983 0.897 0.990
1996 0.897 0.984 1982 0.895 0.999
1995 0.896 0.985 1981 0.902 0.999
1994 0.909 0.983 1980 0.902 1.002
1993 0.907 0.990 1979 0.904 1.007
1992 0.902 0.988 1978 0.891 1.006
1991 0.895 0.983 1977 0.895 1.009
1990 0.907 0.990 1976 0.893 1.005
1989 0.912 0.986 1975 0.862 0.998
1988 0.922 0.994 1974 0.861 0.982
a. Simulated salary ratios indicate what the female-male salary ratio would be if the number of female sal-ary offers in each functional area (occupation) were identical to that of males. In other words, simulated ratios for each year are calculated as:ðSn
j=1w f
jNmj=SNmjÞ=ðS n
j=1wmjNmj=SNmjÞwith the symbols defined as in the footnote of Table 2 and j here referring to occupation. The number of functional areas (job types) reported by NACE in its salary surveys varies by year and is currently 84. For a complete list of the func-tional areas used by NACE for which salary information is reported, see Appendix 2.
average starting-salary offers for women exceed those for men. But in the business, humanities and social sciences, and physical science major field groupings, average salary offers for females only rarely exceed those for males (about 15 percent of the time over the period studied).
Table 5
Gender Differences in Starting Salaries Averaged across Major Fields
Year
Average Gender Difference in Annual Starting Salary Offers across Major Fieldsa
Proportion of Major Fields Where Average Starting
Salary Offer of Males Exceeds that of Females
Number of Major Fields
Compared
2001 $1,443 ($815) 0.72 78
2000 1,212 (704) 0.69 78
1999 1,122 (673) 0.65 75
1998 1,099 (674) 0.69 77
1997 827 (515) 0.65 74
1996 1,084 (691) 0.68 77
1995 1,010 (663) 0.68 72
1994 724 (489) 0.64 72
1993 818 (566) 0.62 68
1992 1,238 (882) 0.66 70
1991 1,215 (892) 0.71 68
1990 1,068 (817) 0.68 68
1989 1,003 (809) 0.70 67
1988 796 (673) 0.74 42
1987 305 (268) 0.58 26
1986 327 (298) 0.64 25
1985 856 (796) 0.64 25
1984 494 (475) 0.64 25
1983 460 (462) 0.67 24
1982 557 (577) 0.56 25
1981 497 (547) 0.67 24
1980 556 (675) 0.75 24
1979 373 (514) 0.67 24
1978 344 (528) 0.61 23
1977 141 (233) 0.62 21
1976 83 (146) 0.52 21
1975 272 (506) 0.65 20
1974 248 (503) 0.65 20
Source: Authors’ calculations from Annual Salary Surveys of the National Association of Colleges and Employers, 1974–2001.
a. For example, in the average major field reported by NACE in 2001, male graduates were offered starting salaries averaging $1,443 higher than salaries offered to female graduates. The average gender differences in starting salaries are not weighted by the number of offers within each major field. Real dollar differences [1982-84=100] are given in parentheses.
Why are there differences in starting-salary offers to men and women within the same major field? Because the aggregate nature of the NACE data does not allow us to address this question, we can only offer possible explanations from the literature. Several researchers have suggested that women are not as willing (or able) as men to negotiate, thus failing to obtain the best possible starting salary (see, for example, Chen, Katuscak, and Ozdenoren 2005; Gerhart 1990, p. 430; and Babcock and Laschever 2003). Joy (2003, p. 617) notes that young women may engage in limited job searches to re-main in proximity to family or friends. She also claims that women are more likely than men to relocate for their partnersÕcareers. Graham, Hotchkiss, and Gerhart note that women are more apt to work for smaller firms that tend to pay less (2000, p. 15), and Kirby (2003) finds that men are three times as likely as women to be work centered. But what could account for the singular exception of engineering, where the NACE data show that female graduates have on average received higher starting sal-aries than males? One plausible explanation is that it is the effect of affirmative ac-tion and preferential hiring. Engineering is one of a shrinking number of professions that still attract far fewer women than men. With so few women, the demands for gender diversity in the workplace could lead to salary premiums for women. Morgan found that female engineering graduates in the past were offered higher salaries than comparable men because there were very few women and all companies were ‘‘com-pet[ing] for the same limited pool’’ (2000, p. 320). Still, without further evidence the explanation for the unique case of engineering remains elusive.
VI. Conclusions
The NACE surveys provide us with an interesting look at the gender salary gap for new college graduates with a unique data set that, because of its pro-prietary nature, has not been generally available to economists. We have found that a high proportion of the gender gap in starting-salary offers to candidates during the recruiting year is attributable to gender differences in college major. Specifically, about 95 percent of the roughly ten percentage-point gender difference in starting sal-aries in the NACE data disappears once we control for major. Our results are also robust with respect to time, since there is little variation in our findings over a period of about 25 years.
Themagnitudeof the gender starting-salary gap notwithstanding, there is still evi-dence consistent with the differential treatment of male and female college graduates with respect to starting-salary offers. With the exception of engineering, for most major fields (and for most occupations) surveyed by NACE, men are still likely to be of-fered higher starting salaries than women. This phenomenon is also one that has remained virtually unchanged over the three decades for which we have NACE data.
Appendix 1
The Scope and Method of the NACE Survey
questionnaire requesting information about individual students with respect to salary offer, curriculum (major), type of employer (for example, manufacturing, service, and nonprofit), and job function (for example, insurance and sales). Some college placement offices simply ask students who have accepted an offer of employment to fill out the questionnaires and return them to the college placement office, which in turn sends them back to NACE. Other placement offices distribute their own ques-tionnaires to students and then use this information to fill in all or part of the NACE questionnaire. And still other colleges conduct their own salary-offer surveys and then send the results to NACE. The response rate of students is unknown. However, the annual response rate of the approximately 350 institutions that are listed in the NACE reports as participating institutions in the survey is about 50–55 percent. According to the NACE director of research, there is a certain core of schools that participate every year while others respond to the surveys in some years but not in others.
The NACE survey reports are published four times a year — in Winter, Spring, Summer and Fall; but it is the Fall issue that contains complete information on all offers reported over the recruiting year.
Appendix 2
Listing of Majors (Curricula) in Current NACE Survey
Agriculture and Natural Resources Majors
Electrical/Electronics and Mining and Mineral Engineering Nuclear Engineering
Ocean Engineering Petroleum Engineering
Quality Control/Safety Technologies Systems Engineering
Textile Sciences and Engineering Health Sciences Majors
Humanities and Social Sciences Majors
Criminal Justice and Corrections English Language and Literature/
Letters
Foreign Languages and Literatures History
Liberal Arts and Sciences/General Studies
Political Science/Government Psychology
Social Work Sociology
Visual and Performing Arts Other Humanities
Other Social Sciences Sciences Majors
Architecture and Related Programs Biological Sciences/Life Sciences Chemistry
Construction Science/Management
Environmental Sciences/Studies Geological and Related Sciences Mathematics
Physics
Other Physical Sciences
Listing of Functional Areas (Occupations) in Current NACE Survey
Systems Analysis and Design Engineering
Bioengineering Design/Construction Environmental/Sanitation Field Engineering
References
Altonji, Joseph, and Rebecca Blank. 1999. ‘‘Race and Gender in the Labor Market.’’ In Handbook of Labor Economics, 3c, ed. Orley Ashenfelter and David Card, 3143–259. Amsterdam: Elsevier.
Angle, John, and David Wissmann. 1981. ‘‘Gender, College Major, and Earnings.’’Sociology of Education54(1):25–33.
Babcock, Linda, and Sara Laschever. 2003.Women DonÕt Ask: Negotiation and the Gender Divide.Princeton, N.J.: Princeton University Press.
Black, Dan, Amelia Haviland, Seth Sanders, and Lowell Taylor. 2005. ‘‘Gender Wage Disparities among the Highly Educated.’’ Syracuse University. Unpublished.
Brown, Charles, and Mary Corcoran. 1997. ‘‘Sex-Based Differences in School Content and the Male-Female Wage Gap.’’Journal of Labor Economics15(3):431–65.
Chen, Linda, Peter Katuscak, and Emre Ozdenoren. 2005. ‘‘Why CanÕt a Woman Bid More Like a Man?’’ University of Michigan. Unpublished.
Financial/Treasury Analysis Insurance (Claims)
Insurance (Underwriting) Investment Banking (Corporate
Finance)
Investment Banking (Mergers and Acquisitions)
Investment Banking (Real Estate) Investment Banking (Sales and
Trading)
Executive, Legislative and General Finance, Taxation, Monetary
Chiswick, Barry, June OÕNeill, James Fackler, and Solomon Polachek. 1974. ‘‘The Effect of Occupation on Race and Sex Differences in Hourly Earnings.’’ American Statistical Association,Proceedings of the Business and Economic Statistics Section: 219–30. Choy, Susan, and Sonya Geis. 1997.Early Labor Force Experiences and Debt Burden. U.S.
Department of Education, National Center for Education Statistics, NCES 97–286. Daymont, Thomas, and Paul Andrisani. 1984. ‘‘Job Preferences, College Major, and the
Gender Gap in Earnings.’’Journal of Human Resources19(3):408–28. Eide, Eric. 1994. ‘‘College Major Choice and Changes in the Gender Wage Gap.’’
Contemporary Economic Policy12(2):55–64.
Gerhart, Barry. 1990. ‘‘Gender Differences in Current and Starting Salaries: The Role of Performance, College Major, and Job Title.’’Industrial and Labor Relations Review 43(4):418–33.
Graham, Mary, Julie Hotchkiss, and Barry Gerhart. 2000. ‘‘Discrimination by Parts: A Fixed-Effects Analysis of Starting Pay Differences Across Gender.’’Eastern Economic Journal 26(1):9–27.
Hecker, Daniel. 1998. ‘‘Earnings of College Graduates: Women Compared with Men.’’ Monthly Labor Review121(3):62–71.
Joy, Lois. 2000. ‘‘Do Colleges Shortchange Women? Gender Differences in the Transition from College to Work.’’American Economic Review90(2):471–75.
———. 2003. ‘‘Salaries of Recent Male and Female College Graduates: Educational and Labor Market Effects.’’Industrial and Labor Relations Review56(4):606–21.
Kirby, Jill. 2003. ‘‘Choosing to be Different: Women, Work, and the Family.’’ Centre for Policy Studies, London, England.
Loury, Linda. 1997. ‘‘The Gender Earnings Gap among College-Educated Workers.’’ Industrial and Labor Relations Review50(4):580–93.
Manning, Alan, and Joanna Swaffield. 2005. ‘‘The Gender Gap in Early-Career Wage Growth.’’ London School of Economics. Unpublished.
Morgan, Laurie. 2000. ‘‘Is Engineering Hostile to Women? An Analysis of Data from the 1993 National Survey of College Graduates.’’American Sociological Review65(2):316–21. National Association of Colleges and Employers (NACE).Salary Surveys. Bethlehem, Pa.:
various years, 1967–2001.
OÕNeill, June. 2003. ‘‘The Gender Gap in Wages, circa 2000.’’American Economic Review 93(2):309–14.
OÕNeill, June, and Solomon Polachek. 1993. ‘‘Why the Gender Gap in Wages Narrowed in the 1980s.’’Journal of Labor Economics11(1):205–28.
Paglin, Morton, and Anthony Rufolo. 1990. ‘‘Heterogeneous Human Capital, Occupational Choice, and Male-Female Earnings Differences.’’Journal of Labor Economics8(1):123–44. Polachek, Solomon. 2004. ‘‘How the Human Capital Model Explains Why the Gender Wage Gap Narrowed.’’ IZA (Institute for the Study of Labor), Discussion Paper Series No. 1102. Treiman, Donald, and Heidi Hartmann. 1981.Women, Work, and Wages: Equal Pay for Jobs of
Equal Value.Washington, D.C.: National Academy Press.
Turner, Sarah, and William Bowen. 1999. ‘‘Choice of Major: The Changing (Unchanging) Gender Gap.’’Industrial and Labor Relations Review52(2):289–313.
U.S. Department of Commerce, Census Bureau. 1995–2001. ‘‘Money Income in the United States,’’ Current Population Reports, P–60 series, various issues.
Weinberger, Catherine. 1998. ‘‘Race and Gender Wage Gaps in the Market for Recent College Graduates.’’Industrial Relations37(1):67–84.