Watching the Clocks
The Role of Food Stamp Recertification and
TANF Time Limits in Caseload Dynamics
David C. Ribar
Marilyn Edelhoch
Qiduan Liu
a b s t r a c t
We use administrative data to examine how ‘‘clock’’ policies—program time limits and recurring deadlines for confirming eligibility—affected
participation in South Carolina’s TANF and Food Stamp Programs from 1996-2003. South Carolina’s TANF program limits most families to two years of benefits in any ten-year period; so, recipients began exhausting their eligibility as early as 1998. The state’s Food Stamp Program sets regular recertification intervals that can be distinguished from other calendar effects and increased these intervals after October 2002. We find that the two-year time limit reduced TANF caseloads and that the longer recertification intervals increased food stamp caseloads.
I. Introduction
States and the federal government dramatically reformed public as-sistance programs in the 1990s, first through a series of demonstrations and waivers
David C. Ribar is a professor of economics at the University of North Carolina at Greensboro and a research affiliate of the Institute for the Study of Labor in Bonn, Germany. Marilyn Edelhoch is the Director of Research and Evaluation in the South Carolina Department of Social Services (SC DSS). Qiduan Liu is a senior research associate in the Institute for Families in Society at the University of South Carolina. This article is drawn from a longer report (Ribar, Edelhoch, and Liu 2006a). The data used in this article were obtained from the SC DSS. Other scholars may obtain the data by contacting that organization. The authors of this article will assist other scholars in that process. The authors gratefully acknowledge financial support from the U.S. Department of Agriculture (USDA) under cooperative agreement number 43-3AEM-1-80133. They thank Michael Wiseman for his help and advice and Sandy Allen, Linda Martin, and Julie Taylor for providing detailed information about public assistance policies in South Carolina. They thank Elizabeth Dagata, Karen Hamrick, Constance Newman, Chris Ruhm, and Parke Wilde and participants at numerous conferences and seminars for useful suggestions. The views expressed in this article do not necessarily reflect those of the USDA or the SC DSS.
½Submitted January 2006; accepted March 2007
ISSN 022-166X E-ISSN 1548-8004Ó2008 by the Board of Regents of the University of Wisconsin System
and ultimately through the enactment of the Personal Responsibility and Work Op-portunity Reconciliation Act (PRWORA). One way in which the PRWORA departed from past policy was the five-year lifetime limit that it placed on eligibility for fed-erally subsidized welfare benefits. As a result of the federal limit and the stricter lim-its imposed by some states, welfare recipients must now consider the time that has run off their eligibility clocks. This can lead to anticipatory effects wherein clients ‘‘bank’’ their eligibility by leaving welfare before reaching a time limit and direct mechanical effects when clients lose their eligibility at the time limit (Gittleman 1999; Grogger 2002, 2003, 2004; Grogger and Michalopoulos 2003; Swann 2005). Features of the Food Stamp Program also changed. Attention has focused on the strict provisions of the PRWORA, which eliminated eligibility for most noncitizens and established new work requirements for able-bodied adults without dependents (ABAWDs). However, subsequent legislation, especially the 2002 Farm Bill, relaxed some provisions. States also changed their administrative procedures, including their recertification policies.
Formally, food stamp eligibility is determined on a monthly basis, and recipients are supposed to report changes (or in states with simplified reporting, large changes) in their eligibility immediately. However, recipients have only weak incentives to do this. To overcome the reporting problems, states regularly require recipients to com-plete paperwork or interviews to ‘‘recertify’’ their eligibility. Recertifications are an-other clock that affect participation, both by identifying ineligible recipients and by increasing the compliance costs for recipients.
Welfare and food stamp caseloads plummeted during the late 1990s. The number of people receiving cash welfare dropped from a peak of 14 million in 1994 to six million in 2000. Despite the subsequent economic downturn, the welfare caseload fell by an additional 800,000 people by 2002 (Committee on Ways and Means 2004). Over the same time period, the food stamp caseload fell from 28 million people in 1994 to 17 million in 2000 before rebounding to 21 million in 2003 (U.S. Department of Agriculture 2004). There is considerable disagreement regard-ing the relative contributions of economic and policy changes to these trends.
In this study, we use program records from the postreform period in South Carolina to investigate how two specific ‘‘clock’’ policies—time limits and recertification intervals—affected transitions from and between food stamps and cash assistance. We also examine how other characteristics, including local economic conditions, affected these transitions.
At first glance, our strategy of using administrative data from a single state would seem to offer mostly disadvantages as it limits the variability that we can consider in economic conditions and policies, and restricts us to examining people who have been recipients of assistance. These limitations, however, need to be balanced against a number of strengths.
First and most important, the administrative data are extraordinarily detailed. They permit us to examine longitudinal behavior, including the timing of transitions and the duration of program spells. The data are not subject to the recall and nonresponse prob-lems that are common to surveys. They also include a large number of cases and are very recent, covering the entire postreform period through the recent economic downturn.
variation carefully and exploit its advantages. Several features of the policy context in South Carolina make it an excellent candidate for study. For one thing, the state’s Temporary Assistance for Needy Families (TANF) program has a short time limit that restricts most families from receiving benefits for more than two years out of any ten. Families in the state began reaching the time limits as early as 1998, which means that there are many cases and several years of followup data to study. Previous researchers have either extrapolated results from prereform data (Gittleman 1999; Moffitt and Pavetti 2000; Swann 2005) or concentrated on the anticipatory effects of policies (Grogger 2002, 2003, 2004; Grogger and Michalopoulos 2003). Our anal-yses confirm earlier findings of anticipatory effects and provide new evidence on me-chanical effects.
Also, until October 2002, South Carolina required food stamp recipients with vari-able incomes to recertify their eligibility quarterly and recipients with fixed incomes to recertify annually. After October 2002, the interval for recipients with variable incomes increased to six months. Because recertification dates are tied to when cases begin, they can be distinguished from other calendar effects. We find that families are several times more likely to leave the Food Stamp Program at recertification dates than at other dates.
In the next section, we describe policies and trends in South Carolina’s food stamp and TANF programs; we then summarize existing research on program behavior. A description of the administrative data comes next followed by descriptive and mul-tivariate analyses of the data.
II. Cash Assistance and Food Stamps in South Carolina
South Carolina’s Family Independence (FI) Program, which was implemented in October 1996 as the state’s TANF program, is one of the strictest and least generous welfare programs in the country. While most states have adopted the federal five-year time limit on assistance, South Carolina imposes an additional time limit of two years of participation in a ten-year period. Full family sanctions have been instituted, as have a family cap provision and strict work requirements. Over the period we are examining, benefits under the program were low; the maxi-mum benefit for a family of three was $205 per month. The earnings disregard and benefit reduction rate follow those of the old AFDC program.
The FI program included some ameliorative features, such as exemptions from the work requirements and time limits for disabled clients and people caring for disabled family members. South Carolina eliminated the eligibility requirements for two-parent households that had been associated with the earlier AFDC-Unemployed Par-ent program. The state also offers transitional Medicaid, childcare, and transportation assistance to ease the movement from welfare to work.
FI. In 2003, only 9 percent of food stamp households in South Carolina received TANF; the comparable national figure was 17 percent (USDA 2004).
There have been a number of changes, both restrictive and expansive, in food stamp policies since 1996. Restrictive changes came from the PRWORA, which im-posed tough work requirements on able-bodied adults without dependents and elim-inated food stamp eligibility for most noncitizens. Subsequent executive orders and legislation relaxed some of these rules.
In contrast to its policies toward cash assistance, South Carolina pursued an ac-commodating set of food stamp policies. These included applying for waivers that exempted ABAWDs in economically distressed areas from work requirements, adopting ‘‘categorical eligibility’’ rules that relaxed the treatment of assets, and con-ducting numerous outreach efforts.
South Carolina also relaxed its food stamp recertification policies. Until October 2002, the recertification period for households with earned incomes was three months, while the period for most households with fixed incomes was a year. Starting in Oc-tober 2002, clients with fluctuating incomes were only required to recertify semian-nually. There were also changes in the methods, with more recertification interviews being conducted over the phone and less stringent verification procedures being used. South Carolina’s monthly cash assistance caseload dropped by nearly two-thirds between 1996 and 2000, from just under 50,000 households to 17,000 households. The state’s food stamp caseload also declined, from 143,000 household in 1996 to 120,000 in 2000. Since 2000, the caseloads have rebounded, though in very different fashions. While the welfare caseload grew modestly and peaked at 23,000 house-holds in 2002, the food stamp caseload soared, reaching a historic high of over 200,000 families by the end of 2003.
Changes in economic circumstances undoubtedly account for some of the trends in caseloads. The state’s unemployment rate fell from 6 percent at the end of 1996 to 3.5-4.5 percent in the late 1990s before rising again in the second half of 2000. By 2003, the unemployment rate had reached 6.5 percent. While the trends in caseloads and unemployment have generally moved in the same directions, the asymmetric sizes of the caseload changes before and after the economic turning points leave con-siderable room for other explanations.
Some direct evidence indicates that policy changes have been important. With re-spect to the FI program, the South Carolina Legislative Audit Council (1998) found that three-fifths of case closures between the middle of 1996 and end of 1997 resulted from compliance failures, sanctions, and voluntary withdrawals, rather than people working their way off of welfare. The mechanical effects of time limits have also played a role, as more than 6,000 families have exhausted their eligibility. For the Food Stamp Program, the decline in the caseload coincided with the initial imple-mentation of the PRWORA restrictions, while the rise coincided with the increase in recertification intervals and the adoption of other relaxed policies.
III. Previous Research
comprehensive reviews already exist (Blank 2002; Bloomet al.2002; Grogger and Karoly 2005; Moffitt 2002), we only briefly summarize the general findings from the literature and devote more attention to research that has directly examined welfare time limits and food stamp recertifications.
A. General Findings from Cash Assistance Research
Studies of welfare participation have almost universally found that better employ-ment opportunities reduce participation. The dispute centers more on the magnitude than the existence of the relationship. Estimates range from one-tenth to two-thirds of the caseload decline being attributable to economic improvements.
Studies have also consistently found that reductions in benefits discourage welfare participation, with most estimates of the elasticity of participation with respect to changes in benefits falling between 0.2 and 0.5. From 1994–2003, South Carolina failed to adjust its welfare benefits for inflation, which meant that the real values de-clined by about one-sixth. Based on the elasticity estimates from the literature, this reduction alone would have contributed to a 3–8 percent decline in the state’s welfare caseload.
Other welfare policies also appear to have played a role in the caseload declines, though the findings regarding specific policies have been equivocal. The strongest evidence comes from the numerous experimental evaluations that were conducted of waiver policies. Synthesizing results from more than two-dozen evaluations, Grogger and Karoly (2005) concluded that the demonstrations of policies similar to South Carolina’s that required recipients to engage in work-related activities or that set time limits generally reduced participation.
B. Welfare Time Limits
Gittleman (1999) and Moffitt and Pavetti (2000) examined prereform data and calcu-lated the percentage of welfare spells that would have run longer than five years. Their extrapolations indicated that 23-41 percent of welfare recipients might reach the time limit. Swann (2005) also used prereform data but estimated a dynamic struc-tural model that incorporated forward-looking behavior. Simulations based on his model indicated that a five-year lifetime limit on welfare would reduce participation by 60 percent.
Newer observational studies have investigated people’s actual experiences with time limits and controlled for other welfare reforms. Studies by the Council of Eco-nomic Advisors (1997, 1999) and Gittleman (2001) used simple dummy variables for whether a state adopted a time limit. These studies did not consider differences in the length or applicability of time limits and obtained results that were inconclusive. In contrast, Grogger and Michalopoulos (2003) and Grogger (2002, 2003, 2004) employed a clever strategy to address the applicability issue and generated stronger findings. Their insight was that, regardless of any time limit, families lose their eli-gibility for welfare once their youngest child reaches age 18. Thus, time limits ini-tially are only binding on families with young children. Comparisons based on this quasi-experiment indicated that exposure to time limits reduced participation. Be-cause the policies had only been in place for a few years, the evidence was inter-preted as an anticipatory effect.
C. General Findings from Food Stamp Research
As with the research on cash assistance, studies of food assistance have generally found that food stamp receipt falls as economic circumstances improve. These in-clude aggregate studies of statewide caseloads and economic conditions by Daniel-son and Klerman (2005), Kabbani and Wilde (2003), Kornfeld (2002), Wallace and Blank (1999), Ziliak, Gundersen and Figlio (2003), and microstudies of participation decisions and household earnings and employment by Farrell et al. (2003), Gleason, Schochet, and Moffitt (1998), McKernan and Ratcliffe (2003), and Mills et al. (2001).
It has been more difficult to examine the impact of food stamp benefits because the annual benefit formula is identical across all states except Alaska and Hawaii. This means that nearly all of the cross-section variation in benefits is due to other state-assistance policies or personal characteristics. Fraker and Moffitt (1988) and Keane and Moffitt (1998) estimated structural econometric models that accounted for self-selection from employment and other program participation decisions and found that higher benefits encouraged food stamp use.
Only a few economic studies have examined other food stamp policies. Ziliak, Gundersen, and Figlio (2003) examined the cross-state differences in the proportion of ABAWDs who were exempt from the PRWORA work requirements and found that the exemptions modestly increased program participation. Danielson and Klerman (2006), Kabbani and Wilde (2003), and Kornfeld (2002) investigated the implemen-tation of Electronic Benefit Transfer (EBT) systems and found that these innovations also encouraged participation. Currie and Grogger (2001), however, found that EBT systems increased participation for some groups but decreased it for others, while McKernan and Ratcliffe (2003) reported only weak negative impacts from these sys-tems. Bartlett et al. (2004) conducted a more comprehensive survey of administrative policies, such as outreach efforts and operating hours, and administrator and staff attitudes across food stamp offices in different localities, and found that these admin-istrative characteristics influenced participation behavior.
D. Recertification Intervals
The U.S. General Accounting Office (1999) surveyed state Food Stamp Program directors regarding the reasons for the decline in food stamp caseloads following the enactment of the PRWORA. Most of the directors cited economic improvements, changes in eligibility associated with the PRWORA, and changes in state policies as important factors. None of them, however, felt that changes in recertification policies played a major role.
IV. Analysis Data
The data for the empirical analyses come from case management records for South Carolina’s food stamp and FI programs. From these records, we draw a 1-in-11 sample of cases with unmarried heads and children younger than age 18 that began a spell of food stamp or FI receipt between October 1996 and De-cember 2003. In our descriptive analyses, we consider simple spells of food stamp and FI receipt. In the multivariate analyses, we look at more complex spells involv-ing the receipt of food stamps alone, the receipt of FI benefits alone, and the receipt of both types of benefits together. Households may experience multiple spells.
The case records include right- and left-censored spells. In this study, spells are right-censored if they continued past December 2003 or at the first instance where information on time-varying explanatory measures was missing. We use hazard techniques to address the loss of information associated with right-censoring. Left-censored spells—spells that were ongoing as of October 1, 1996—are dropped from the analysis. This leads to a sample that is representative of new spells of benefit re-ceipt but that may not be representative of all spells.
For the remaining spells, we observe the exact start dates and either the spe-cific ending or censoring dates, making the durations nearly continuous in prin-ciple. A closer examination of the data revealed, however, that nearly all of the spells were coded to end on the last day of the month. Also, South Carolina usually only issues benefits once a month. In light of these features, we measure the spells in discrete monthly increments, starting with the first month in which benefits are paid.
The administrative records include many short breaks and short spells. For the analysis files, we smooth the information by combining spells of program participa-tion that are separated by a month or less and ignoring spells of participaparticipa-tion that last a month or less. This kind of smoothing is commonly applied in studies of caseload dynamics and can be interpreted as reflecting reasonably strong attachment or de-tachment from a program. This treatment is also consistent with policies in South Carolina, which consider program receipt spells that resume within one month of a previous spell to be a continuation of the earlier spell.
The case records designate one person who is responsible for the household’s fi-nancial decisions and in a position to provide information on its members as the ‘‘pri-mary informant.’’ Our analyses include data on the pri‘‘pri-mary informant’s age, gender, race, educational attainment, and marital status as explanatory variables. From the information available about the household, we also include measures of the number of children in the age groups 0–2, 3–5, 6–11, 12–14, and 15–17-years-old. We use information on the county of residence to link the case records to local contextual measures. In particular, we use a three-month moving average of the per capita em-ployment rate and the three-month trend in this rate as indicators of economic con-ditions. We use the population density to capture the degree of urbanization and development.
Carolina were single-adult household with children (USDA 2004).1To reduce the number of cases that we examine, we randomly select one out of every 11 house-holds who ever met the selection criteria. We further exclude cases with (a) incon-sistent spell information, (b) missing demographic or geographic data, (c) primary informants who changed over time, (d) primary informants who were younger than 18 or older than 85 years of age, and (e) child-only FI benefits. These exclusions re-duce the sample by about 10 percent. The final analysis extract contains information for 14,056 households and includes 22,759 spells (304,835 months) of food stamp receipt and 6,287 spells (47,390 months) of FI receipt. Within these spells are 5,835 spells (41,387 months) of combined food stamp and FI receipt. Appendix 1 lists the means of the variables in the analysis.
V. Descriptive Analysis of Hazard Rates
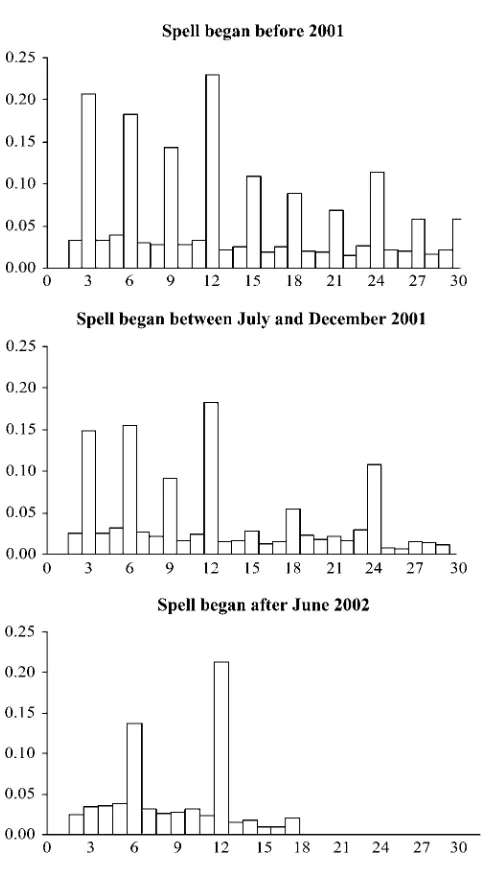
Figure 1 displays nonparametric Kaplan-Meier estimates of the haz-ard functions for the food stamp participation spells from the administrative data. Separate estimates are calculated for cohorts of households that began their spells at different times. The most striking features of the graphs are the pronounced spikes at three-, six-, and 12-month intervals. The spikes coincide with the dates when the households would have been required to recertify their eligibility and indicate that households were several times more likely to leave the Food Stamp Program in these months than in other months.
A close examination of different cohorts shows the association with recertification policy. The hazard function in the top panel corresponds to food stamp spells that began before 2001 when nearly all of the households were subject to quarterly or an-nual recertification. The middle panel shows hazard estimates for spells that began in the second half of 2001. This cohort of households was subject to quarterly and an-nual recertification for their first 12 months and semianan-nual and anan-nual recertification thereafter. The bottom panel shows estimates for spells that began in the second half of 2002 when the households were subject to semiannual and annual recertification throughout their durations. In all three graphs, the spikes in the hazard rates line up exactly with the relevant recertification schedules.2
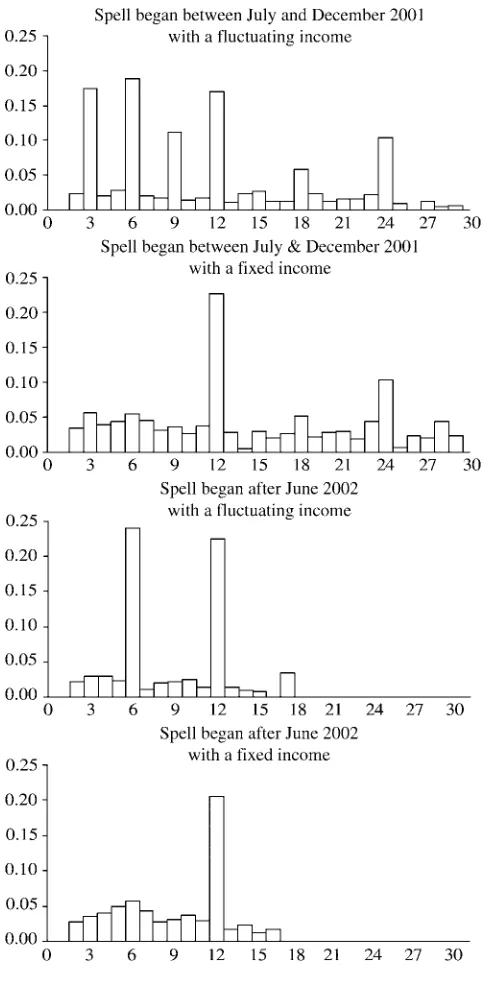
Figure 2 further disaggregates the spells by whether the case records indicated that the households initially had fluctuating or fixed incomes and were therefore subject to short or long recertification intervals. Because the administrative data do not re-cord the relevant income status before July 2001, we only report estimates for the last two cohorts from Figure 1. Figure 2 provides further evidence that the patterns in hazard functions represent the effects of recertification and not something else. The hazard functions for households that initially had fluctuating incomes have
1. A separate analysis (Ribar, Edelhoch, and Liu 2006b) examines food stamp use and employment among childless households.
Figure 1
Nonparametric Hazard Estimates of Food Stamp Program Exits for Different Entry Cohorts of Single-headed Families with Children
Note: Figures are Kaplan-Meier hazard functions, calculated using monthly administrative data from the South Carolina Department of Social Services.
Figure 2
Nonparametric Hazards of Food Stamp Program Exits for Different Entry Cohorts of Single-headed Families with Children Conditional on Initial Income Status
quarterly or semiannual spikes in the first year, while the hazard functions for house-holds with fixed incomes only have an annual spike in the first year.
Beyond the strong evidence tying recertification to the timing of food stamp exits, there is also evidence that the change in recertification policy may have led to longer spells. Survival functions (not shown) indicate that spell lengths increased across successive cohorts of recipients. The median spell length for the first cohort was just under nine months, while the median durations for the latter two cohorts were closer to 12 months. Only a quarter of the spells that began before 2001 lasted 18 months or more, while nearly half of spells that started after June 2002 reached this duration.
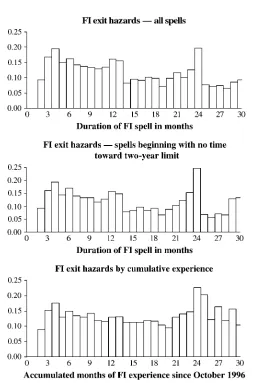
Turning to welfare exits, Figure 3 displays nonparametric hazard estimates for FI spells. The top panel shows the estimates for all of the spells from our analysis sample. On average, the monthly FI hazards are higher than the food stamp hazards, leading to much shorter spells. The median FI spell length is five months, and less than 10 percent of cases extend past 18 months. There is a noticeable spike in the 24th month of a spell, which is consistent with nonexempt households reaching the two-year time limit.
The estimates in the top panel include households that were returning to the FI program and starting their spells with time already elapsed from the two-year clock. The association between spell lengths and the time limit is clearer in the middle panel of Figure 3, which restricts the sample to spells with no prior FI experience. The shape of this hazard function is similar to that of the general sample, but the haz-ard estimates in the first 23 months for the restricted sample are slightly lower on average, while the spike at the 24th month is 25 percent higher.
Another way to examine the association with the time limit is to array the monthly hazard estimates by the accumulated amount of FI experience. We do this in the bot-tom panel of Figure 3 and again see that the hazard rate jumps in the 24th month. While the various analyses show that the hazard rates at the time limit are high, it is important to note that relatively few households actually reach this point. Of the 4,510 households in our sample that ever received FI, only 611 (14 percent) accumu-lated two years of experience.
VI. Econometric Specification
Our multivariate models use more detailed definitions of program participation and nonparticipation than do the descriptive analyses. Specifically, we consider the four possible combinations of receipt and nonreceipt among South Carolina’s Food Stamp and FI programs: receiving only food stamps (k ¼
1), receiving only FI benefits (k ¼2), receiving both types of assistance (k ¼
3), and receiving neither type of assistance (k¼4). For each combination involving benefit receipt (k¼1, 3), we model transitions to other types of receipt or nonreceipt, using a discrete-time, competing risk framework (Allison 1982). This modeling strat-egy allows us to examine program linkages. The distribution of transitions is shown in Table 1.
We adopt multinomial logit specifications to model the different types of transitions. LetT1(t) represent a vector of duration variables; letX1(t) represent a vector of other ob-served explanatory variables, and letm andhbe unobserved time-invariant variables. For the spells involving the receipt of food stamps alone, the hazard models for transi-tioning to combined food stamp and FI receipt,h13(t), and no receipt,h14(t), are
Figure 3
Nonparametric Hazard Estimates of FI Program Exits for Single-headed Families with Different Prior Program Histories
Table 1
Monthly Transitions among Program Categories
Destination category
Food stamps only (k¼1)
FI only (k¼2)
Food stamps & FI (k¼3)
Neither program (k¼4)
Total monthly observations
Origin category Food stamps only (k¼1) 245,911 11 2,761 14,765 263,448
93.3% 0.0% 1.0% 5.6% 100%
FI only (k¼2) 46 4,826 397 734 6,003
0.8% 80.4% 6.6% 12.2% 100%
Food stamps & FI (k¼3) 3,604 424 36,152 1,207 41,387
8.7% 1.0% 87.4% 2.2% 100%
Note: Estimates computed using monthly administrative data from the South Carolina Department of Social Services. Figures initalicsare percentages of transitions from within a given program category (row percentages).
220
The
Journal
of
Human
h13ðtÞ ¼
expðA#13T1ðtÞ+B#13X1ðtÞ+g13m+l13hÞ
1 + +4k¼3expðA#1kT1ðtÞ+B#1kX1ðtÞ+g1km+l1khÞ
ð1Þ
h14ðtÞ ¼
expðA#14T1ðtÞ+B#14X1ðtÞ+g14m+l14hÞ 1 + +4k¼3expðA#1kT1ðtÞ+B#1kX1ðtÞ+g1km+l1khÞ
ð2Þ
whereA1k,B1k,g1k, andl1kdenote coefficients. We do not model the 11 transitions
from spells of simple food stamp receipt to FI alone and instead treat these spells as being right-censored.
We use similar specifications to model the transitions from the receipt of FI alone to the combined receipt of food stamps and FI,h23(t), and no receipt,h24(t), (the 46 transitions to the receipt of food stamps alone are treated as censoring events) and to model the transitions from combined receipt to simple food stamp receipt,h31(t), simple FI receipt,h32(t), and no receipt,h34(t).
The random variables,mandh, which appear throughout the specifications, are in-cluded to address problems that are common to hazard models and multiple-event pro-cesses. One of these problems is spurious duration dependence that arises when unobserved heterogeneity is present. Accurate estimates of duration effects are espe-cially important in this analysis because the recertification and time limit policies are duration-related. Another problem involves associations among the series of spells that we observe for a given household. Each of our hazard models includes the time spent in previous spells, such as the total consecutive months of food stamp receipt and the cu-mulative months of FI experience, as explanatory variables. The termsmandhaccount for unmeasured characteristics of households that could lead to earlier program partic-ipation behavior being correlated with current behavior. For each of the heterogeneity terms, we follow a finite mixture approach (Heckman and Singer 1984) and specify dis-crete distributions, estimating all of the points of support and associated probabilities. The system of models, consisting of the three possibly repeating discrete-time competing-risk hazard specifications (seven transition outcomes) interlaced with the two sources of unobserved heterogeneity, is estimated using maximum likelihood with the aML software package (Lillard and Panis 2003).
VII. Multivariate Estimation Results
A. General Specification Issues
An initial step in estimating the transition models is to specify the functional forms of the baseline hazards. All of the models use piecewise-linear functions, or linear splines, to control for general spell duration effects. The splines for the baseline haz-ards in the models of transitions out of spells of receiving only food stamps (h13(t) andh14(t)) each have 14 segments: 12 three-month segments covering the first three years of a spell, a 12-month segment covering the fourth year, and a final segment thereafter.3The splines in the models of transitions from receiving only FI benefits
(h23(t) andh24(t)) have eight quarterly segments followed by a final segment, while the splines in the models of transitions from combined receipt (h31(t), h32(t) and h34(t)) have eight quarterly segments followed by two six-month segments and a final segment. The number of segments and locations of the connecting points were se-lected after some initial experimentation and specification testing.
All of the models also include linear splines to account for time-trend effects. The specifications are identical across the models with 12-month segments that corre-spond to each fiscal year through 2002 and a final segment covering all of fiscal and calendar year 2003.
In addition to the linear splines for duration dependence and calendar effects, the transition models include other controls for program effects that evolve with the spell duration. In the transition models from spells of food stamp receipt, four dummy-variable controls correspond to potential recertification months—indicators for every third and 12th month of a food stamp spell that occurs before October 2002 and indi-cators for every sixth and 12th month of a spell that occurs after that.4The dummy controls are defined relative to the start of the current spell of food stamp receipt— regardless of FI status—and are included to account for discrete jumps in the tran-sitions in recertification months. Each of the food stamp transition models also includes a linear control for the total consecutive months of food stamp receipt, again defined regardless of FI status.
The transition models also include measures of the household’s cumulative expe-rience with the FI program to examine effects associated with the household’s pro-gression toward the two-year time limit. These measures include linear splines with three segments for the first 23 months of program experience (with the splines con-necting at the end of the sixth and 12th months) and dummy indicators for 24–25 months of experience and for 26 or more months of experience. The latter two dummy measures are included to indicate households that have reached or passed the two-year limit. The model for transitions from spells of only receiving food stamps include an additional indicator for any FI experience whatsoever. In the mod-els for spells involving FI receipt, the experience measures evolve with the duration of the spell. Separate duration and experience effects in these models are identified by returning households (we would never observe any differences in the two clocks if there was no reentry or if we only considered initial participation spells). In the mod-els involving spells of only receiving food stamps, the experience effects are constant across the duration of the spell.
A second general specification issue involves the inclusion and distribution of the unobserved heterogeneity terms,mandh, and the normalization of the coefficients on these terms. We report detailed results from models with the two unobserved terms but have also estimated models with only one term and with no terms (the results are available upon request). Specification tests support the inclusion of two terms. However, there are few substantive differences in the results when more re-strictive models are estimated—the differences being mostly confined to the baseline duration controls. We report results from models with three points of support for each
4. We also estimated food stamp models that included three- and six-month dummy variables before and after October 2002. The coefficients on the six-month indicators before October 2002 and the three-month indicators afterward were jointly insignificant and usually close to zero.
of the heterogeneity terms; models with additional points of support failed to con-verge. The first term,m, is included in all of the transition models and normalized in terms of the transition with the most observations, the transition from simple food stamp receipt to no program receipt (forh14(t), we setg14¼1). Identification of the second heterogeneity term requires that it be excluded from at least one transition. Here again we use the transition from food stamps only to no program receipt (set
l14¼0). We normalizehin terms of the transition from simple FI receipt to no pro-gram receipt (forh24(t), we setl24¼1).
B. Estimation Results
Coefficient estimates and average marginal effects for the policy and economic measures from the transition models are reported in Table 2. The remaining coeffi-cient estimates for these models, including the coefficoeffi-cients for the measured house-hold characteristics, time trends, baseline hazard patterns, and unobserved heterogeneity terms, appear in Appendix 2. In both the table and appendix the first two columns list results for the models of transitions out of simple food stamp re-ceipt; the next two columns list results for the models of transitions out of simple FI receipt, while the final three columns list results for transitions out of combined receipt.
The estimates from Table 2 indicate that the food stamp and FI program policy variables are statistically and substantively important, even after other characteristics are controlled for. The single-parent households in our sample were much more likely to leave the Food Stamp Program in recertification months—at quarterly and annual intervals prior to October 2002 and at half-yearly and annual intervals subsequently—than in other months. For example, the estimated marginal effect of 0.116 for the quarterly recertification measure in the model of transitions from sim-ple food stamp receipt to no receipt is calculated as the difference of the probability of transitioning at the three-month interval (0.147) and the probability of transition-ing in another month (0.031). Thus, the probability of maktransition-ing this type of transition was nearly five times higher in potential quarterly recertification months than in other months, with the difference rising to nearly six times in potential annual recertifica-tion months.
The spikes in transition behavior during potential recertification months were larg-est for the transitions from food stamps only to no benefits. However, there were increases in other types of transitions as well. For the transitions from combined re-ceipt to no rere-ceipt, there is a large (55 percent increase), statistically significant co-efficient for the quarterly indicator as well as two other large but imprecisely estimated coefficients for the semiannual and annual indicators after October 2002. A more intriguing result is that transitions from combined receipt to simple FI receipt also rose, with the two short-interval indicators being large and statistically significant and the additional long-interval indicator for the period after October 2002 also being significant.
Table 2
Selected Coefficient Estimates and Marginal Effects from Transition Model
Transition:
Food Stamps Only to FI Only to Food Stamps and FI to
Food
3 Month (< Oct. 2002) 0.0942* 1.8012*** 20.0543 1.6639*** 0.4910***
(0.0570) (0.0239) (0.0479) (0.1436) (0.0746)
20.0005 0.1161 20.0078 0.0193 0.0135
12 Month (< Oct. 2002) 0.2272* 0.4533*** 0.1668 20.0822 0.1670
(0.1207) (0.0496) (0.1041) (0.2529) (0.1900)
0.0024 0.0262 0.0133 20.0010 0.0042
6 Month ($Oct. 2002) 20.0108 1.6399*** 0.0069 1.2073*** 0.3645
(0.1633) (0.0532) (0.1316) (0.4613) (0.2220)
20.0019 0.1346 20.0028 0.0187 0.0101
12 Month ($Oct. 2002) 0.1493 0.6381*** 20.0099 1.1964** 0.4924
(0.2404) (0.0732) (0.1975) (0.5474) (0.3313)
0.0012 0.0397 20.0046 0.0185 0.0150
Cumulative FI experience
Any FI experience 0.2921** 0.0144 (0.1249) (0.0625)
0.0027 0.0006
Spline: 0–6 Months 0.0788*** 20.0175 20.1279** 0.3857*** 0.0567** 20.0167 0.0130 (0.0265) (0.0145) (0.0540) (0.0785) (0.0249) (0.0735) (0.0414)
0.0010 20.0010 20.0123 0.0189 0.0037 20.0003 0.0002
0.0006 20.0005 0.0014 20.0029 20.0024 20.0002 20.0032 Spline: 13–23 Months 20.0126 20.0222*** 0.0667 0.0190 0.0324*** 20.0281 0.0429**
(0.0114) (0.0086) (0.0408) (0.0377) (0.0097) (0.0343) (0.0187)
20.0002 20.0010 0.0033 0.0015 0.0022 20.0003 0.0008 24–25 Months 21.1214*** 20.2386** 20.2873 1.5043*** 0.7011*** 20.0969 0.0627 (0.1944) (0.1110) (0.9832) (0.5768) (0.1121) (0.7776) (0.2749)
20.0127 20.0080 20.0480 0.2367 0.0808 20.0014 20.0018
26+ Months 21.2006*** 20.1291 20.2281 0.7751 20.0404 0.2521 20.4865*
(0.1881) (0.1105) (0.8264) (0.7462) (0.1003) (0.4617) (0.2504)
20.0132 20.0042 20.0304 0.1116 20.0023 0.0022 20.0111
County economic and population characteristics
Employment rate 0.0125** 0.0162*** 0.0201 0.0244 0.0174*** 0.0017 0.0265***
(0.0060) (0.0030) (0.0197) (0.0203) (0.0061) (0.0188) (0.0097) 0.0001 0.0008 0.0010 0.0022 0.0013 0.0000 0.0007
Employment trend 20.0733* 0.0624*** 0.0076 0.1492 0.1269*** 0.0213 0.0833
(0.0419) (0.0174) (0.1312) (0.1034) (0.0368) (0.1024) (0.0610) 20.0008 0.0033 20.0010 0.0147 0.0101 0.0000 0.0019
Population density 20.4760** 0.0211 0.4990 1.3676* 20.0387 0.1503 0.0694
(0.2014) (0.0993) (0.7017) (0.7494) (0.2003) (0.6882) (0.3140) 20.0053 0.0014 0.0168 0.1272 20.0034 0.0015 0.0019
Note: Estimates computed using monthly administrative data from the South Carolina Department of Social Services. The full set of estimation results are reported in Appendix 2. Asymptotic standard errors for the coefficients appear in parentheses. Average marginal effects appear initalics.
* Significant at 0.10 level. ** Significant at 0.05 level. *** Significant at 0.01 level.
Ribar
,
Edelhoch
and
Liu
combined receipt fell with the first six months of FI experience. The risk of transi-tioning to no receipt remained elevated over the seventh-23rd months and then spiked in the 24th month, while the risk of transitioning to combined receipt remained depressed over this same interval. For households in combined receipt spells a different picture appears. These households were generally at an increased risk of transitioning to simple food stamp receipt over the first 23 months of FI ex-perience and then at a substantially higher risk in the 24th month. Starting from the seventh month of program experience, combined-receipt households had a decreased risk of transitioning to no receipt. There was no strong association between program experience and combined-receipt households transitioning to simple food stamp re-ceipt.
For households that were only receiving food stamps, the risk of transitioning to combined receipt—that is, of entering FI—increased with the first 12 months of FI experience, remained elevated through the next 11 months, then dropped sharply once the households reached 24 months. In contrast, the probability of food-stamp-only households transitioning to no receipt more consistently fell with FI experience. One implication of these two patterns is that households that reached the FI time limit were substantially more likely than other households to remain de-pendent on food stamps.
The economic results near the bottom of the table are in the anticipated directions. Higher employment rates were associated with more transitions from both simple and combined food stamp receipt to no receipt. Higher employment rates were also associated with transitions from combined receipt to simple food stamp receipt. Economic growth was positively associated with transitions from simple food stamp receipt to no receipt and from combined receipt to simple food stamp receipt and negatively associated with transitions from simple food stamp receipt to com-bined receipt. While there were several statistically significant associations between the economic variables and the transition outcomes, the sizes of the associations were very modest. Consider a relatively large hypothetical change in employment that increased both the average rate and the growth rate by a full percentage point. Such a change would have contributed to less than a half a percent increase in the transition rate from simple food stamp receipt to no receipt, a quarter of a percent increase in the transition rate from combined receipt to no receipt, and just over a 1 per-cent increase in the transition rate from combined receipt to simple food stamp receipt. The results for the other observed controls, as reported in Appendix 2, are mostly consistent with expectations. Female- and black-headed households were less likely than other households to make transitions from program receipt to no receipt. The youngest household heads were the least likely to transition out of simple FI receipt or to transition from combined receipt to no receipt; however, they were the most likely to transition out of simple food stamp receipt. The number of children was negatively associated with the probability of transitioning from simple or combined food stamp receipt to no receipt and positively associated with the probability of transitioning from simple FI receipt to combined receipt. Among households that were only receiving food stamps, those with more adults, more educated heads, and formerly married heads were more likely to transition to no receipt.
of transition were also likely to make others or put another way, could be broadly categorized as ‘‘movers’’ or ‘‘stayers.’’ The coefficients for the second unmeasured characteristic,h, are less uniform and only significant for three types of transitions. The results indicate that households that had a high risk of transitioning from simple FI receipt to no receipt also had higher risks of transitioning from combined receipt to FI receipt and no receipt.
C. Simulation Results
The estimates from the transition models indicate that recertification intervals in the Food Stamp Program, the two-year time limit in the FI program, and economic con-ditions each affected the timing of different types of program transitions. The mag-nitudes of these associations with participation outcomes are harder to determine because of the cumulative nature of the transition processes and our consideration of simple and combined program spells. To give a better sense of the magnitudes, we use the estimated coefficients and the observed characteristics of our sample to conduct a partial simulation of caseload outcomes.
The simulation is partial because our models only examine some of the relevant processes that make up the caseload. In particular, we have not modeled initial pro-gram entry or reentry behavior. For our simulations, we take the initial entry as given in the data. For each household that then appears, we simulate possible program tran-sitions under different conditions. When a household completely trantran-sitions out of assistance, we use year-specific averages of the observed monthly reentry rates from no receipt to each of our program outcomes to account for movements back onto the programs. Thus, our procedure treats the observed entry and reentry behavior as be-ing fixed and only considers changes in the caseload that are associated with transi-tions between and exits from the programs. The simulatransi-tions also do not account for spells that were ongoing as of October 1996. Results for the simulations are reported in Table 3.
The top rows in Table 3 show the simulated average monthly caseloads in each calendar year from 1998 through 2003 using the actual data from our sample and the procedures described above. This baseline simulation reproduces the caseload statistics for our sample, with each year’s simulated food stamp caseload estimate being within20.7 to 2.4 percent of the sample averages and the simulated FI
case-loads being within 0.8 to 7.2 percent of the sample averages.
We examine the implications of recertification by comparing outcomes from the baseline simulation, which includes the October 2002 change in recertification inter-vals, with outcomes under the assumption that there was no change. The simulations indicate that the higher exit rates associated with the extra recertifications would have reduced the ‘‘new-spell’’ portion of the 2003 caseload by 7.9 percent.
In the next set of figures, we consider what would have happened if there were no FI experience effects in the models. For these simulations, we allow the spell dura-tion clocks to run but do not allow the experience clocks to run after the first month. The simulations indicate that FI caseloads would have risen by about a fifth in each year and the food stamp caseloads would have been little affected.
Table 3
Simulated Caseload Changes Under Different Conditions
Simulated Monthly Number of Households Receiving Simulated Percent Change in Households Receiving
Food
1998 23,752 692 5,177 28,929 5,869
1999 29,422 700 4,656 34,078 5,356
2000 31,444 637 4,927 36,371 5,564
2001 37,987 806 6,469 44,456 7,275
2002 46,956 961 7,574 54,530 8,535
2003 57,854 818 7,642 65,496 8,460
Quarterly recertification intervals maintained after October 2002
2002 46,752 966 7,573 54,325 8,539 20.4 0.5 0.0 20.4 0.0
2003 52,833 850 7,514 60,347 8,364 28.7 3.9 21.7 27.9 21.1
Two-year FI time limit eliminated
1998 23,380 973 5,547 28,927 6,520 21.6 40.6 7.1 0.0 11.1
1999 28,811 1,137 5,323 34,134 6,460 22.1 62.4 14.3 0.2 20.6
2000 30,759 1,003 5,756 36,515 6,759 22.2 57.5 16.8 0.4 21.5
2001 37,104 1,204 7,461 44,565 8,665 22.3 49.4 15.3 0.2 19.1
2002 45,777 1,489 8,873 54,650 10,362 22.5 54.9 17.2 0.2 21.4
2003 56,446 1,340 9,131 65,577 10,471 22.4 63.8 19.5 0.1 23.8
2001 37,708 783 6,304 44,012 7,087 20.7 22.9 22.6 21.0 22.6
2002 46,178 919 7,398 53,576 8,317 21.7 24.4 22.3 21.7 22.6
2003 56,893 795 7,469 64,362 8,264 21.7 22.8 22.3 21.7 22.3
No time-trend effects after FY 2000
2000 31,448 640 4,907 36,355 5,547 0.0 0.5 20.4 0.0 20.3
2001 36,455 753 6,020 42,475 6,773 24.0 26.6 26.9 24.5 26.9
2002 41,239 778 6,632 47,871 7,410 212.2 219.0 212.4 212.2 213.2
2003 48,423 716 6,911 55,334 7,627 216.3 212.5 29.6 215.5 29.8
Note: Simulations obtained by applying transition model coefficients to monthly administrative data from the South Carolina Department of Social Services. The cal-culations use the actual entry behavior and average yearly reentry rates from the administrative data. Therefore, the simulations only reflect changes that arise from changes in exit rates and between-program transitions—entry and reentry behavior are effectively held constant.
Ribar
,
Edelhoch
and
Liu
2000 values. The results indicate that the ‘‘new spell’’ food stamp and FI caseloads would have only been slightly lower. Finally, the last set of figures examines the con-tribution of the time-trend variables, which account for other unmeasured policy and economic changes. As with the employment rate simulation, we freeze the time-trend controls at their July 2000 values. The time time-trends (unexplained factors) ac-count for nearly two-thirds of the food stamp caseload growth by 2003 as well as most of the FI caseload growth.
VIII. Conclusion
Our descriptive and multivariate analyses of household-level pro-gram data from South Carolina indicate that food stamp recertification intervals and TANF time-limit policies strongly affect the timing of exits, the length of assis-tance spells and ultimately caseloads in the relevant programs. Nonparametric esti-mates of the timing of food stamp exits show that exits were much more likely to occur during months when households were required to recertify their eligibility than in other months. The estimated sizes of the effects are very large. In the multivariate analyses, the transition rates out of the Food Stamp Program were five to six times higher in recertification months than other months. Median spell lengths for food stamp participation increased by nearly three months after South Carolina increased its recertification intervals for households with earnings, and we estimate that the portion of the caseload that we were able to examine rose by 8 percent.
Analyses of FI participation spells indicate that there is a marked increase in the hazard of leaving the program at the second anniversary, which is consistent with families exhausting their time limits. Our multivariate analysis revealed that a fam-ily’s probability of leaving the FI program generally increased with its accumulated experience on the program and spiked when its experience reached two years. The results buttress earlier findings by Grogger and Michalopoulos of anticipatory, or banking, effects of time-limit policies and provide new evidence of mechanical, or eligibility-exhaustion, effects. The estimated associations are also large; we calculate that the two-year time limit decreased the portion of the caseload that we could ob-serve by roughly one-fifth.
Consistent with other studies, we find that changing economic conditions were as-sociated with caseload movements. Our estimates, however, are in the lower range of what has been previously reported. Policy changes appear to have played a much big-ger role in South Carolina.
As food stamp caseloads continue to swell and as more families either are diverted from or exhaust their eligibility for TANF, the Food Stamp Program is becoming a more important part of the safety net. Issues associated with the administration of food stamps are also becoming more prominent. We have shown that recertification is a significant ‘‘bump in the road’’ for food stamp recipients. Further research is needed to determine whether (for whom, and under what conditions) recertification is a useful screen that removes ineligible families from the program, an obstacle that keeps some eligible families from renewing their participation, or some combination of the two.
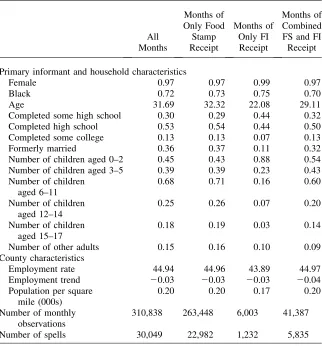
Table A1
Primary informant and household characteristics
Female 0.97 0.97 0.99 0.97
Black 0.72 0.73 0.75 0.70
Age 31.69 32.32 22.08 29.11
Completed some high school 0.30 0.29 0.44 0.32
Completed high school 0.53 0.54 0.44 0.50
Completed some college 0.13 0.13 0.07 0.13
Formerly married 0.36 0.37 0.11 0.32
Number of children aged 0–2 0.45 0.43 0.88 0.54
Number of children aged 3–5 0.39 0.39 0.23 0.43
Number of children
Number of other adults 0.15 0.16 0.10 0.09
County characteristics
Employment rate 44.94 44.96 43.89 44.97
Employment trend 20.03 20.03 20.03 20.04
Population per square
Number of spells 30,049 22,982 1,232 5,835
Table A2
Complete Estimation Results from Transition Model
Transition:
Food Stamps Only to FI Only to Food Stamps and FI to
Food
3 Month (< Oct. 2002) 0.0942* 1.8012*** 20.0543 1.6639*** 0.4910***
(0.0570) (0.0239) (0.0479) (0.1436) (0.0746)
12 Month (< Oct. 2002) 0.2272* 0.4533*** 0.1668 20.0822 0.1670
(0.1207) (0.0496) (0.1041) (0.2529) (0.1900)
6 Month ($Oct. 2002) 20.0108 1.6399*** 0.0069 1.2073*** 0.3645
(0.1633) (0.0532) (0.1316) (0.4613) (0.2220)
12 Month ($Oct. 2002) 0.1493 0.6381*** 20.0099 1.1964** 0.4924
(0.2404) (0.0732) (0.1975) (0.5474) (0.3313)
Cumulative FI experience
Any FI experience 0.2921** 0.0144 (0.1249) (0.0625)
Spline: 0–6 Months 0.0788*** 20.0175 20.1279** 0.3857*** 0.0567** 20.0167 0.0130 (0.0265) (0.0145) (0.0540) (0.0785) (0.0249) (0.0735) (0.0414) Spline: 7–12 Months 0.0357** 20.0097 0.0283 20.0221 20.0361** 20.0288 20.1052***
(0.0167) (0.0117) (0.0523) (0.0463) (0.0145) (0.0428) (0.0260)
24–25 Months 21.1214*** 20.2386** 20.2873 1.5043*** 0.7011*** 20.0969 0.0627 (0.1944) (0.1110) (0.9832) (0.5768) (0.1121) (0.7776) (0.2749)
26+ Months 21.2006*** 20.1291 20.2281 0.7751 20.0404 0.2521 20.4865*
(0.1881) (0.1105) (0.8264) (0.7462) (0.1003) (0.4617) (0.2504)
County economic and population characteristics
Employment rate 0.0125** 0.0162*** 0.0201 0.0244 0.0174*** 0.0017 0.0265***
(0.0060) (0.0030) (0.0197) (0.0203) (0.0061) (0.0188) (0.0097)
Employment trend 20.0733* 0.0624*** 0.0076 0.1492 0.1269*** 0.0213 0.0833
(0.0419) (0.0174) (0.1312) (0.1034) (0.0368) (0.1024) (0.0610)
Population density 20.4760** 0.0211 0.4990 1.3676* 20.0387 0.1503 0.0694
(0.2014) (0.0993) (0.7017) (0.7494) (0.2003) (0.6882) (0.3140)
Personal and household characteristics
Black 0.1413*** 20.3616*** 0.2445 20.5288*** 20.0337 20.5409*** 20.3913*** (0.0507) (0.0245) (0.1639) (0.1638) (0.0469) (0.1508) (0.0729)
Female 0.1125 20.1954*** 0.4752 20.9201* 0.0359 0.3619 20.3265*
(0.1628) (0.0519) (0.5257) (0.5570) (0.1409) (0.5825) (0.1683) Spline for age 18–25 20.0887*** 20.0103 0.2331*** 0.1433*** 0.0149 20.0125 0.0506**
(0.0139) (0.0081) (0.0418) (0.0460) (0.0136) (0.0409) (0.0213) Spline for age 25–50 20.0200*** 20.0133*** 20.0153 0.0085 20.0189*** 20.0163 20.0064
(0.0046) (0.0021) (0.0218) (0.0261) (0.0048) (0.0161) (0.0071) Spline for age 50 and older 20.0557*** 20.0346*** 0.0661 20.7643 20.0493 20.1038 0.0117
(0.0211) (0.0067) (0.3752) (0.8691) (0.0444) (0.2556) (0.0646) Children ages 0–2 0.0464 20.1585*** 0.2477* 0.2659** 0.0017 0.0862 20.1454**
(0.0371) (0.0206) (0.1320) (0.1337) (0.0378) (0.1156) (0.0620)
(continued)
Ribar
,
Edelhoch
and
Liu
Table A2(continued)
Transition:
Food Stamps only to FI Only to Food Stamps and FI to
Food
Children ages 3–5 20.0799** 20.1654*** 0.3817*** 0.1167 20.0007 20.1749 20.2004*** (0.0378) (0.0205) (0.1134) (0.1484) (0.0367) (0.1305) (0.0643) Children ages 6–11 20.0647** 20.1147*** 0.2385* 20.0272 20.0158 20.0941 20.1292***
(0.0281) (0.0144) (0.1263) (0.1820) (0.0282) (0.1064) (0.0481) Children ages 12–14 20.0305 20.0634*** 0.1094 0.3230 20.0506 20.1370 20.1682**
(0.0478) (0.0213) (0.2304) (0.2884) (0.0474) (0.1704) (0.0814) Children ages 15–17 20.1743*** 0.0324 0.4104 20.5865 0.1074* 20.2934 0.0377
(0.0592) (0.0250) (0.2883) (0.3903) (0.0570) (0.2148) (0.0901)
Other adults 20.0519 0.1621*** 20.1369 20.1348 0.0135 0.7265*** 0.0390
(0.0561) (0.0242) (0.1696) (0.1850) (0.0642) (0.1444) (0.0996)
Formerly married 0.0809 0.1214*** 0.2535 0.0974 20.0052 0.2020 20.0286
(0.0524) (0.0261) (0.2058) (0.2547) (0.0513) (0.1772) (0.0812) Some high school 20.1013 20.0540 20.1517 20.6160* 0.0546 0.3970 20.2229
(0.1097) (0.0560) (0.3148) (0.3400) (0.1186) (0.3568) (0.1471) Completed high school 20.1094 0.1313** 20.0262 20.2874 0.1243 0.3054 20.1575
(0.1084) (0.0549) (0.3180) (0.3377) (0.1160) (0.3617) (0.1437) Completed some college 20.1493 0.3164*** 0.0678 20.1007 0.1294 0.5077 20.1202
(0.1214) (0.0604) (0.3870) (0.4011) (0.1251) (0.3960) (0.1606)
(0.0205) (0.0117) (0.0483) (0.0841) (0.0272) (0.1048) (0.0278) FY 1997–98 20.0406*** 0.0024 20.0224 0.1064*** 0.0563*** 0.0719** 20.0408***
(0.0110) (0.0051) (0.0301) (0.0296) (0.0110) (0.0339) (0.0151)
FY 1998–99 20.0061 0.0038 0.0097 20.0599** 20.0090 0.0056 0.0383***
(0.0101) (0.0043) (0.0310) (0.0268) (0.0090) (0.0263) (0.0148)
FY 1999–2000 0.0265*** 0.0055 0.0426 0.0247 0.0002 20.0052 20.0138
(0.0089) (0.0041) (0.0298) (0.0285) (0.0089) (0.0258) (0.0151) FY 2000–2001 20.0120 20.0298*** 20.0549* 20.0464 20.0265*** 20.0285 20.0185
(0.0084) (0.0041) (0.0287) (0.0286) (0.0085) (0.0255) (0.0151)
FY 2001–2002 0.0016 20.0123*** 20.0123 0.0006 0.0064 20.0381 0.0199
(0.0081) (0.0043) (0.0292) (0.0270) (0.0080) (0.0280) (0.0137)
FY 2002– 20.0366*** 20.0010 0.0377 20.0025 20.0052 20.0255 20.0178
(0.0079) (0.0041) (0.0270) (0.0243) (0.0071) (0.0327) (0.0136)
Spell duration and other controls
Intercept 25.3694*** 29.3177*** 212.1131*** 211.5415*** 29.6664*** 214.4247*** 211.2415*** (1.2502) (1.7635) (3.0041) (3.0717) (1.3256) (2.7469) (1.7307) Spline: 0–3 Months 20.1950*** 0.5610*** 20.7266*** 0.8209*** 1.1161*** 0.9281*** 1.3742***
(0.0387) (0.0296) (0.1152) (0.1702) (0.0608) (0.1625) (0.1162) Spline: 4–6 Months 20.1067*** 20.0265** 0.2594** 20.1308 20.1049*** 0.0838 20.0508
(0.0311) (0.0106) (0.1091) (0.0895) (0.0270) (0.0746) (0.0440) Spline: 7–9 Months 0.0081 20.0848*** 0.0465 20.0850 20.0188 20.0680 0.0214
(0.0378) (0.0131) (0.1317) (0.0912) (0.0306) (0.0856) (0.0516) Spline: 10–12 Months 20.0268 0.1199*** 0.0977 0.3029*** 0.0550 0.2175** 0.1281*
(0.0479) (0.0190) (0.1641) (0.1173) (0.0395) (0.1058) (0.0740)
(continued)
Ribar
,
Edelhoch
and
Liu
Table A2(continued)
Transition:
Food Stamps only to FI Only to Food Stamps and FI to
Food
Spline: 13–15 Months 20.1142** 20.1886*** 20.3090 20.1288 20.2077*** 20.1465 20.1161 (0.0570) (0.0237) (0.2191) (0.1592) (0.0541) (0.1592) (0.1090) Spline: 16–18 Months 0.1262** 0.0022 0.4069 20.0301 0.0447 20.2970 20.1959
(0.0625) (0.0251) (0.2665) (0.2120) (0.0701) (0.3150) (0.1592) Spline: 19–21 Months 20.1478** 20.0175 20.7143 0.2253 20.0033 0.5012 20.1467
(0.0689) (0.0300) (0.4659) (0.2278) (0.0813) (0.3299) (0.2400) Spline: 22–24 Months 0.1061 0.0674** 0.5339 0.0835 20.0828 20.2664 0.5618**
(0.0813) (0.0325) (0.8928) (0.3022) (0.0943) (0.4396) (0.2502) Spline: segment 9a 20.1709* 20.0357 20.1269 20.4209 20.0255 0.0214 20.0064
(0.0969) (0.0373) (0.5473) (0.3407) (0.0635) (0.2787) (0.1171)
Spline: segment 10a 20.1096 0.0069 20.1337 0.1713 0.0502
(0.1281) (0.0424) (0.0872) (0.2713) (0.1413)
Spline: segment 11a 0.2215 20.1683*** 0.0500 0.0518 0.0528
(0.1373) (0.0571) (0.0344) (0.0600) (0.0615)
Spline: segment 12a 20.1134 0.1367** (0.1095) (0.0564) Spline: segment 13a 20.0013 20.0088
(0.0288) (0.0126) Spline: segment 14a 20.0499** 0.0048
Unobserved heterogeneity parameters
g 0.6863*** 1.0000 1.0913*** 0.9617** 0.5957*** 0.2529 0.6797***
(0.1136) (0.3771) (0.4106) (0.1151) (0.2343) (0.1956)
l 20.0839 0.1206 1.0000 20.0254 0.5955*** 0.0754*
(0.0811) (0.1315) (0.0440) (0.1030) (0.0396)
m1 m2 m3 h1 h2 h3
Points 20.6064 4.3610** 5.2416*** 21.1066 0.2454 3.8817***
(1.7240) (1.7354) (0.3951) (0.6621)
Probabilities 0.01 0.63 0.36 0.51 0.42 0.07
Note: Estimates computed using monthly administrative data from the South Carolina Department of Social Services. Asymptotic standard errors appear in parentheses. * Significant at 0.10 level.
** Significant at 0.05 level. *** Significant at 0.01 level.
a. Definitions of duration spline segments vary across models and are described in text.
Ribar
,
Edelhoch
and
Liu
References
Allison, Paul D. 1982. ‘‘Discrete-Time Methods for the Analysis of Event Histories.’’ Sociological Methodology13:61–98.
Bartlett, Susan, Nancy Burstein, William Hamilton, and Ryan Kling. 2004. ‘‘Food Stamp Program Access Study: Final Report.’’ E-FAN Report 03-013-3. Washington, D.C.: U.S. Department of Agriculture.
Blank, Rebecca. 2002. ‘‘Evaluating Welfare Reform in the United States.’’Journal of Economic Literature40(4):1105–66.
Bloom, Dan, Mary Farrell, Barbara Fink, and Diana Adams-Ciardullo. 2002. ‘‘Welfare Time Limits: State Policies, Implementation and Effects on Families.’’ Report to the U.S. Department of Health and Human Services. New York: MDRC.
Committee on Ways and Means, U.S. House of Representatives. 2004.Green Book: Background Material and Data on Programs within the Jurisdiction of the Committee on Ways and Means, http://waysandmeans.house.gov/Documents.asp?section¼813.
Council of Economic Advisors. 1997. ‘‘Explaining the Decline in Welfare Receipt, 1993–1996.’’ Washington, D.C.: Executive Office of the President of the United States. ———. 1999. ‘‘The Effects of Welfare Policy and the Economic Expansion on Welfare
Caseloads: An Update.’’ Washington, D.C.: Executive Office of the President of the United States.
Currie, Janet, and Jeffrey Grogger. 2001. ‘‘Explaining Recent Declines in Food Stamp Program Participation.’’Brookings-Wharton Papers on Urban Affairs.(2001):203–44. Danielson, Caroline, and Jacob A. Klerman. 2006. ‘‘Why Did the Food Stamp Caseload
Decline (and Rise)? Effects of Policies and the Economy.’’ Oakland, Calif.: University of California. Unpublished.
Farrell, Mary, Michael Fishman, Matthew Langley, and David Stapleton. 2003. ‘‘The Relationship of Earnings and Income to Food Stamp Participation: A Longitudinal Analysis.’’ E-FAN Report no. 03-011. Washington, D.C.: U.S. Department of Agriculture. Fraker, Thomas, and Robert A. Moffitt. 1988. ‘‘The Effect of Food Stamps on Labor Supply:
A Bivariate Selection Model.’’Journal of Public Economics35(1):25–56.
Gittleman, Maury. 1999. ‘‘Time Limits on Welfare Receipt.’’Contemporary Economic Policy 17(2):199–209.
———. 2001. ‘‘Declining Caseloads: What do the Dynamics of Welfare Participation Reveal?’’Industrial Relations40(4):537–70.
Gleason, Philip, Peter Schochet, and Robert Moffitt. 1998. ‘‘The Dynamics of Food Stamp Program Participation in the Early 1990s.’’ Report to the U.S. Department of Agriculture. Princeton, N.J.: Mathematica Policy Research, Inc.
Grogger, Jeffrey. 2002. ‘‘The Behavioral Effects of Welfare Time Limits.’’American Economic Review92(2):385–89.
———. 2003. ‘‘The Effects of Time Limits, the EITC, and Other Policy Changes on Welfare Use, Work, and Income among Female-Headed Families.’’Review of Economics and Statistics85(2):394–408.
———. 2004. ‘‘Time Limits and Welfare Use.’’Journal of Human Resources34(3):405–24. Grogger, Jeffrey, and Lynn Karoly. 2005.Welfare Reform: Effects of a Decade of Change.
Cambridge, Mass.: Harvard University Press.
Grogger, Jeffrey, and Charles Michalopoulos. 2003. ‘‘Welfare Dynamics under Time Limits.’’ Journal of Political Economy111(3):530–54.
Heckman, James, and Burton Singer. 1984. ‘‘A Method for Minimizing the Impact of Distributional Assumptions in Econometric Models of Duration Data.’’Econometrica 52(2):271–320.
Kabbani, Nader, and Parke Wilde. 2003. ‘‘Short Recertification Periods in the U.S. Food Stamp Program.’’Journal of Human Resources38(Supplement): 1112–38.
Keane, Michael, and Robert Moffitt. 1998. ‘‘A Structural Model of Multiple Welfare Program Participation and Labor Supply.’’International Economic Review39(3):553–89. Kornfeld, Robert. 2002. ‘‘Explaining Recent Trends in Food Stamp Program Caseloads.’’
E-FAN Report no. 02-008. Washington, D.C.: U.S. Department of Agriculture.
Lillard, Lee, and Constantijn Panis. 2003.aML Multilevel Multiprocess Statistical Software, Version 2.0.Los Angeles, Calif.: EconWare, Inc.
McKernan, Signe-Mary, and Caroline Ratcliffe. 2003. ‘‘Employment Factors Influencing Food Stamp Program Participation.’’ E-FAN Report no. 03-012. Washington, D.C.: U.S. Department of Agriculture.
Mills, Bradford, Sundar Dorai-Raj, Everett Peterson, and Jeffrey Alwang. 2001. ‘‘Determinants of Food Stamp Program Exits.’’Social Service Review75(4):539–58. Moffitt, Robert. 2002. ‘‘The Temporary Assistance for Needy Families Program.’’ NBER
Working Paper No. W8749. Cambridge, MA: National Bureau of Economic Research. Moffitt, Robert, and LaDonna Pavetti. 2000. ‘‘Time Limits.’’ InFinding Jobs: Work and
Welfare Reform, ed. David Card and Rebecca Blank, 507–35. New York: Russell Sage Foundation.
Ribar, David, Marilyn Edelhoch, and Qiduan Liu. 2006a. ‘‘South Carolina Food Stamp and Well-being Study: Transitions in Food Stamp Participation, TANF Participation and Employment among Families with Children.’’ Contractor and Cooperator Report no. CCR-17. Washington, D.C.: U.S. Department of Agriculture.
———. 2006b. ‘‘South Carolina Food Stamp and Well-being Study: Transitions in Food Stamp Participation and Employment among Adult-Only Households.’’ Contractor and Cooperator Report no. CCR-18. Washington, D.C.: U.S. Department of Agriculture. South Carolina Legislative Audit Council. 1998. ‘‘Impact of the South Carolina Family
Independence Act.’’ Columbia, SC: South Carolina General Assembly.
Staveley, Jane, David Stevens, and Parke Wilde. 2002. ‘‘The Dynamics of Food Stamp Program Entry and Exit in Maryland.’’ Baltimore, Md.: University of Baltimore. Unpublished.
Swann, Christopher. 2005. ‘‘Welfare Reform when Recipients are Forward-Looking.’’ Journal of Human Resources40(1):31–56.
U.S. Department of Agriculture. 2004. ‘‘Characteristics of Food Stamp Households: Fiscal Year 2003.’’ Washington, D.C.: U.S. Department of Agriculture, Food and Nutrition Service, Office of Analysis, Nutrition and Evaluation.
U.S. General Accounting Office. 1999.Food Stamp Program: Various Factors Have Led to Declining Participation.Washington, D.C.: U.S. General Accounting Office.
Wallace, Geoffrey, and Rebecca Blank. 1999. ‘‘What Goes Up Must Come Down? Explaining Recent Changes in Public Assistance Caseloads.’’ InEconomic Conditions and Welfare Reform, ed. Sheldon Danziger, 49–89. Kalamazoo, Mich.: W.E. Upjohn Institute for Employment Research.