Natural Disasters
Lisa Cameron
Manisha Shah
Cameron and Shahabstract
We investigate whether experiencing a natural disaster affects risk- taking behavior. We conduct standard risk games (using real money) with randomly selected individuals in rural Indonesia. We fi nd that individuals who recently suffered a fl ood or earthquake exhibit more risk- aversion. Experiencing a natural disaster causes people to perceive that they now face a greater risk of a future disaster. We conclude that this change in perception of background risk causes people to take fewer risks. We provide evidence that experimental risk behavior is correlated with real- life risk behavior, highlighting the importance of our results.
I. Introduction
Over the last decade, direct losses from natural disasters in the de-veloping world averaged US$35 billion annually. These losses are increasing and are more than eight times greater than the losses suffered as a result of natural disasters during the 1960s (EM- DAT 2009). Three main categories of natural disasters account for 90 percent of the world’s direct losses: fl oods, earthquakes, and tropical cyclones. A disproportionate share of the deaths and damage caused by such environmental shocks is borne by people in developing countries (Kahn 2005). Developing coun-tries are not necessarily more susceptible to natural disasters but the impact is often more severe due to poor building practices and lack of adequate infrastructure. The
Lisa Cameron is a professor in the Department of Econometrics and Business Statistics at Monash University in Australia. Manisha Shah is an associate professor in the Department of Public Policy at the University of California, Los Angeles and a Faculty Research Fellow at the NBER. The authors thank Abigail Barr, Marianne Bitler, Ethan Ligon, Simon Loertscher, Mark Rosenzweig, Laura Schechter, John Strauss, and Tom Wilkening for helpful comments. Lucie Tafara Moore provided excellent research as-sistance. They are also indebted to Bondan Sikoki and Wayan Suriastini for assistance in the design and implementation of the survey. The authors gratefully acknowledge funding from the Australian Research Council, #DP0987011. The data used in this article can be obtained beginning November 2015 through October 2018 from Manisha Shah, UCLA Department of Public Policy, 3250 Public Affairs Building, Los Angeles, CA 90095. Telephone 310- 825- 2455, Fax Number 310- 206- 0337, email: ManishaShah@ucla.edu. [Submitted January 2013; accepted March 2014]
ISSN 0022- 166X E- ISSN 1548- 8004 © 2015 by the Board of Regents of the University of Wisconsin System
enormity of these losses has focused attention on how natural disasters can undermine countries’ long- term efforts to attain and sustain economic growth (Freeman 2000). This is becoming an increasingly important issue as climate change scientists have predicted an increase in the frequency of disasters like fl oods and tropical cyclones (IPCC 2001).
Natural disasters are traumatic events and it is thus likely that they affect individu-als’ behavior in the short and possibly longer term. If natural disasters affect people’s perceptions of the riskiness of their environment, then experiencing a disaster can be thought of as an addition of background risk, and if people are “risk- vulnerable,” in the sense of Gollier and Pratt (1996), they will then exhibit more risk- averse behavior. This could have potential dampening effects on post recovery growth if, for example, people are less willing to be entrepreneurial, particularly because aid money is often infused into natural disaster sites just after the disaster occurs and consequently the cost of more risk- averse behavior at this time is heightened. Psychological theories, however, suggest that individuals who already live in high- risk environments may not be particularly concerned about the addition of small independent risks or that individuals may react emotionally (as opposed to cognitively) and exhibit more risk- loving behavior. Thus, the question is an empirical one.
We investigate the relationship between natural disasters and individuals’ risk- taking behavior using experimental data from Indonesia. Our identifi cation strategy is simple. We exploit geographic variation in the timing of natural disasters in an area where any village could be hit by an earthquake or fl ood. Our study area, East Java, is highly vulnerable to such events.
Our results are consistent with the concept of risk- vulnerability. We fi nd that indi-viduals in villages that suffered a fl ood or earthquake in the past three years exhibit higher levels of risk- aversion compared to like individuals in villages that did not experience a disaster. Individuals who have experienced an earthquake or a fl ood in the past three years are seven percentage points less likely to make risky choices. This is a large effect and translates into a 41 percent decrease in the probability of making a risky choice. Recent disasters affect risk- taking behavior even after we control for the mean occurrence of earthquakes and fl oods over the previous 30 years. We also show that these results are likely not biased due to selection of residential location or migration patterns and that the effects of particularly severe shocks are long lasting.
Natural disasters change people’s beliefs. We show that individuals who recently experienced a natural disaster perceive the world to be a riskier place. People (inaccu-rately) update their perception of background risk after experiencing a disaster. They report unrealistically high probabilities that another will occur in the next year and that it will be severe. These perceptions persist for several years. Our results are consistent with Di Tella, Galiani, and Schargrodsky (2007) and Malmendier and Nagel (2011) in fi nding that different experiences (of land reform and macroeconomic shocks re-spectively) lead to differing beliefs and different behavior. Even more in line with our results is Callen et al. (2014), which fi nds that fearful recollections of individuals exposed to violence in Afghanistan trigger changes in risk and certainty preferences.
The economics literature on natural disasters is relatively new. However, recent papers have examined the impact of natural disasters on outcomes such as macro-economic output (Noy 2009), income and international fi nancial fl ows (Yang 2008a), migration decisions (Halliday 2006; Paxson and Rouse 2008; Yang 2008b), fertility and education investments (Baez, de la Fuenta, and Santos 2010; Finlay 2009; Portner 2008; Yamauchi, Yisehac, and Quisumbing 2009), and even mental health (Franken-berg et al. 2008). A small number of working papers examine the effect of natural disasters on risk- taking behavior and discount rates in various developing countries (Callen 2011; Cassar, Healy, and von Kessler 2011; van den Berg, Marrit, and Burger 2009) with similar results to what we fi nd here—that risk- taking decreases as a result of natural disasters. Our paper aims to provide greater certainty that these results are not simply due to selection and examines pathways that might explain this result. This is an important question as risk- taking behavior determines many crucial household decisions related to savings and investment behavior (Rosenzweig and Stark 1989), fertility (Schultz 1997), human capital decisions (Strauss and Thomas 1995), and tech-nology adoption (Liu 2013), and natural disasters are becoming increasingly prevalent all over the world. Therefore, the results from this paper have important ramifi cations for various household decisions that infl uence economic development.
II. Why Should Natural Disasters Affect Risk Behavior?
It seems likely that natural disasters would affect individuals’ risk choices. For example, disasters may change individuals’ perceptions of the risk they face. In a world of perfect information, individuals will have accurately formed expec-tations as to the probability of such an event occurring. This constitutes their estimate of background risk associated with natural disasters. In this world, although a natural disaster imparts no new information, natural disasters affect behavior through their impact on estimates of average background risk.
Alternatively, a natural disaster may constitute a “shock” that contains new informa-tion and may cause estimates of risk to be updated. We argue this is a more natural way to think of a disaster. It is diffi cult to think of victims of recent disasters as not being shocked by the event and reappraising the world in which they live. For ex-ample, living through a large earthquake may make individuals perceive the world as a riskier place than prior to the event. In this case, even if one controls for the long- term prevalence of disasters, recent disasters may affect current risk- taking behavior. If this shock is incorporated in expectations of background risk, then it will have a long- term effect on behavior. A possible alternative, though, is that the “shock’’ associated with a disaster only affects people’s expectations and behavior in the short term. With time, the impact on their behavior dissipates.
A further way in which disasters are likely to affect risk- taking behavior is through their effect on income and wealth. Disasters destroy physical property and reduce income earning opportunities. It is well established in the economics literature that wealth is negatively associated with risk- aversion. Our data allow us to explore all three of these potential avenues below.
increase risk- aversion to other independent risks (Eeckhoudt, Gollier, and Schlesinger 1996; Guiso and Paiella 2008; and Gollier and Pratt 1996). Gollier and Pratt (1996) and Eeckhoudt, Gollier, and Schlesinger (1996) derive the necessary and suffi cient restric-tions on utility such that an addition of background risk will cause a utility- maximizing individual to make less risky choices. Gollier and Pratt (1996) defi nes this property as “risk vulnerability” and shows that with such preferences adding background risk increases the demand for insurance. However, psychological evidence of diminishing sensitivity suggests that if the level of risk is high, people may not be particularly con-cerned about the addition of a small independent risk (Kahneman and Tversky 1979). Lerner and Keltner (2001) shows that fearful people express more pessimistic and risk- averse choices. Quiggin (2003), using nonexpected utility theories based on probability weighting, shows that for a wide range of risk- averse utility functions, independent risks are complementary rather than substitutes. That is, aversion to one risk will be reduced by the presence of an independent background risk.
Empirically, the evidence testing these theories is quite limited. Heaton and Lucas (2000), using survey data from the United States, fi nds that higher levels of back-ground risk are associated with reduced stock market participation. Guiso and Pai-ella (2008) shows that the consumer’s environment affects risk- aversion and that individuals who are more likely to face income uncertainty or to become liquidity constrained exhibit a higher degree of absolute risk- aversion. Lusk and Coble (2008) analyzes individuals’ choices over a series of lottery choices in a laboratory setting in the presence and absence of uncorrelated background risk. It fi nds that adding abstract background risk generates more risk- aversion, although it does not fi nd the effect to be quantitatively large. Eckel et al. (2009) examines risk- aversion in the context of Hurricane Katrina evacuees in the United States. Its results differ from ours as it fi nds that the evacuees exhibit more risk- loving behavior. It subscribes such behavior to the emotional state of the participants shortly after the hurricane.
III. Indonesia and Natural Disasters
Indonesia is particularly prone to natural disasters. It regularly experi-ences fl oods, earthquakes, volcanic eruptions, drought, forest fi res, tropical cyclones, and landslides. In this paper, we focus on the two most commonly occurring natural disasters both in terms of frequency of events and numbers of people affl icted—fl oods and earthquakes (EM- DAT 2009).1
Our study site is rural East Java. The province of East Java covers approximately 48,000 square kilometers of land and is home to approximately 37 million people, making it one of the most densely populated largely rural areas on earth with almost
800 people per square kilometer. Seventy percent of its population lives in rural areas and farming is the main occupation. The population is predominantly Muslim and eth-nically Javanese with a signifi cant Madurese minority. Village life is largely traditional with village heads and elders playing important roles in village decision- making.
The majority of East Java is fl at (0–500 meters above sea level) and relatively fertile. Flooding generally occurs because water fi lls river basins too quickly and the rainwater cannot be absorbed fast enough. The entire province of East Java suffers high- intensity risk from both earthquakes and fl oods (see Figures 1 and 2 in the online appendix, associ-ated with this article at http://uwpress.wisc.edu/journals). Our sample covers six districts that span the length of the province of East Java.2 The fi gures illustrate that no region
in our East Java sample is immune from these natural disasters. However, whether an earthquake and/or fl ood strikes a village in a given time period is obviously unpredictable.
IV. Data and Experimental Design
Our sample consists of approximately 1,550 individuals spread across 120 rural villages in six districts of the province of East Java. These individuals par-ticipated in experimental games that will be explained in detail below. The individuals were members in households that had previously been surveyed as part of a random-ized evaluation. The baseline survey was conducted in August 2008 and the experi-ments were conducted in October 2008. Both were conducted prior to the program be-ing introduced and so for our purposes constitute a random sample of the population, except that only households with children were sampled.3 The risk game (based on
Binswanger 1980) was played with an adult household member. An important advan-tage of this game design is that it is easily comprehended by subjects outside the usual convenient sample of university students. In addition, our sample size is much larger than previous research using similar risk games with real stakes. The survey collected information on the standard array of socioeconomic variables. A community- level survey was also administered to the village head.
The risk game was conducted as follows. Individuals were asked to select one gamble from a set of six possible gambles. Each gamble worked as follows. The experimenter showed the player he had two marbles, a blue one and a yellow one. He would put the mar-bles behind his back and shake them in his hands. Then he would take one marble in each hand and bring them forward telling the player he had one marble concealed in each hand. The player would pick one hand. If the player picked the hand containing the blue marble, she would win the amount of money shown on the blue side of the table. If she picked the
2. Our sample is drawn from the district of Ngawi in the west of the province; Jombang and Blitar in the center; and Probolinggo, Bondowoso, and Situbondo in the west. The sample does not include any districts on the island of Madura, which is part of East Java province.
hand containing the yellow marble, the player would win the amount of money shown on the yellow side of the table.4 Before playing the risk game, the experimenter went through
a series of examples with each player. When it was clear that the player understood the game, money was put on the table to indicate the game for real stakes would begin.5
The six 50- 50 gamble options each player was given are summarized in Table 1. Gamble A gives the participant a 50 percent chance of winning Rp10,000 and a 50 per-cent chance of winning Rp10,000, hence it involves no risk. The risk associated with each gamble increases as the player progresses down the table, with Choice F being the riskiest. The expected values of the winnings in this game range from Rp10,000 to Rp20,000 where the expected value increases until Choice E. Note that Choice E and F have the same expected return but F has a higher variance so only a risk- neutral or risk- loving person would take the step from E to F. In terms of the magnitude of the stakes, one day’s wage in this region is approximately Rp10,000. Therefore, the potential winnings are quite substantial. Players can win anywhere from one to four days’ income. Because the stakes are substantial, we expect individuals to exhibit aversion (Arrow 1971; Rabin 2000).
Table 1 also summarizes the frequency of gamble choices that players made. Over-all, the distribution is quite similar to other studies that have played similar risk games (for example, see Binswanger 1980; Barr and Genicot 2008; Cardenas and Carpenter 2008, for a review). Barr and Genicot (2008) plays the same risk game based on Binswanger (1980) in a number of Zimbabwean villages. Interestingly, both of the tails on our distribution are slightly fatter than their Round 1 data, especially on the lower end. This heavier lower end may be consistent with the large number of natural disasters in East Java increasing risk- aversion.
A. Estimating Risk- Aversion Parameters
We calculate two different risk measures. We fi rst use a simple measure of risk atti-tudes. We defi ne those individuals who selected Choice E or F as exhibiting “risk- tolerant” (=1) behavior and all others are defi ned as “non- risk- tolerant” (= 0). We choose Choices E and F as they are the riskiest choices an individual can make and have the same expected value. This measure does not require any assumptions about individuals’ utility functions. In addition, we construct an alternate measure of risk- aversion (following much of the experimental economics literature) by estimating risk- aversion parameters assuming constant relative risk- aversion (CRRA) CES util-ity: (c)=c(1−␥)/ (1−␥). These are presented in Column 8 of Table 1. For each
indi-vidual, we solve for his/her ␥ based on the choice made in the game. 6
T
he
J
ourna
l of H
um
an Re
sourc
es
Table 1
Gamble Choices: Payoffs, Expected Values, and Levels of Risk- Aversion
Gamble Choice 1
Frequency (Percentage) (Disaster=1)
2
Frequency (Percentage) (Disaster=0)
3
Low Payoff
4
High Payoff
5
Expected Value
6
Variance in Payoffs
7
Partial Risk- Aversion
Coeffi cient 8
Gamble A 16.7 17.7 10,000 10,000 10,000 0 (7.51, ∞)
Gamble B 19.4 13.8 9,000 19,000 14,000 5,000 (1.74, 7.51)
Gamble C 22.2 22.9 8,000 24,000 16,000 8,000 (0.81, 1.74)
Gamble D 30.6 28.5 6,000 30,000 18,000 12,000 (0.32, 0.81)
Gamble E 4.9 9.3 2,000 38,000 20,000 18,000 (0, 0.32)
Gamble F 6.3 7.8 0 40,000 20,000 20,000 (- ∞, 0)
B. Measures of Natural Disaster
The measures of natural disaster are obtained from three different data sets: a level survey that was administered to the village head in each community in 2008; the PODES (Potensi Desa), a survey conducted by the Indonesian Statistical Agency in every village of Indonesia every three years; and seismology data from the U.S. Geo-logical Survey (USGS) website.7 We use three different data sets as they measure
natu-ral disasters in different ways (occurrence, frequency, total damage in dollar amount, distance from epicenter), but our results are consistent regardless of the data set and measure of natural disaster we employ, illustrating the robustness of the results. In the community- level survey, heads responded yes/no as to whether their village had experienced an earthquake and/or fl ood and, if yes, when it occurred. Approximately 10 percent of our villages experienced a fl ood or earthquake between 2005 and 2008. None of the villages experienced both types of natural disasters during this period but a few experienced more than one fl ood.
We also employ data from PODES to construct measures of the intensity of natural disasters for our villages. The respondent is a village representative, most often the village head. Using the 2008 PODES, we generate a measure of the total value of ma-terial damage due to fl oods and/or earthquakes from 2005–2008 for each village. The average amount of damage during this period was reported as 46 million rupiah (or $4,650) with the maximum damage reported at approximately $122,000. In addition, some of the villages in our sample experienced more than one fl ood from 2005–2008. Therefore, we also construct a continuous measure of number of disasters (which varies from zero to six) for the same time period using the PODES data. The mean number of disasters is 0.43. There were no reported deaths caused by earthquakes or fl oods during this period in our sample villages. Although these are disasters severe enough to cause material damage, none were severe enough to cause death.8
We also construct an additional measure of earthquake intensity using seismology data from the USGS, restricting the data to every earthquake that occurred between 2005 and 2008 (the same years as our other natural disaster data described above) and that registered above 3.5 on the Richter scale. We restrict earthquake occurrences to the latitude and longitude of the province of East Java (7°16’S, 112°45’E). Distance between each village in the sample and the earthquake epicenter is calculated for the largest magnitude earthquake each year and then we take the average over the three years to generate one measure of earthquake intensity per village per year.
There are many reasons to use this seismology data in addition to the PODES and community- level survey data. First, although there is little reason to believe the village head would not provide accurate information on natural disasters, using the seismol-ogy data removes any concerns about reporting errors and/or measurement error and also the possible subjectivity of the information given.9 Second, different villages
might engage in different ex ante disaster mitigation strategies, such as building
struc-7. See http://earthquake.usgs.gov/earthquakes/eqarchives/epic/epic_global.php.
8. In a previous version of the paper, we constructed separate variables for earthquakes and fl oods. Here we group the two categories. The results are largely unaffected.
tures so that they are more able to withstand earthquakes and investing in drainage infrastructure. This raises the potential for unobserved factors associated with disaster prevention and risk attitudes to drive our results. Using the seismology data means such unobservables cannot be driving our results because treatment is simply a func-tion of geographic locafunc-tion and is not a funcfunc-tion of infrastructure investment or biased reporting.
Ideally, we would also use rainfall data as a similar proxy for fl ooding. However, Indonesia only has a small number of rainfall stations. As our sample is geographically clustered across only six of Indonesia’s over 400 districts, the measured rainfall data does not vary enough to be closely correlated with fl ooding that we have at the village level. In fact, due to missing data and few rainfall stations, the rainfall data generates a maximum of only three different values across our 120 villages each year of our sample periods.
Finally, we construct historical measures of the mean number of disasters in each of our villages. We use data from the PODES in 2008, 2006, 2003, 2000, 1993, 1990, and 1983 to construct a measure going back 28 years to 1980.10 We use these means as
measures of the historical occurrence of natural disasters in each village. We can think of these means as measuring background risk. The coeffi cients on recent disasters will then tell us if these recent events have an additional effect.
The USGS data also allow us to construct another historical measure of earthquake intensity back to 1973. The same method described above is employed: Distance be-tween each village in the sample and the earthquake epicenter is calculated for the largest magnitude earthquake each year and then we take the average over all years back to 1973. We use this as an additional historical measure of earthquakes instead of the PODES data. Using this historical seismology data gives us the same benefi ts described above in that USGS earthquake occurrences cannot be biased by reporting and/or infrastructure investments.
V. Summary Statistics
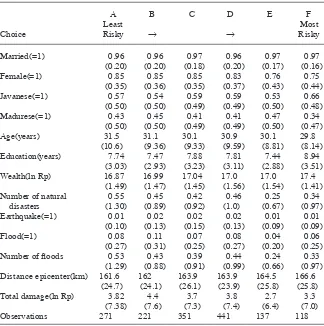
Summary statistics by risk game choice are presented in Table 2. Risk choices do not vary by marital status. However, females are less likely to choose the riskier options, which is consistent with the experimental literature.11 In addition, as
we might expect, younger, more educated, and wealthier individuals are more likely to select riskier options. We defi ne “wealth” as the sum of the value of all assets the household owns (such as house, land, livestock, household equipment, jewelry) and then take the natural log. In terms of natural disasters, the summary statistics in Table 2 indicate that individuals who have experienced an earthquake or fl ood in the past three years are less likely to choose more risky options. Further, individuals who live in villages that have experienced more disasters in the last three years make less risky choices. In addition, individuals in villages farther away from the epicenter of large earthquakes are more likely to choose the riskier options. Below, we investigate whether these trends remain once we control for a range of observable characteristics.
VI. Empirical Strategy
Our empirical strategy is simple. We regress the risk measure on the various natural disaster measures while controlling for household, individual, geo-graphic characteristics, and district fi xed effects. We cluster all specifi cations at the village level. More specifi cally, we estimate regressions:
yiv= ∝+1DISASTERv+2Xi+␦+εiv
where i indexes individuals and v villages. The dependent variable, yiv, is the risk measure (we use two different measures); control variables in Xi include age, educa-tion, marital status, ethnicity, river dummy, and the mean of natural disasters over Table 2
Summary Statistics by Risk Choice
Choice
A Least Risky
B
→
C D
→
E F
Most Risky
Married(=1) 0.96 0.96 0.97 0.96 0.97 0.97 (0.20) (0.20) (0.18) (0.20) (0.17) (0.16) Female(=1) 0.85 0.85 0.85 0.83 0.76 0.75
(0.35) (0.36) (0.35) (0.37) (0.43) (0.44) Javanese(=1) 0.57 0.54 0.59 0.59 0.53 0.66
(0.50) (0.50) (0.49) (0.49) (0.50) (0.48) Madurese(=1) 0.43 0.45 0.41 0.41 0.47 0.34
(0.50) (0.50) (0.49) (0.49) (0.50) (0.47) Age(years) 31.5 31.1 30.1 30.9 30.1 29.8
(10.6) (9.36) (9.33) (9.59) (8.81) (8.14) Education(years) 7.74 7.47 7.88 7.81 7.44 8.94
(3.03) (2.93) (3.23) (3.11) (2.88) (3.51) Wealth(ln Rp) 16.87 16.99 17.04 17.0 17.0 17.4
(1.49) (1.47) (1.45) (1.56) (1.54) (1.41) Number of natural 0.55 0.45 0.42 0.46 0.25 0.34 disasters (1.30) (0.89) (0.92) (1.0) (0.67) (0.97) Earthquake(=1) 0.01 0.02 0.02 0.02 0.01 0.01
(0.10) (0.13) (0.15) (0.13) (0.09) (0.09) Flood(=1) 0.08 0.11 0.07 0.08 0.04 0.06
(0.27) (0.31) (0.25) (0.27) (0.20) (0.25) Number of fl oods 0.53 0.43 0.39 0.44 0.24 0.33
(1.29) (0.88) (0.91) (0.99) (0.66) (0.97) Distance epicenter(km) 161.6 162 163.9 163.9 164.5 166.6
(24.7) (24.1) (26.1) (23.9) (25.8) (25.8) Total damage(ln Rp) 3.82 4.4 3.7 3.8 2.7 3.3
(7.38) (7.6) (7.3) (7.4) (6.4) (7.0) Observations 271 221 351 441 137 118
time; and is district fi xed effects. The measures of natural disasters (at the village level) are denoted by DISASTERv.
We exploit geographic variation in the timing of natural disasters in a region where any of the villages in the sample could be hit by an earthquake or fl ood. The fi gures in the online appendix illustrate that no region in our East Java sample is immune from these natural disasters. However, when one will occur is unpredictable. The histori-cal data support this conjecture. Using the USGS data going back to 1973, our entire sample of villages was within 50 kilometers from an epicenter of an earthquake (over 3.5 Richter scale). Further, 67 percent of the sample villages report having experienced a fl ood or an earthquake in the preceding 28 years (using PODES data).
A. Potential Selection Bias
One obvious concern with this identifi cation strategy is that individuals who live in villages that experienced earthquakes and fl oods in the past three years might be dif-ferent from individuals who live in villages that did not experience these natural disas-ters. For example, it is possible that wealthier individuals choose to live in villages that do not experience fl ooding and are more likely to choose the riskier option (because of their wealth). This could introduce a correlation between fl ood and risk choice that is not causal. Similarly, villages that experienced a natural disaster in the past three years might be different from villages that did not. For example, villages that experienced a natural disaster might provide worse public goods than villages that did not, again introducing a correlation between natural disasters and risk- aversion that is not causal.
We argue that such selectivity is unlikely because village of residence in East Java is largely a function of family roots and ties to the land and community are strong. Furthermore, all of rural East Java is in an earthquake and fl ood zone and experts are unable to predict when and where an earthquake will occur, and no village in our sample is immune from the risk of these shocks. Exposure to fl ooding risk is, however, largely governed by proximity to rivers and poor drainage. However, again, all vil-lages in East Java are susceptible to high annual fl ood risk.
Table 3
No friends to borrow money(=1) 0.22 0.25 0.03
(0.03) (0.01) (0.04)
Participates in conditional cash transfer(=1) 0.03 0.04 –0.01
(0.013) (0.005) (0.02)
Subsidized rice buyer(=1) 0.83 0.83 0.004
(0.03) (0.01) (0.03)
Household on river bank(=1) 0.02 0.02 0.001
(0.003) (0.001) (0.01)
Probability of earthquake in next year 18.2 16.8 1.4
(1.58) (0.571) (1.83)
Perceived fl ood impact 1.79 0.93 0.86***
(0.089) (0.33) (0.106)
Perceived earthquake impact 0.84 0.96 –0.12
(0.099) (0.036) (0.115)
Observations 144 1,394
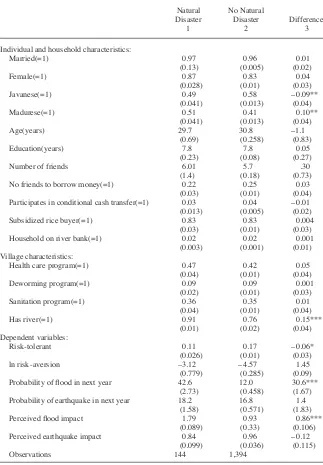
disaster activity. All of our regressions control for ethnicity. We also test various mea-sures of household poverty, such as whether the household participates in the condi-tional cash transfer program (Keluarga Harapan), health insurance program for the poor (Askeskin), and whether they have access to subsidized rice. None of these measures are signifi cantly different from one another suggesting households are equally poor across the types of villages. Because living on the river bank is the riskiest place to live in terms of risk of fl ood, we also test if that differs by natural disaster status. It does not.
In the middle part of Table 3, we present summary statistics from the level survey. We investigate whether the extent of public goods provision and program access differ across village types because some part of fl ooding is caused by poor drainage. Again, we fi nd no signifi cant differences. Natural disaster and nonnatural di-saster villages in the past three years provide the same health and sanitation programs and have similar population sizes. We do fi nd that natural disaster villages are signifi -cantly more likely to have a river in close proximity. All of the empirical specifi cations below include a variable that indicates whether the village is on a river. If risk- averse individuals are less likely to settle in fl ood- prone areas, then we would expect this variable to be positive and signifi cant. However, it is not statistically signifi cant in any of the specifi cations. We also check for other infrastructure differences such as electrifi cation. Ninety- nine percent of our sample villages have electric lighting in the main street regardless of natural disaster status. Further, all households in both natural disaster and nonnatural disaster villages use electricity.
B. Migration
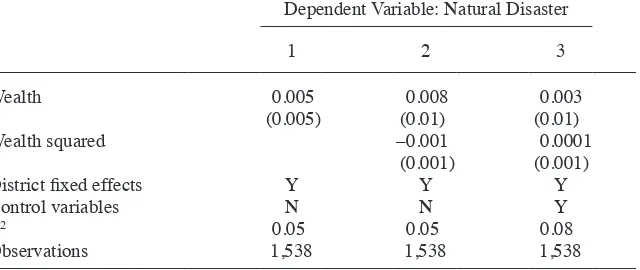
To further examine the extent to which selectivity is likely to be a problem, we ex-amine migration rates by natural disaster status. A followup survey on these same Table 4
Do the Wealthier Households Escape Natural Disasters?
Dependent Variable: Natural Disaster
1 2 3
Wealth 0.005 0.008 0.003
(0.005) (0.01) (0.01)
Wealth squared –0.001 0.0001
(0.001) (0.001)
District fi xed effects Y Y Y
Control variables N N Y
R2 0.05 0.05 0.08
Observations 1,538 1,538 1,538
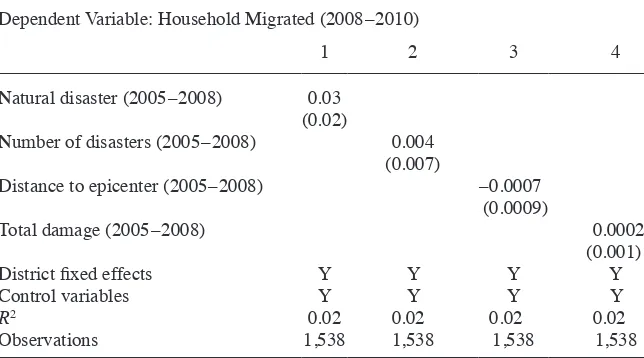
households was conducted in December 2010, thereby informing us which households moved and dropped out of the sample between 2008 and 2010. Approximately 5 per-cent of the sample moved outside the village during this period. Therefore, we can test whether experiencing a natural disaster from 2005–2008 impacted the decision to move during this period. In Table 5, we regress the decision to migrate on our vari-ous measures of natural disaster. All specifi cations are clustered at the village level, include district level fi xed effects, and control for ethnicity, gender, age, education, marriage, and river dummies. We fi nd that regardless of the natural disaster measure we use, experiencing a natural disaster is not signifi cantly associated with the prob-ability of moving. Therefore, it does not seem to be the case that there is differential migration due to natural disasters.
To further examine this issue, we examine migration rates using data from another data set: the fi rst and second waves of the Indonesian Family Life Survey (IFLS). The IFLS is a panel of over 7,000 Indonesian households.12 The 1993 wave provides
in-formation on natural disasters between 1990 and 1993. The 1997 wave identifi es what percentage of individuals has moved between 1993 and 1997, both within the village and beyond the village. Between 1990 and 1993, 14.4 percent of IFLS communities in rural Indonesia experienced a fl ood or an earthquake. In villages that experienced a fl ood or an earthquake in rural Indonesia, 16.2 percent of individuals over the age
12. IFLS1 (1993) and IFLS2 (1997) were conducted by RAND in collaboration with Lembaga Demografi , University of Indonesia. For more information, see http://www.rand.org/labor/FLS/IFLS/.
Table 5
Natural Disasters and Migration Behavior
Dependent Variable: Household Migrated (2008–2010)
1 2 3 4
Natural disaster (2005–2008) 0.03
(0.02)
Number of disasters (2005–2008) 0.004
(0.007)
Distance to epicenter (2005–2008) –0.0007
(0.0009)
Total damage (2005–2008) 0.0002
(0.001)
District fi xed effects Y Y Y Y
Control variables Y Y Y Y
R2 0.02 0.02 0.02 0.02
Observations 1,538 1,538 1,538 1,538
of 15 (n=1,752) migrated in the following three years versus 16.7 percent in villages that did not (n=9,897). This difference is not statistically signifi cant (p- value=0.63).13
We also investigate the composition of migrants to check whether different types of individuals are migrating by disaster status, thus changing the composition of rural communities. We look at various characteristics such as age, gender, marital status, education, and employment in rural Indonesia and test whether characteristics of mi-grants differ by natural disaster status. For example, our results might be biased if we fi nd that younger men are more likely to be migrating from disaster areas (because they are generally more risk- loving) relative to nondisaster areas. This would imply that more risk- averse individuals are left behind in the villages that experience di-sasters, biasing our fi ndings upward. We fi nd that migrants from disaster villages are 25.4 years old on average (compared to 25.7 years old in nondisaster villages) and 52.2 percent are male (compared to 53.8 percent in nondisaster villages). Therefore, it is not the case that migrants from villages that experienced disasters are more likely to be male or younger. In addition, migrants from villages that experienced a disaster completed 3.07 years of education on average compared to 3.30 years in nondisaster villages, and 72 percent of migrants from disaster villages are currently employed (compared to 65.2 percent in nondisaster villages). None of these differences are sta-tistically signifi cant. The only characteristic that differs signifi cantly across disaster and nondisaster villages is marital status. Married individuals (both male and female) are more likely to migrate when the village experiences a natural disaster (51.2 percent of migrants from disaster villages are married versus 42.2 percent, p- value=0.04). Note though that our regressions indicate that being married does not affect risk- aversion. Thus compositional differences in migrants are unlikely to be driving our results.14
VII. Empirical Results
Columns 1–4 in Table 6 present the results from simple linear prob-ability models where the dependent variable is “risk- tolerant” (a player who selected one of the two riskiest choices, E or F, in the risk game).15 All specifi cations cluster
standard errors at the village level and include district- level fi xed effects. We include district fi xed effects to control for any potential differences at the district level that might affect our results such as public goods provisions, government programs, and/
13. To check the migration statistics for a sample closer to our rural East Java sample, we conduct the same analysis for rural Java. In villages that experienced a fl ood or an earthquake in rural Java, 15.6 percent of individuals over the age of 15 migrated in the following three years versus 13.9 percent in villages that did not. Though the point estimate suggests that natural disasters may increase the likelihood of migration, again, this difference is not statistically signifi cant (p-value=0.16).
14. A further possibility is that people who dislike living in natural disaster environments have been migrat-ing out over time (for many years). If this is the case, then it is likely that our results are lower bounds. These individuals who have left are more likely to be risk-averse individuals since they dislike living in risky, natural disaster environments. In addition, we examine whether disasters cause contemporaneous long-term migration. We do this using our main data set and the USGS data on earthquakes between 2008 and 2010 and also using the IFLS data on migration and fl oods and earthquakes between 1994 and 1997. Both sets of results show no relationship between disasters and contemporaneous migration.
or geographic differences. The control variables include age, marital status, gender, education, ethnicity, and a dummy indicating whether the village is on a river. We also control for the mean number of natural disasters in the village between 1980 and 2008. The coeffi cient on disasters between 1980 and 2008 will tell us the effect of mean background risk on behavior. The coeffi cient on recent disasters will tell us whether recent disasters affect risk- taking, controlling for background risk.16
In Column 1, we include an indicator for whether the village experienced a natural disaster in the previous three years. It indicates that individuals who have experienced a fl ood or an earthquake in the past three years are seven percentage points less likely to choose Option E or F. This is a large effect (41 percent) because the mean of the dependent variable is 0.17. This result is statistically signifi cant at the 0.05 level.
In Columns 2–4 of Table 6, we introduce the three different measures of natural disaster from the PODES and USGS data described above. When we include the con-tinuous measure of disasters in Column 2 instead of the disaster dummy in Column 1, the results indicate that for a one standard deviation increase in disasters (which is equivalent to one disaster), individuals are 2 percent less likely to choose Option E or F. In Column 3, we show that the further away from the epicenter of the earthquake, the more likely the individual is to choose one of the risky options. In Column 4, we include the measure of the total amount of monetary fl ood and earthquake damage (in log Indonesian rupiah). This variable is negatively signed but not statistically signifi -cant at standard levels.
Interestingly, the coeffi cient on the measure of background risk, the mean occur-rence of fl oods and earthquakes from 1980–2008, is negative. This is consistent with people who live in villages that experienced more disasters between 1980 and 2008 being less likely to take risks, but it is not statistically signifi cant. We also regress the risk measures on the mean distance to epicenter (1973–2008) using the USGS seismology data. Being closer to earthquake epicenters is signifi cantly associated with making less risky choices. A one standard deviation increase in distance to the epi-center (approximately 30 kilometers) during the period 1973–2008 makes a person 9 percent more likely to choose the risky option. This result is statistically signifi cant at the 0.01 percent level. The coeffi cient on mean fl oods in this specifi cation is not statistically signifi cant (results available upon request).
Columns 5–8 present the coeffi cients from tobit interval regression where the de-pendent variable is the natural log of the interval of the relative risk- aversion param-eters. All specifi cations allow errors to be clustered at the village level and include dis-trict fi xed effects and the same set of control variables as Columns 1–4. The results are very similar except that now the coeffi cient on total damage is signifi cant at the 0.10 level. Experiencing a disaster is on average associated with an 86 percent increase in the relative risk- aversion parameter. Education is also now statistically signifi cant in these regressions, and we fi nd that more educated players take more risk. As we might expect, women and older individuals are less likely to be risk- tolerant in all specifi ca-tions. Note also that the variable indicating proximity of the community to a river is
Table 6
Do Natural Disasters Affect Risk- Taking?
Dependent Variable: Risk- Tolerant Interval of ln
1 2 3 4 5 6 7 8
Natural disaster (2005–2008) –0.07
(0.03)**
0.86 (0.52)*
Number of disasters (2005–2008) –0.02
(0.01)**
0.51 (0.21)**
Distance to epicenter (2005–2008) 0.004
(0.002)**
–0.07 (0.03)**
Total damage (2005–2008) –0.003 0.06
(0.002) (0.03)*
Mean natural disasters (1980–2008) –0.03 –0.02 –0.03 –0.02 0.36 0.17 0.33 0.24
(0.03) (0.04) (0.03) (0.04) (0.61) (0.72) (0.62) (0.69)
Married 0.04 0.04 0.04 0.04 –0.66 –0.67 –0.66 –0.67
(0.05) (0.05) (0.05) (0.05) (0.95) (0.95) (0.95) (0.95)
Female –0.12 –0.11 –0.11 –0.12 2.15 2.14 2.02 2.18
(0.03)*** (0.03)*** (0.03)*** (0.03)*** (0.58)*** (0.57)*** (0.56)*** (0.57)***
Madurese 0.008 –0.01 –0.009 –0.01 1.63 2.03 1.88 1.91
(0.13) (0.13) (0.13) (0.13) (3.12) (3.13) (3.02) (3.13)
Javanese –0.008 –0.03 –0.01 –0.02 1.1 1.45 1.18 1.25
501
(0.003) (0.003) (0.003) (0.003) (0.07)** (0.07)** (0.07)** (0.07)**
Rivers 0.04 0.03 0.03 0.03 –0.68 –0.53 –0.68 –0.56
(0.02) (0.02) (0.02) (0.02) (0.47) (0.45) (0.47) (0.45)
District fi xed effects Y Y Y Y Y Y Y Y
R2 0.02 0.02 0.02 0.02 0.03 0.03 0.03 0.03
Observations 1,538 1,538 1,538 1,538 1,538 1,538 1,538 1,538
not statistically signifi cant and suggests that selectivity of residence on the basis of risk attitudes is not a problem.17
A. Does History Matter?
To examine the longevity of the impact, we regress the measures of risk on the his-torical measures of natural disaster constructed from our data and the PODES data. The results are presented in Table 7. In Column 1, we estimate OLS regressions where the dependent variable is risk- tolerant, and in Column 2 we estimate interval regres-sions and the dependent variable is the interval of ln␥. All models have errors
clus-17. Callen et al. (2014) fi nds that individuals exposed to violence exhibit an increased preference for cer-tainty. We examine whether exposure to natural disasters has the same effect by defi ning a dependent variable to equal 1 if the individual chose Gamble A, which paid Rp 10,000 with certainty and 0 otherwise. Experienc-ing a natural disaster has no signifi cant effect on the probability of choosing this gamble.
We also examine the role played by time preferences. To the extent that risk preferences are correlated with discount rates, the risk-aversion results could be refl ecting changes in time preferences. In our survey, we asked a series of questions along the lines of “Would you prefer X today or Y in a month?” where Y is a greater amount. From those questions, we construct a minimum monthly discount factor for each individual. When we include the discount factor as an additional control variable in the regressions (in Table 6), the main risk-aversion results do not change (results available upon request from authors). Hence it is risk-aversion, not discounting behavior, that is driving these results.
Table 7
Do Past Natural Disasters Matter?
1 2
Natural disaster (2008) –0.12
(0.04)***
1.72 (0.75)**
Natural disaster (2007) –0.03 0.68
(0.04) (0.83)
Natural disaster (2006) –0.08 0.43
(0.04)* (0.51)
Natural disaster (2005) –0.16
(0.04)***
1.57 (0.73)**
Number of natural disaster (2000–2004) –0.003 –0.07
(0.02) (0.32)
Mean natural disaster (1980–2008) –0.03 0.37
(0.03) (0.64)
District fi xed effects Y Y
Control variables Y Y
R2 0.02 0.03
Observations 1,538 1,538
tered at the village level, include district fi xed effects, and include the full set of con-trol variables.
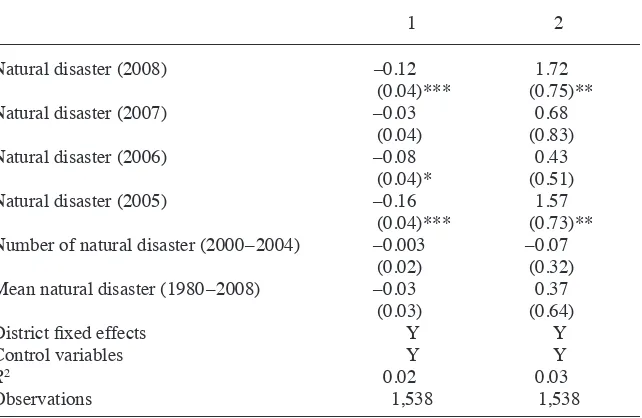
We include dummy variables generated from our survey data that indicate whether the village experienced a disaster for each year 2005–2008. We also include a mea-sure of the number of disasters in the period 2000–2004 from the PODES data. An economically signifi cant effect is found for each of the four years, 2005–2008, al-though disasters in 2007 are not statistically signifi cant. The coeffi cient on natural disasters over these years varies from 16 percentage points to three percentage points less likely to be risk- tolerant. Although the magnitude of the effect decreases from 2008 to 2006, the effect of natural disasters on risk- aversion is largest in 2005. The coeffi cient on the number of disasters 2000–2004 is negative but not statistically signifi cant. Even if we separate this variable into dummies by year, none are statisti-cally signifi cant.
Recall that we have information on the total value of damage in each village from the PODES data. The mean value of total damage is 3.74 ln Rp, but in the villages that experienced a natural disaster in 2005 the mean value of total damage is 16.5 ln Rp. This is almost the maximum value of damage for the entire sample (the maximum is 20.9 ln Rp). Therefore, it seems likely that the large effect on risk- aversion in 2005 is caused by the severity of the shocks in that year.
Column 2 in Table 7 replicates the regression in Column 1 but estimates an interval regression for the risk- aversion parameters. The results are similar using this alternate measure of risk- aversion. Thus, the results suggest that natural disasters affect risk attitudes beyond the year in which they occur. The longevity of the effect appears to vary with the severity of the experience with more severe damage or trauma leaving a deeper and longer lasting imprint on people’s risk attitudes.
VIII. Potential Pathways
A. Do Individuals Update Beliefs After Experiencing a Natural Disaster?
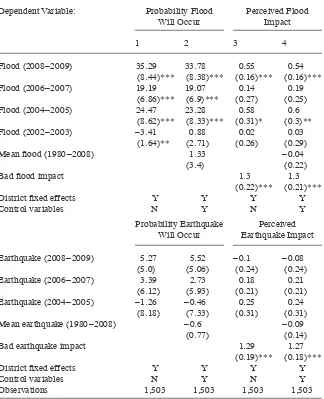
One reason a natural disaster may affect risk- taking behavior is that experiencing a disaster may impact individuals’ perceptions of the background risk they face. To examine this mechanism, in a survey of the same respondents conducted approxi-mately a year after the original survey we asked households to report the probability (or likelihood) that a fl ood and/or earthquake would occur in their village in the next year. We report the mean results of their responses by natural disaster status in the bottom panel of Table 3. Individuals who experienced a fl ood are signifi cantly more likely to report a higher probability that a fl ood will occur in the next year (42.6 versus 12 percent). Those who had experienced an earthquake reported a slightly higher (but not statistically signifi cant) probability that an earthquake will occur in the next year (18.2 versus 16.8 percent). All of these fi gures are higher than the actual historical probabilities. The fi gure reported by those who had recently experienced a fl ood is, however, an order of magnitude higher than the actual probability of a fl ood occurring in these villages (approximately 3 percent per year).
Table 8
Probability Natural Disaster Will Occur and Perceived Impact
Dependent Variable: Probability Flood
for past fl ood experiences.18 All results are clustered at the village level and include
district fi xed effects. Column 1 does not include any control variables and Column 2 reports results that include controls for ethnicity, gender, age, education, marriage, rivers, and mean fl ood occurrence from 1980–2008. The results indicate that the more recent the fl ood experience, the more likely the individual will report a higher prob-ability of occurrence in the next year. Therefore, it appears that past fl ood experiences cause individuals to update (and increase) the probability that another fl ood will occur in the next year. For example, a person who experienced a fl ood in 2008–2009 reports a probability of occurrence in the next year that is 34 points higher than an individual who did not experience a fl ood in the preceding seven years. This probability decreases the further away the fl ood experience (although not monotonically). For example, an individual who experienced a fl ood in 2004–2005 reports a probability of occurrence in the next year that is 23 points higher than an individual who did not experience a fl ood. In 2002–2003, the coeffi cient falls to 0.8 and loses statistical signifi cance in Column 2. We test for the equality of the year coeffi cients and can reject equality. This updating of expectations occurs even after we control for the mean background risk of fl oods, and the mean number of fl oods over time has no signifi cant impact on current day reports of expectations though the coeffi cient is positive.
Given the true probability of a fl ood occurring is approximately 3 percent per year, these results suggest that the perceptions of risk reported by individuals who have recently experienced a disaster are irrationally high. Similar “irrational behavior” has been well documented in different settings: For example, “hot hand beliefs” in which, after a string of successes of, say, calling heads or tails to the fl ip of a coin, individuals believe they are on a winning streak and give subjective probabilities of guessing the next fl ip correctly that are in excess of 50 percent (Croson and Sundali 2005). The Indonesian data similarly suggest positive autocorrelation in the perceived probability of negative events.
We also asked respondents to estimate how bad the impact of that fl ood or earth-quake would be conditional on experiencing a disaster in the next year (scale of 0–4 with 4 being the worst outcome, for example, an extremely bad fl ood and the mean for both variables is approximately 1). Columns 3–4 of Table 8 report ordered probit regressions where the dependent variable is the perceived impact of the fl ood. These results are also very intuitive and show a similar pattern to the probabilities. Indi-viduals are much more likely to report that the fl ood impact will be bad if they have experienced a fl ood in the recent past. In addition, we include a dummy variable if they have experienced a bad fl ood in the past and it is both positive and signifi cant. We defi ne a “bad fl ood impact” if the individual reports they had a bad or extremely bad fl ood experience. This implies that an individual who experienced a bad fl ood in the past is signifi cantly more likely to report that the future fl ood impact will be bad.
In the bottom panel of Table 8, we report the same regressions, except the mea-sure of natural disaster is now earthquake. The pattern is similar. The more recent the earthquake experience, the higher the reported probability that an earthquake will occur in the next year. However, none of the coeffi cients are statistically signifi cant. Having experienced an earthquake in the past does not affect the predicted severity
of an earthquake but having experienced a bad earthquake in the past signifi cantly increases the likelihood that an individual will report that the severity of the future earthquake will be bad.
These results suggest that the updating of expectations may help explain the more risk- averse choices people make when they have been exposed to a disaster. People who have experienced disaster perceive that they now face a greater risk and/or greater severity of future disasters and so are less inclined to take risks. Note that the longevity of the effect is similar to that on risk- taking behavior in Table 7—approximately fi ve years—and there is similarly a larger impact on perceptions of the likely severity of another disaster occurring if previous disasters have been severe.19 Kunreuther (1996)
and Palm (1995) have also demonstrated that beliefs about the likelihood of a future natural disaster increase immediately following personal experience of such a disaster. Gallagher (2010), which uses data on fl ood insurance takeup in the United States over a 50- year period, fi nds spikes in insurance takeup shortly after fl oods that then dimin-ish over time, fully dimindimin-ishing within ten years.
B. Income and Wealth Effects
An alternative interpretation of our results is that the behavioral differences we ob-serve are driven by the changes in income or wealth that accompany natural disasters. We have not included income or wealth as controls in the regressions in Table 6 as they are potentially endogenous. We do not have income or wealth prenatural disaster in our data set so it is diffi cult to investigate whether a change in income or wealth is driving the results or affecting the coeffi cient on natural disaster.20 However, to
exam-ine the role played by income and wealth changes we turn to another data set. Unlike our data set, the fourth round of the Indonesian Family Life Survey (IFLS4) was conducted in 2007–2008 and asked households to report the value of fi nancial loss due to natural disasters as well as the amount of fi nancial aid received (if any). The reported loss is approximately 3 percent of the value of household assets (which we call wealth). We can also use wealth from the previous round of the IFLS3 (conducted in 2000) to control for predisaster wealth.
IFLS4 respondents also played games designed to elicit risk preferences. Unlike our game, the IFLS4 risk games were not played for real money. However, Table 9 shows that the IFLS4 data produce similar results.21 We defi ne a person as “risk- tolerant’’
if they picked the last, most risky option in the game. The IFLS4 respondents played two games, which we call Game 1 and Game 2. The games differed in terms of the
19. Ideally, we would use the predicted probabilities and severity indices as explanatory variables in the natural disaster regressions. They were, however, collected in an additional survey approximately a year after the original survey and so will also refl ect natural disasters that occurred after the experimental games were conducted.
20. A regression of wealth today on natural disasters in the previous three years suggests that wealth is not an important channel; we fi nd no statistically signifi cant relationship and the coeffi cient on natural disaster is positive (that is, the wrong sign). If we do include contemporaneous wealth or income in the regressions in Table 6, we fi nd that they are positively associated with risk-tolerance and do not affect the other coeffi cients in the regression.
Ca
m
eron a
nd S
ha
h
507
Dependent Variable: Risk- Tolerant IFLS4 1 Risk- Tolerant IFLS4 2
1 2 3 4 5 6
Number of disasters (2001–2008) –0.006 –0.006 –0.006 –0.002 –0.002 –0.003
(0.003)** (0.002)** (0.003)** (0.001)** (0.001)** (0.001)**
Baseline wealth (2000) –0.0002 0.003 0.0008 0.002
(0.004) (0.004) (0.002) (0.002)
Total assistance received (2001–2008) 0.02 0.02 0.009 0.009
(0.007)** (0.006)** (0.006) (0.006)
Total amount lost (2001–2008) –0.002 0.0001
(0.001) (0.001)
Change in wealth (2000–2008) –0.003 –0.003
(0.006) (0.004)
District fi xed effects Y Y Y Y Y Y
Control variables Y Y Y Y Y Y
R2 0.06 0.07 0.07 0.04 0.04 0.04
Observations 4,150 4,150 4,150 4,150 4,150 4,150
payoffs in the lotteries.22 Columns 1 and 4 show that for both games, the more disasters
experienced in the seven years prior to the survey by the household, the more risk- averse the behavior. While the magnitude of the impact of natural disasters on risk- aversion is smaller in the hypothetical games (as expected since there are no real stakes), the nega-tive and statistically signifi cant signs on the coeffi cients are consistent with our results. Columns 2 and 5 of Table 9 include additional controls for baseline wealth. This is log wealth from the 2000 round of the IFLS3 (and so predisaster). We also include log of fi nancial assistance received and log of the total amount lost due to natural disaster (reported in IFLS4). This allows us to examine if the income effect (controlling for the level of baseline wealth) can explain our result. The coeffi cient on baseline assets is close to zero and insignifi cant in all specifi cations.23 Total assistance received is
posi-tive in both games and statistically signifi cant in Game 1. The total amount lost is neg-ative in Game 1: The more one loses due to natural disasters, the less likely one is to be risk- tolerant though this result is not statistically signifi cant in either specifi cation. In Columns 3 and 6, we include a control for the change in wealth between 2000 and 2007. The coeffi cient while negative is not statistically signifi cant.
In both specifi cations, the coeffi cient on the number of disasters is unaffected by the inclusion of these controls. We include different measures of potential income effects and the only income effect that seems to be statistically signifi cant is when the house-hold receives money due to natural disasters. This increase in income makes individuals more risk- tolerant. However, the bottom line from Table 9 is that there is little evidence of strong income/wealth effects in the data: Controlling for both levels and changes of wealth does not affect our core result that experiencing a natural disaster, ceteris pari-bus, causes one to act in a more risk- averse manner. That is, changes in income do not explain the more risk- averse behavior of households that experienced natural disasters.
Below, we present results showing that having insurance may reduce some, but not all, of the natural disaster- induced risk- aversion.
C. Insurance
A further implication of Gollier and Pratt’s (1996) “risk vulnerability’’ is that individu-als demand more insurance in the presence of increased risk. We examine this using various measures of insurance. Given the setting is rural Indonesia, individuals do not have access to formal earthquake or fl ood insurance. However, rural households have other informal methods of self- insuring against risk.
Our data provide information on households’ participation in “arisan” and their re-ceipt of remittances. Arisan is the Indonesian version of rotating savings and credit as-sociations that are found in many developing countries. It refers to a social gathering in
which a group of community members meet monthly for a private lottery. Each mem-ber of the group deposits a fi xed amount of money into a pot, then a name is drawn and that winner takes home the cash. After having won, the winner’s name is removed from the pot until each member has won and the cycle is complete. The primary purpose of the arisan is to enable members to purchase something beyond their affordability, but it is occasionally used for smoothing shocks. However, this is more likely when the shock is idiosyncratic (only affects a household) and much more diffi cult in the presence of an aggregate shock such as a natural disaster.
In addition to arisan participation, households were asked whether they receive remit-tance income from outside their village; this could be money sent from urban migrants within Indonesia or money sent from overseas migrants. A literature exists on the role of gifts and remittances that households use for insurance and risk- coping strategies (Lucas and Stark 1985; Rosenzweig and Stark 1989; Yang and Choi 2007). We use arisan participation and remittance receipt to test for informal methods of self- insurance. Arisan and remittances are distinct in that an arisan provides a form of ex ante insurance with involvement being irrespective of experiencing a disaster, whereas remittances are a form of ex post support that can respond to the occurrence of a disaster.
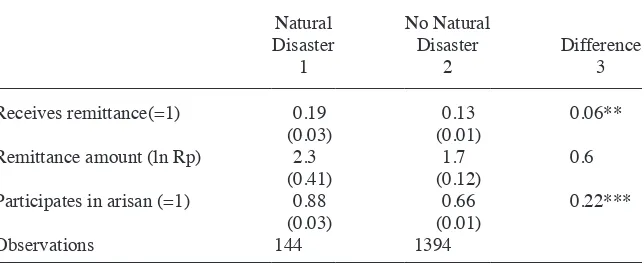
In Table 10, we test whether we observe greater incidence of insurance in villages that are hit by natural disasters from 2005–2008. In Columns 1–2, we report the mean of the insurance measure by natural disaster status, and in Column 3 we test whether the means are statistically different. Individuals who live in villages that experienced a natural disaster in the previous three years are more likely to receive remittances and participate in arisan. The amount of remittances received is also higher in villages that have experienced a natural disaster but not statistically signifi cantly so.24
24. Note that the analysis presented in this section is only suggestive as the results may be biased due to endogeneity and/or reverse causality. For example, remittances may be received by households that have experienced more severe disasters and so are expected to be more risk-averse. More risk-averse individuals may also seek out more insurance. Both of these effects would, however, bias the coeffi cients against our fi nding that remittance receipt ameliorates the impact of natural disasters on risk preferences.
Table 10
Insurance Measures by Natural Disaster
Natural Disaster
1
No Natural Disaster
2
Difference 3
Receives remittance(=1) 0.19 0.13 0.06**
(0.03) (0.01)
Remittance amount (ln Rp) 2.3 1.7 0.6
(0.41) (0.12)
Participates in arisan (=1) 0.88 0.66 0.22***
(0.03) (0.01)
Observations 144 1394
In Table 11, we examine whether having access to insurance can reduce some of the natural disaster induced risk- aversion. We regress our measures of risk on the different measures of insurance and interact our measure of insurance and natural disaster. To the extent our results are driven by income effects, we would expect this impact to be mitigated by insurance.
In Column 1 of Table 11, the dependent variable is risk- tolerant. In Column 2, the de-pendent variable is the natural log of the interval of the relative risk- aversion parameters and we estimate tobit interval regressions. The coeffi cient on the interaction of natural disaster and the remittance amount (in log Rp) is positive and statistically signifi cant. Receiving a remittance does provide some insurance against the impact of natural disas-ters. The greater the amount received, the less risk- aversion we should observe when a natural disaster strikes. This is consistent with Barr and Genicot (2008), which fi nds that villagers in Zimbabwe are willing to make more risky choices when playing a similar risk game when they know they have insurance. Note, however, that while insurance may offset some of the impacts on risk- aversion, it does not completely wipe out the effect. At the mean, remittances offset only 16 percent of the impact of a natural disaster. In order to completely offset the effect of a disaster, log remittances need to be six times larger than this. Only 13 percent of our sample receives remittances of this magnitude. This is consistent with our earlier results that changes in wealth and/or income are not strong determinants of changes in behavior following a natural disaster.
Table 11
Does “Insurance” Help?
Dependent Variable Risk- Tolerant
1
Interval of ln 2
Natural disaster –0.14 1.05
(0.07)* (0.65)
Arisan 0.003 –0.45
(0.02) (0.34)
Arisan*natural disaster 0.05 0.31
(0.07) (0.77)
Remittance amount –0.0001 –0.02
(0.002) (0.05)
Remittance amount*natural disaster 0.01
(0.004)**
–0.14 (0.07)*
Constant 0.14 0.04
(0.04)*** (0.59)
R2 0.01 0.01
District fi xed effects Y Y
Observations 1,538 1,538
Arisan participation has no statistically signifi cant effect on risk- aversion. Though the interaction is positive and 0.06, it is not statistically signifi cant. This is consistent with arisan being a within village insurance mechanism and so unable to insure villag-ers against shocks that affect the whole village.25
IX. Do the Experimentally Risk- Averse Take Fewer
Risks in Daily Life?
So far, we have examined risk- taking within the experimental setting. In this section, we explore whether the experimental game choice predicts actual deci-sions that individuals make about technology adoption, opening a new business, and/ or changing jobs. In a survey of the same participants conducted two years after the risk games were conducted, we ask them whether they have done any of the above in the intervening period. We then examine the relationship between this behavior and their behavior in the risk game. The results of this exercise are shown in Table 12. Odd- numbered columns do not include any additional controls (except for district fi xed effects) and show that, regardless of which risk measure we use, more risk- tolerant individuals are more likely to open a new business and change jobs. They are also more likely to adopt new technologies though the standard errors become large. Even numbered columns add a control for years of education. Education is the only sociodemographic variable that has a statistically signifi cantly relationship with any of the dependent variables in Table 12. Controlling for education affects the coef-fi cients on the risk- aversion variables only very slightly.
These fi ndings are important in that they suggest that natural disasters can impact real life behavior through decreased risk- taking behavior. If people are less likely to open businesses or switch jobs, this has obvious ramifi cations for economic growth and development. In addition, the period right after a natural disaster is often when aid money is infused into disaster- stricken areas. If individuals are not investing opti-mally, again this has the potential for negative consequences.
X. Conclusion
This paper shows that individuals living in villages that have experi-enced a natural disaster recently behave in a more risk- averse manner than individuals in otherwise like villages. Our data suggest that beliefs about the likelihood of such shocks occurring and their severity change as a result of having experienced a natural disaster. People who have recently experienced a disaster attach a higher probability to experiencing another in the next 12 months and expect the impact to be more severe than people who have not experienced one. They thus behave as though they face greater background risk. Thus, in terms of theory, this paper supports Gollier and Pratt’s (1996) risk- vulnerability hypothesis and rejects the hypothesis that independent risks are complementary.
T
he
J
ourna
l of H
um
an Re
sourc
es
Table 12
Is Experimental Risk- Tolerance Correlated with Real Life Risk- Taking?
Dependent Variable: Opened New Business Changed Jobs Adopted New Technology
1 2 3 4 5 6
Risk- tolerant 0.03 0.03 0.03 0.03 0.003 –0.001
(0.02)* (0.02) (0.02)* (0.02) (0.02) (0.02)
Education 0.01
(0.002)***
0.005 (0.002)**
0.01 (0.003)***
R2 0.01 0.03 0.01 0.01 0.01 0.02
District fi xed effects Y Y Y Y Y Y
Observations 1,432 1,432 1,432 1,432 1,432 1,432