UJI VALIDITAS DAN RELIABILIAS VARIABEL KOMPENSASI
Case Processing Summary
N %
Cases
Valid 20 100.0
Excludeda 0 .0
Total 20 100.0
a. Listwise deletion based on all variables in the
procedure.
Reliability Statistics
Cronbach's
Alpha
N of Items
.858 4
Item Statistics
Mean Std. Deviation N
X1_1 3.50 .827 20
X1_2 3.75 .910 20
X1_3 4.20 1.005 20
Item-Total Statistics
Scale Mean if
Item Deleted
Scale Variance
if Item Deleted
Corrected
Item-Total
Correlation
Cronbach's
Alpha if Item
Deleted
X1_1 11.70 7.168 .618 .854
X1_2 11.45 6.155 .798 .782
X1_3 11.00 6.105 .699 .821
UJI VALIDITAS DAN RELIABILIAS VARIABEL DISIPLIN KERJA
Case Processing Summary
N %
Cases
Valid 20 100.0
Excludeda 0 .0
Total 20 100.0
a. Listwise deletion based on all variables in the
procedure.
Reliability Statistics
Cronbach's
Alpha
N of Items
.910 4
Item Statistics
Mean Std. Deviation N
X2_1 3.25 1.070 20
X2_2 3.40 1.188 20
X2_3 3.60 .995 20
Item-Total Statistics
Scale Mean if
Item Deleted
Scale Variance
if Item Deleted
Corrected
Item-Total
Correlation
Cronbach's
Alpha if Item
Deleted
X2_1 10.45 8.576 .836 .869
X2_2 10.30 8.432 .742 .905
X2_3 10.10 9.042 .823 .876
UJI VALIDITAS DAN RELIABILIAS VARIABEL KONFLIK KERJA
Case Processing Summary
N %
Cases
Valid 20 100.0
Excludeda 0 .0
Total 20 100.0
a. Listwise deletion based on all variables in the
procedure.
Reliability Statistics
Cronbach's
Alpha
N of Items
.849 4
Item Statistics
Mean Std. Deviation N
X3_1 3.85 .988 20
X3_2 3.75 1.020 20
X3_3 3.70 .923 20
Item-Total Statistics
Scale Mean if
Item Deleted
Scale Variance
if Item Deleted
Corrected
Item-Total
Correlation
Cronbach's
Alpha if Item
Deleted
X3_1 11.10 4.726 .865 .723
X3_2 11.20 5.221 .678 .815
X3_3 11.25 5.566 .689 .807
UJI VALIDITAS DAN RELIABILIAS VARIABEL KINERJA
KARYAWAN
Case Processing Summary
N %
Cases
Valid 20 100.0
Excludeda 0 .0
Total 20 100.0
a. Listwise deletion based on all variables in the
procedure.
Reliability Statistics
Cronbach's
Alpha
N of Items
.875 4
Item Statistics
Mean Std. Deviation N
Y_1 3.60 .883 20
Y_2 3.65 .745 20
Y_3 3.70 1.129 20
Item-Total Statistics
Scale Mean if
Item Deleted
Scale Variance
if Item Deleted
Corrected
Item-Total
Correlation
Cronbach's
Alpha if Item
Deleted
Y_1 11.40 5.411 .749 .833
Y_2 11.35 5.924 .768 .834
Y_3 11.30 4.011 .880 .785
Descriptive Statistics
Mean Std. Deviation N
Kinerja Karyawan (Y) 15.22 2.779 54
Kompensasi (X1) 15.19 3.274 54
Disiplin Kerja (X2) 14.48 3.352 54
Konflik Kerja (X3) 14.89 3.051 54
Variables Entered/Removeda
Model Variables Entered Variables
Removed
Method
1 Konflik Kerja (X3), Disiplin Kerja (X2), Kompensasi (X1)b . Enter
a. Dependent Variable: Kinerja Karyawan (Y)
b. All requested variables entered.
Model Summary
Model R R Square Adjusted R
Square
Std. Error of the
Estimate
1 .926a .858 .850 1.077
a. Predictors: (Constant), Konflik Kerja (X3), Disiplin Kerja (X2),
Kompensasi (X1)
ANOVAa
Model Sum of Squares df Mean Square F Sig.
1
Regression 351.341 3 117.114 100.973 .000b
Residual 57.992 50 1.160
Total 409.333 53
a. Dependent Variable: Kinerja Karyawan (Y)
Coefficientsa
Model Unstandardized Coefficients Standardized
Coefficients
t Sig.
B Std. Error Beta
1
(Constant) 4.702 1.169 4.022 .000
Kompensasi (X1) .408 .061 .481 6.742 .000
Disiplin Kerja (X2) .413 .059 .498 7.010 .000
Konflik Kerja (X3) -.112 .050 -.122 -2.246 .029
Cuplikan Tabel Distribusi t
0
No
10%
5%
2,5%
31
1.309
1.696
2.040
32
1.309
1.694
2.037
33
1.308
1.692
2.035
34
1.307
1.691
2.032
35
1.306
1.690
2.030
36
1.306
1.688
2.028
37
1.305
1.687
2.026
38
1.304
1.686
2.024
39
1.304
1.685
2.023
40
1.303
1.684
2.021
41
1.303
1.683
2.020
42
1.302
1.682
2.018
43
1.302
1.681
2.017
44
1.301
1.680
2.015
45
1.301
1.679
2.014
46
1.300
1.679
2.013
47
1.300
1.678
2.012
48
1.299
1.677
2.011
49
1.299
1.677
2.010
50
1.299
1.676
2.009
51
1.298
1.675
2.008
52
1.298
1.675
2.007
53
1.298
1.674
2.006
54
1.297
1.674
2.005
55
1.297
1.673
2.004
56
1.297
1.673
2.003
57
1.297
1.672
2.002
58
1.296
1.672
2.002
59
1.296
1.671
2.001
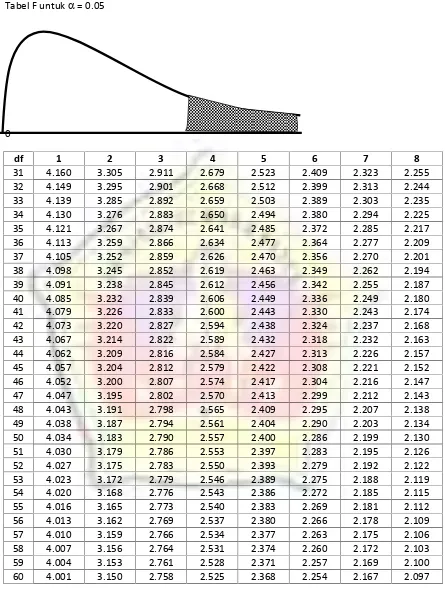
Tabel F untuk
= 0.05
0
df
1
2
3
4
5
6
7
8
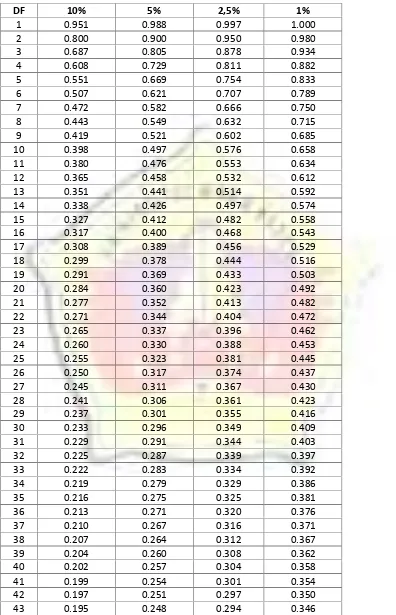
TABEL R
DF
10%
5%
2,5%
1%
1
0.951
0.988
0.997
1.000
2
0.800
0.900
0.950
0.980
3
0.687
0.805
0.878
0.934
4
0.608
0.729
0.811
0.882
5
0.551
0.669
0.754
0.833
6
0.507
0.621
0.707
0.789
7
0.472
0.582
0.666
0.750
8
0.443
0.549
0.632
0.715
9
0.419
0.521
0.602
0.685
10
0.398
0.497
0.576
0.658
11
0.380
0.476
0.553
0.634
12
0.365
0.458
0.532
0.612
13
0.351
0.441
0.514
0.592
14
0.338
0.426
0.497
0.574
15
0.327
0.412
0.482
0.558
16
0.317
0.400
0.468
0.543
17
0.308
0.389
0.456
0.529
18
0.299
0.378
0.444
0.516
19
0.291
0.369
0.433
0.503
20
0.284
0.360
0.423
0.492
21
0.277
0.352
0.413
0.482
22
0.271
0.344
0.404
0.472
23
0.265
0.337
0.396
0.462
24
0.260
0.330
0.388
0.453
25
0.255
0.323
0.381
0.445
26
0.250
0.317
0.374
0.437
27
0.245
0.311
0.367
0.430
28
0.241
0.306
0.361
0.423
29
0.237
0.301
0.355
0.416
30
0.233
0.296
0.349
0.409
31
0.229
0.291
0.344
0.403
32
0.225
0.287
0.339
0.397
33
0.222
0.283
0.334
0.392
34
0.219
0.279
0.329
0.386
35
0.216
0.275
0.325
0.381
36
0.213
0.271
0.320
0.376
37
0.210
0.267
0.316
0.371
38
0.207
0.264
0.312
0.367
39
0.204
0.260
0.308
0.362
40
0.202
0.257
0.304
0.358
41
0.199
0.254
0.301
0.354
42
0.197
0.251
0.297
0.350
44
0.192
0.246
0.291
0.342
45
0.190
0.243
0.288
0.338
46
0.188
0.240
0.285
0.335
47
0.186
0.238
0.282
0.331
48
0.184
0.235
0.279
0.328
49
0.182
0.233
0.276
0.325
50
0.181
0.231
0.273
0.322
51
0.179
0.228
0.271
0.319
52
0.177
0.226
0.268
0.316
53
0.175
0.224
0.266
0.313
54
0.174
0.222
0.263
0.310
55
0.172
0.220
0.261
0.307
56
0.171
0.218
0.259
0.305
57
0.169
0.216
0.256
0.302
58
0.168
0.214
0.254
0.300
59
0.166
0.213
0.252
0.297
60
0.165
0.211
0.250
0.295
61
0.164
0.209
0.248
0.293
62
0.162
0.207
0.246
0.290
63
0.161
0.206
0.244
0.288
64
0.160
0.204
0.242
0.286
65
0.159
0.203
0.240
0.284
66
0.157
0.201
0.239
0.282
67
0.156
0.200
0.237
0.280
68
0.155
0.198
0.235
0.278
69
0.154
0.197
0.234
0.276
Frekuensi Identitas Responden
Statistics
Jenis Kelamin Usia Pendidikan Masa Kerja
N
Valid 54 54 54 54
Missing 0 0 0 0
Frequency Table
Jenis Kelamin
Frequency Percent Valid Percent Cumulative
Percent
Valid
Pria 28 51.9 51.9 51.9
Wanita 26 48.1 48.1 100.0
Total 54 100.0 100.0
Usia
Frequency Percent Valid Percent Cumulative
Percent
Pendidikan
Frequency Percent Valid Percent Cumulative
Percent
Valid
SLTA 36 66.7 66.7 66.7
D3/S1 18 33.3 33.3 100.0
Total 54 100.0 100.0
Masa Kerja
Frequency Percent Valid Percent Cumulative
Percent
Valid
5 - 10 th 5 9.3 9.3 9.3
11 - 15 th 10 18.5 18.5 27.8
16 - 20 th 13 24.1 24.1 51.9
> 20 th 26 48.1 48.1 100.0
Frekuensi Kompensasi
Statistics
X1_1 X1_2 X1_3 X1_4 Kompensasi
(X1)
N
Valid 54 54 54 54 54
Missing 0 0 0 0 0
Mean 3.69 3.78 4.00 3.72 15.19
Median 4.00 4.00 4.00 4.00 16.00
Mode 4 4 5 4 16
Sum 199 204 216 201 820
Frequency Table
X1_1
Frequency Percent Valid Percent Cumulative
Percent
X1_2
Frequency Percent Valid Percent Cumulative
Percent
Total 54 100.0 100.0
X1_3
Frequency Percent Valid Percent Cumulative
Percent
Total 54 100.0 100.0
X1_4
Frequency Percent Valid Percent Cumulative
Percent
Valid
1 1 1.9 1.9 1.9
3 14 25.9 25.9 37.0
4 22 40.7 40.7 77.8
5 12 22.2 22.2 100.0
Total 54 100.0 100.0
Kompensasi (X1)
Frequency Percent Valid Percent Cumulative
Percent
Frekuensi Variabel Disiplin Kerja
Statistics
X2_1 X2_2 X2_3 X2_4 Disiplin Kerja
(X2)
N
Valid 54 54 54 54 54
Missing 0 0 0 0 0
Mean 3.61 3.52 3.61 3.74 14.48
Median 4.00 4.00 4.00 4.00 15.00
Mode 4 4 4 4 16
Sum 195 190 195 202 782
Frequency Table
X2_1
Frequency Percent Valid Percent Cumulative
Percent
X2_2
Frequency Percent Valid Percent Cumulative
Percent
Total 54 100.0 100.0
X2_3
Frequency Percent Valid Percent Cumulative
Percent
Total 54 100.0 100.0
X2_4
Frequency Percent Valid Percent Cumulative
Percent
Valid
1 3 5.6 5.6 5.6
2 1 1.9 1.9 7.4
4 23 42.6 42.6 77.8
5 12 22.2 22.2 100.0
Total 54 100.0 100.0
Disiplin Kerja (X2)
Frequency Percent Valid Percent Cumulative
Percent
Frekuensi Variabel Konflik Kerja
Statistics
X3_1 X3_2 X3_3 X3_4 Konflik Kerja
(X3)
N
Valid 54 54 54 54 54
Missing 0 0 0 0 0
Mean 3.70 3.74 3.70 3.74 14.89
Median 4.00 4.00 4.00 4.00 16.00
Mode 4 4 4 4 18
Sum 200 202 200 202 804
Frequency Table
X3_1
Frequency Percent Valid Percent Cumulative
Percent
X3_2
Frequency Percent Valid Percent Cumulative
Percent
Total 54 100.0 100.0
X3_3
Frequency Percent Valid Percent Cumulative
Percent
Total 54 100.0 100.0
X3_4
Frequency Percent Valid Percent Cumulative
Percent
Valid
1 1 1.9 1.9 1.9
2 2 3.7 3.7 5.6
4 24 44.4 44.4 81.5
5 10 18.5 18.5 100.0
Total 54 100.0 100.0
Konflik Kerja (X3)
Frequency Percent Valid Percent Cumulative
Percent
Frekuensi Variabel Kinerja Karyawan
Statistics
Y_1 Y_2 Y_3 Y_4 Kinerja
Karyawan (Y)
N
Valid 54 54 54 54 54
Missing 0 0 0 0 0
Mean 3.70 3.72 3.83 3.96 15.22
Median 4.00 4.00 4.00 4.00 16.00
Mode 4 4 4 4 16a
Sum 200 201 207 214 822
a. Multiple modes exist. The smallest value is shown
Frequency Table
Y_1
Frequency Percent Valid Percent Cumulative
Percent
Y_2
Frequency Percent Valid Percent Cumulative
Percent
Total 54 100.0 100.0
Y_3
Frequency Percent Valid Percent Cumulative
Percent
Total 54 100.0 100.0
Y_4
Frequency Percent Valid Percent Cumulative
Percent
Valid
1 1 1.9 1.9 1.9
2 2 3.7 3.7 5.6
28
4 20 37.0 37.0 66.7
5 18 33.3 33.3 100.0
Total 54 100.0 100.0
Kinerja Karyawan (Y)
Frequency Percent Valid Percent Cumulative
Percent