ANALYSIS OF PROFITABILITY RATIO AND MACROECONOMIC FACTORS TO
STOCK RETURN AND SWOT STRATEGY
(CASE STUDY: MINING SECTOR COMPANIES LISTED IN INDONESIA STOCK
EXCHANGE YEAR 2010-2014)
Emera1 Sakinah1, Endang Chumaidiyah2, Rita Zulbetti3
1,2,3Industrial Engineering Study Program, School of Industrial and System Engineering, Telkom University
1[email protected], 2[email protected], 3[email protected]
ABSTRACT:
Capital markets have an important role for the economy of a country because capital markets serve two functions, namely a means for companies to get funds and facilities for the community to invest in financial instruments. The fall in stock returns in the mining sector listed in Indonesia Stock Exchange 2010-2014 period behind this research, because stock returns tend to decline would be detrimental to the shareholders. This study aims to determine the effect of profitability as measured by net profit margin and earnings per share and macro economic factor which measured by inflation on stock returns and provide strategic recommendations for companies that have a return value low in order to improve the return the company back, method used is the method descriptive. The analysis used is multiple linear regression hypothesis testing using the F and T test. After doing research, it is obtained results showed that the profitability as measured by net profit margin and earnings per share and also the macroeconomic as measured by inflation on stock returns. The effect of profitability and macroeconomic factors of the stock return is 38.9%.
Based on analysis of strength, weakness, opportunity and threat of PT Bumi Resources Tbk as representative company in mining sector, the position of the company is in Quadrant II which is the proper strategy that can be used is S-T strategy. S-T strategy means company needs to maximize strength and avoid threat.
Keywords: Profitability Ratio, Stock Return, SWOT Analysis
1. Introduction
Development of the company in an effort to anticipate the increasingly intense competition will always be done either by large and small companies. Such efforts constitute a problem for the company because it involves the fulfillment of the necessary funds. The fulfillment of these funds can be obtained from internal or external company. Internal Sources comes from retained earnings, while external funds comes from creditors and investors. The external funds from creditors called foreign capital, is a debt for companies and external funds from investors called equity. The needs of a company on the capital needed can be obtained by submitting a credit to banks, loans to financial institutions, or combine, merge or divert company to another company. But besides that, the company has other options to raise capital by looking for those who are willing to buy partial ownership of the company by selling some shares of the company. Funds or capital obtained from the company's investors are source of long-term funds in the form of shares. These shares is not limited to credit funds remuneration provided in the form of profit sharing. To be able to issue shares, the company must be listed in the Indonesia Stock Exchange (IDX) so that it can enter into the capital market.
sectors. While the mining sector, finished last for the performance of the share price fell along with the decline in financial performance and laba. Nonetheless, growth in the mining sector is still around 20% because it can be compensated by other issuers. Data Investment Coordinating Board said, interest in investing in the mining sector fell to 17% in 2012 from 20% in the previous year. Investors shifted to the manufacturing sector. From the nine sectors, the mining sector has the lowest stock returns among other sectors. This can be seen from the stock returns graph for 2010-2014 as follows:
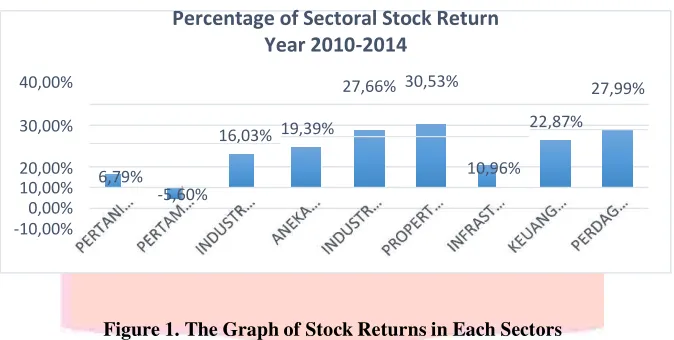
Figure 1. The Graph of Stock Returns in Each Sectors
From the graph, it can be seen that the eight sectors had a positive percentage stock returns and one sector which has the percentage of negative stock returns. Sectors which have a percentage stock returns positive namely agriculture sector amounted to 6.79%, the Industrial sector Basic Chemicals at 16:03%, sector Various Industries at 19:39%, the Industry sector Consumer Goods amounted to 27.66%, the sector of Property and Real Estate amounted to 30.53%, Infrastructure sector amounted to 10.96 %, financial sector amounted to 22.87% and the Trade, Services and Investment amounted to 27.99%.
Return stocks decline could hurt the company because it reduces investors to invest in the mining sector. The things that affect stock prices are forces of demand and supply (the performance of the company, industry conditions in which the company is located), macro (such as inflation, interest rates, exchange rates) and non-economic factors (such as social, political and other factors).
Financial ratios derived from the financial statements will reflect the company's financial condition and results of operations of the company. In general, investors will invest in companies that have a good enough profit so they are usually conducted an analysis of profitability. Profitability shows the ability of the company in generating profits. Companies that produce high profit shows that the company has good prospects in the future, so as to attract investors to invest. Thus, each company will always strive to improve profitability, because the higher the level of profitability of a company, the survival of the company to be more secure. There are some measurements of the level of profitability that is Gross Profit Margin, Operating Profit Margin, Net Profit Margin, Total Assets Turnover, Return On Investment, Return on Equity, Return on Assets, Earnings Per Share, Dividend Per Share, Book Value Per Share. In this study, the ratio of profitability to be used is the Return on Assets (ROA), Return on Equity (ROE), Net Profit Margin (NPM) and Earning Per Share (EPS). By taking a phenomenon that occurs in the mining sector, the strategy to increase return of mining sector is needed.
2. Basic Theory A. Capital Market
The capital market is a meeting place between those who have surplus funds to those who need funds by selling and buying securities (Tandelilin, 2010: 26) [2].
B. Go Public
Going public is a means of funding the business through capital markets, which can be a public offering of shares, nor a public offering of bonds. Each option has its own advantages and characteristics tailored to the needs and conditions of the company.
C. Stock
Stock is a piece of paper that demonstrate the right of an investor (i.e. the partythat possess the paper) for a share of the wealth or a prospect of wealth of the organization that issued the securities, and the various conditions that allow the investor to do what is in his right.
D. Stock Return
Stock return is the result or benefit of shareholders as aresult of the investment. There are several factors that can affect the stock return, both macro and micro. Macroeconomic factors consist of inflation, interest rate, foreign exchange rate, the rate of economic growth, the price of fuel oil in the international market and regional stock price index. It can be written with the formula:
E. Financial Statement
The financial statements it is a tool used to communicate financial information of a company and its activities to those with an interest in the company. Based on the description above, the financial analysis used in this study to determine the effect of profitability and market value on stock returns are:
1.
Return on asset (ROA)��� = 𝐸���������������������������������� (𝐸����)
2.
Return on equity (ROE)3.
Net Profit Margin (NPM)��𝐸 = ����������
�������𝐸����� ���������ℎ
4.
Earning Per Share (EPS)��� =
���������
F. Classic assumption test
𝐸�� = 𝐸����������������������������������� (𝐸����)
ℎ����
Multiple linear regression (multiple linear regression method) is referred to as a good model if it meets the classical assumption test statistic consisting of the assumption of normality, autocorrelation, Multicollinearity and Heteroskidastity.
1. Normality Test
In testing using regression analysis required data samples are normally distributed. Normality test used to see whether the data were normally distributed or not. Good data are normally distributed data.
2. Test Multicollinearity
Multicolinearity test used to see whether in the regression model found a correlation between independent variables (independent). If there is a correlation, then there is a problem multikolinearitas. One way that can be used to test the multicollinearity is to look at the value of tolerance and variance inflation factor (VIF) of the results of analysis using SPSS. If the VIF values higher than 0.1 or VIF smaller than 10, it can be concluded not happen multikolinearitas.
3. Test Autocorrelation
Autocorrelation test used to see whether the linear regression model was no correlation between bullies error in period t with errors t-1 (previous). If there is a correlation, then there is a problem atutokorelasi that caused the models used are not worthy to wear. To detect the use value of autocorrelation Durbin Watson, if the DW value between 1.5 to 2.5 = no autocorrelation.
4. Test Heteroscedasticity
Heteroscedasticity test was used to test whether the regression model occurred inequality and residual variance of the observations to other observations. If the variance of the residuals of the observations to other observations remain, then called homoskedastisitas, otherwise if different called heteroscedasticity.
G. SWOT Analysis
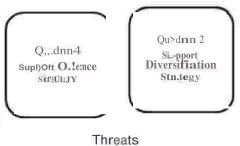
SWOT Analysis is the identification of factors systematically to formulate the company's strategy, in which every company must be able to maximize every ounce of strength and opportunities and able to minimize your weaknesses and threats. A company's performance can be determined by a combination of internal and external factors. Both of these factors should be considered in the SWOT analysis. Following is a matrix of a SWOT analysis.
Opportunities
Q,,.dnn 3
Support Tumrolnl
Stn.t1,:y
Q,,.dnn 1 Si..-pport
A.gp-usive Stn..tel)'
Q,,.dnn4
Supl)Oft O.!e:nce
Stf'OUl:JY
Threats
Qu>dnn 2
Si..-pport
Diversifiation
Stn.tegy
The following explanation of four quadrants in the SWOT matrix (Rangkuti, 2014) [3]:
1. Quadrant 1. This position is a very favorable situation. The company has the opportunity and the power to take advantage of existing opportunities. The strategy that should be applied in these circumstances is how to support aggressive growth (growth-oriented strategy).
2. Quadrant 2. In this position, although facing various threat, the company still has strength in terms of internal capabilities. The strategy that should be applied is to use its strength to take advantage of long-term opportunities by way of diversification strategy (product/market diversification).
3. Quadrant 3. In this position, the company is facing enormous market opportunities, but on the other hand, it also faces several constraints and internal weaknesses. Conditions in quadrant 3 are similar to the conditions in the BCG Matrix’s Question Marks. The focus of the company's strategy should be to minimize the company's internal problems so that it can seize the market better.
4. Quadrant 4. This is a very unfavorable situation, the company was facing various threats and internal weaknesses.
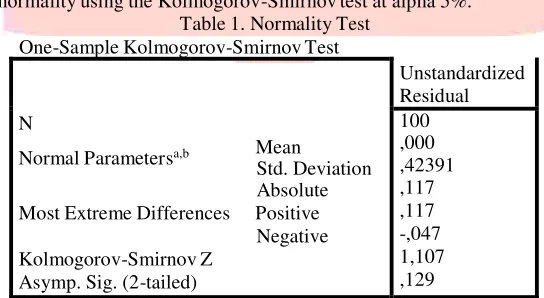
3. Data Processing and Analysis 3.1 Normality test
Testing of this research normality using the Kolmogorov-Smirnov test at alpha 5%. Table 1. Normality Test Most Extreme Differences Positive
Negative
Based on the table above can be seen significant residual value of 0,129 where the value is greater than the value of alpha (0.05). This shows that the regression model has normal distribution.
3.2 Test Multicolinearity
Multicoloniarity testing is seen based on value tolerance value and variance inflation factor (VIF). Table2. Multicolinearity Test
ROA 9.19E-05 5.912833 4.598000
ROE 2.09E-06 1.389683 1.278209
NPM 3.43E-05 4.099161 3.516151
EPS 4.07E-09 1.846462 1.631113
INFLATION 0.001300 29.64414 2.546219
BI_RATE 0.013473 300.1110 2.219563
EXCHANGE RATE 5.18E-09 264.2658 3.392157
C 0.344775 176.3871 NA
Based on the table above can be VIF is less than 10 so that there is no happen multicoloniarity. Based on the result, the variables can go to the next test.
3.3 Test Autocorrelation
To detect the presence of autocorrelation is the Durbin Watson through the table. Table 3. Autocorrelation Test
R-squared Adjusted R-squared S.E. of regression D-W
0.0128 -0.088703 0.442298 1.9723
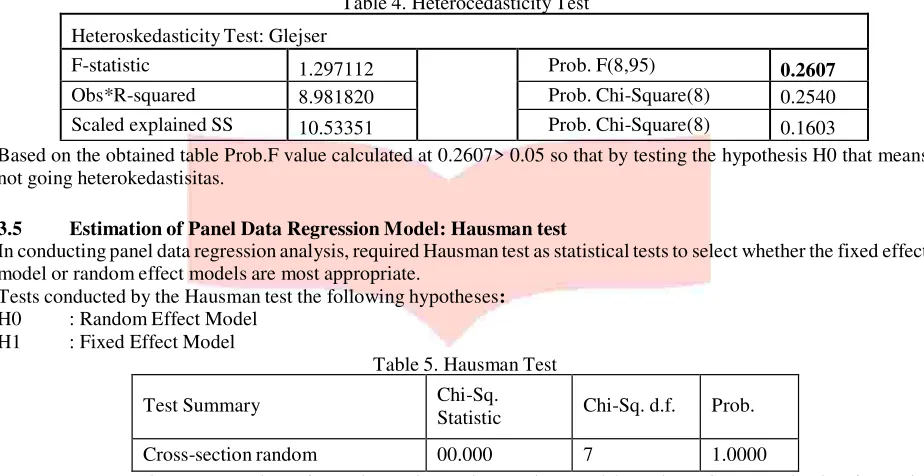
3.4 Test Assumptions Heterocedasticity
Heterocedasticity is one indication that the residual variance is not homogeneous may result in estimated values become inefficient. Heterokedastisitas test in this study using a test Glejser.
Table 4. Heterocedasticity Test
Heteroskedasticity Test: Glejser
F-statistic 1.297112 Prob. F(8,95) 0.2607
Obs*R-squared 8.981820 Prob. Chi-Square(8) 0.2540
Scaled explained SS 10.53351 Prob. Chi-Square(8) 0.1603
Based on the obtained table Prob.F value calculated at 0.2607> 0.05 so that by testing the hypothesis H0 that means not going heterokedastisitas.
3.5 Estimation of Panel Data Regression Model: Hausman test
In conducting panel data regression analysis, required Hausman test as statistical tests to select whether the fixed effect model or random effect models are most appropriate.
Tests conducted by the Hausman test the following hypotheses:
H0 : Random Effect Model H1 : Fixed Effect Model
Table 5. Hausman Test
Test Summary Chi-Sq.
Statistic Chi-Sq. d.f. Prob.
Cross-section random 00.000 7 1.0000
Hausman test results menggunaka Eviews above shows the p-value 1 >5% so that H0 accepted. Thus it can be concluded that the method of analysis Random Effect Model (REM ) is better than the Fixed Effect Model (FEM). Here are the results of the Random Effect Model:
Table 6. FEM Result
Variable Coefficient Std. Error t-Statistic Prob.
ROA -0.016097 0.009879 -1.629480 0.1067
ROE -0.000868 0.001407 -0.616767 0.5389
NPM 0.016488 0.005863 2.812355 0.0060
EPS 0.000130 6.65E-05 1.948940 0.0494
INFLATION 0.085062 0.034734 2.448967 0.0162
BI_RATE 0.063558 0.111808 0.568461 0.5711
EXCHANGE
RATE -9.12E-05 6.93E-05 -1.314823 0.1919
C 7.27E-05 6.94E-05 1.047931 0.8510
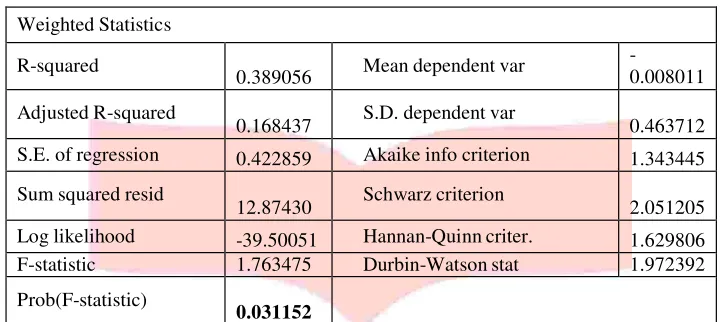
3.6 The coefficient of determination
The coefficient of determination (KD) provides interpretation of the influence of two variables, which is the square of the correlation coefficient. In this case the coefficient of determination used to know how much percentage of ROA, ROE, NPM, EPS, inflation, BI rate and exchange rate variable effect on stock returns tredaftar mining sector in Indonesia Stock Exchange (BEI) in the period 2010-2014.
Table 7. Coefficient Determination
Weighted Statistics
R-squared 0.389056 Mean dependent var -0.008011 Adjusted R-squared 0.168437 S.D. dependent var 0.463712 S.E. of regression 0.422859 Akaike info criterion 1.343445 Sum squared resid 12.87430 Schwarz criterion 2.051205 Log likelihood -39.50051 Hannan-Quinn criter. 1.629806 F-statistic 1.763475 Durbin-Watson stat 1.972392
Prob(F-statistic) 0.031152
3.7 Simultaneous Hypothesis Testing
0.168437 S.D. dependent var 0.463712 S.E. of regression 0.422859 Akaike info criterion 1.343445
Sum squared resid
12.87430 Schwarz criterion 2.051205
Log likelihood -39.50051 Hannan-Quinn criter. 1.629806
F-statistic 1.763475 Durbin-Watson stat 1.972392
Prob(F-statistic)
0.031152
Based on the above table can be seen that the probability of the F-statistic for 0.03115 with a confidence level of 95% (alpha = 0.05), then H0 is rejected because the probability value of F-statistic <alpha (0:05), so it may be decided to reject H0 and accept H1. This means that the ROA, ROE, NPM, EPS, inflation, BI rate and exchange rate variables simultaneously significant effect on stock returns.
3.8 Hypothesis Testing Partial
NPM Effect of Stock Return Against the Mining Sector Companies Listed on the Stock Exchange in 2010-2014
According to the table Random Effect Model are obtained the following results:
H0: Variable NPM partially no significant effect on stock returns mining companies listed on the Indonesia Stock Exchange
H1: Variable NPM partially significant effect on stock returns mining companies listed on the Indonesia Stock Exchange
From the data processing in the preceding table values obtained Prob NPM (0.0060) is below the value of alpha (0.05), so it was decided to accept H1.
EPS Effect of Stock Return Against the Mining Sector Companies Listed on the Stock Exchange in 2010-2014
According to the table Random Effect Model are obtained the following results:
H0: Variable EPS partially no significant effect on stock returns mining companies listed on the Indonesia Stock Exchange
H1: Variable EPS partially significant effect on stock returns mining companies listed on the Indonesia Stock Exchange
From the data processing in the preceding table values obtained Prob EPS (0.0494) is below the value of alpha (0.05), so it was decided to accept H1.
Inflation Effect of Stock Return Against the Mining Sector Companies Listed on the Stock Exchange in 2010-2014
According to the table Random Effect Model are obtained the following results:
H0: Variable Inflation partially no significant effect on stock returns mining companies listed on the Indonesia Stock Exchange
H1: Variable Inflation partially significant effect on stock returns mining companies listed on the Indonesia Stock Exchange
From the data processing in the preceding table values obtained Prob EPS (0.0162) is below the value of alpha (0.05), so it was decided to accept H1.
3.9 Regression Model
Based on hypothesis testing that has been done before, and PBV EPS variables significantly influence changes in the value of stock returns. Considering this, the panel data regression model as follows:
� = −�. ������ + �. ����𝟖𝟖�� + �. ��������+ �. �𝟖������ + �
�𝒓
� = −�. ������ + �. ����𝟖���𝑷� + �. ��������𝑷𝑺 + �. �𝟖����𝑰��𝒍��𝒕���� + �
Based on the regression equation, can be explained:
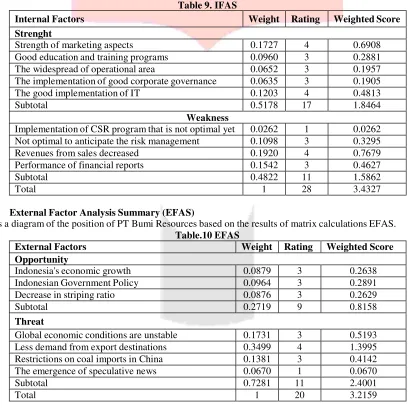
External Factors Weight Rating Weighted Score Opportunity
Indonesia's economic growth 0.0879 3 0.2638
Indonesian Government Policy 0.0964 3 0.2891
Decrease in striping ratio 0.0876 3 0.2629
Subtotal 0.2719 9 0.8158
Threat
Global economic conditions are unstable 0.1731 3 0.5193
Less demand from export destinations 0.3499 4 1.3995
Restrictions on coal imports in China 0.1381 3 0.4142
The emergence of speculative news 0.0670 1 0.0670
Subtotal 0.7281 11 2.4001
Total 1 20 3.2159
2. Coefficient Net Profit Margin (NPM) is positive in the amount of 0.016488. This suggests that any increase in the value of NPM of one per cent is predicted to increase by 0.016488 Stock Return assuming other variables constant value.
3. Coefficient Earning Per Share (EPS) is positive in the amount of 0.000130. This suggests that any increase in the value of one percent predicted EPS could increase Stock Return by 0.000130 assuming other variables constant value.
4. Inflation is positive coefficient that is equal to 0.085062. This suggests that any increase in the value of one percent inflation is predicted to increase by 0.085062dengan Stock Return assuming other variables constant value.
3.10 Strategy PT Bumi Resources Tbk
3.10.1 Internal Factor Analysis Summary (IFAS)
PT Bumi Resources Tbk has the smallest return when compared with other companies in the mining sector. Therefore, in select PT Bumi Resources for later analysis of the SWOT. Here is a diagram of the position of PT Bumi Resources based on the results of matrix calculations IFAS.
Table 9. IFAS
Internal Factors Weight Rating Weighted Score
Strenght
Strength of marketing aspects 0.1727 4 0.6908
Good education and training programs 0.0960 3 0.2881
The widespread of operational area 0.0652 3 0.1957
The implementation of good corporate governance 0.0635 3 0.1905
The good implementation of IT 0.1203 4 0.4813
Subtotal 0.5178 17 1.8464
Weakness
Implementation of CSR program that is not optimal yet 0.0262 1 0.0262 Not optimal to anticipate the risk management 0.1098 3 0.3295
Revenues from sales decreased 0.1920 4 0.7679
Performance of financial reports 0.1542 3 0.4627
Subtotal 0.4822 11 1.5862
Total 1 28 3.4327
3.10.2 External Factor Analysis Summary (EFAS)
Here is a diagram of the position of PT Bumi Resources based on the results of matrix calculations EFAS.
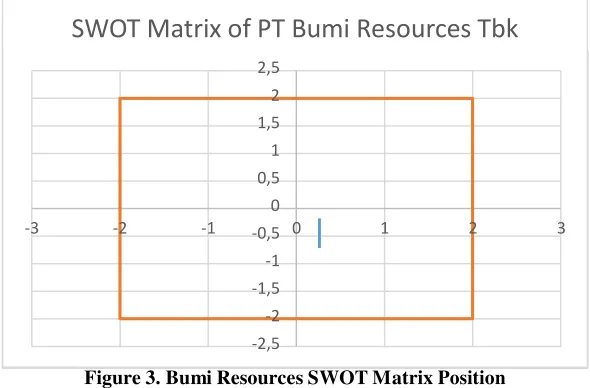
3.10.3 Strategy Recommendation
Based on total score of IFAS and EFAS, then SWOT Matrix can be made to indicate the position of the company and the strategy that should be done.
SWOT Matrix of PT Bumi Resources Tbk
2,5
2
1,5
1
0,5
0
-3 -2 -1 -0,5 0 1 2 3
-1
-1,5
-2
-2,5
Figure 3. Bumi Resources SWOT Matrix Position
Based on SWOT diagram the position of PT Bumi Resources Tbk is in quadrant II which use Strength and Threat (S- T) strategy. S-T strategy can be done by optimize strength and prevent a threat to the company's business. The suggested strategy is to open new potential market, improve IT services, maximize competency review and individual development plan for employee, pursue low cost, establish good relationship with media and press, minimizing operating cost, improve gross margin and optimize the use of financial leverage.
4. Conclusion
1. Return on Assets (ROA), Return on Equity (ROE), Net Profit Margin (NPM) and Earning Per Share (EPS); Inflation, BI Rate, and the dollar exchange rate have simultaneously significant effect on Stock Return on mining sector listed on the Stock Exchange in 2010-2014.
2. NPM, EPS, and Inflation partially has significant influence on stock return in mining sector companies listed in Indoensia Stock Exchange year 2010-2014. While ROA, ROE, BI Rate and Exchange Rate has not significant influence on stock return in mining sector companies listed in Indoensia Stock Exchange year 2010-2014.
3. Bumi Reources is the company with the lowest total return during period of observation that took 20 samples, so Bumi Resources was chosen in mining sector to do the analysis of the strategy. Bumi Resources position is in quadrant II which is using combination of ST strategy by optimize strength and prevent a threat to the company's business.
Reference:
[1] Ang, Robert. (1997). Buku Pintar Pasar Modal Indonesia. Jakarta: Media Staff Indonesia.
[2] Tandelilin, E. (2010). Portofolio dan Investasi Teori dan Aplikasi. Yogyakarta: Kanisius.
[3] Rangkuti, Freddy. (2014). Teknik Membedah Kasus Bisnis Analisis SWOT: Cara Perhitungan Bobot, Rating dan