O R I G I N A L A R T I C L E
Cross-Cultural Comparison of Nonverbal
Cues in Emoticons on Twitter: Evidence from
Big Data Analysis
Jaram Park1, Young Min Baek2, & Meeyoung Cha1
1 Graduate School of Culture Technology, Korea Advanced Institute of Science and Technology, Daejeon, 305-701, Republic of Korea
2 Department of Communication, Yonsei University, Seoul, 120-749, Republic of Korea
Relying on Gudykunst’s cultural variability in communication (CVC) framework and culture-specific facial expressions of emotion, we examined how people’s use of emoticons varies cross-culturally. By merging emoticon usage patterns on Twitter with Hofstede’s national culture scores and national indicators across 78 countries, this study found that people within individualistic cultures favor horizontal and mouth-oriented emoticons like :), while those within collectivistic cultures favor vertical and eye-oriented emoticons like ^_^. Our study serves to demonstrate how recent big data-driven approaches can be used to test research hypotheses in cross-cultural communication effectively from the methodological triangulation perspective. Implications and limitations regarding the findings of this study are also discussed.
doi:10.1111/jcom.12086
People learn how to communicate their thoughts, feelings, and values from their shared culture (Gudykunst, 1997; Gudykunst & Lee, 2005). Culture, in other words, is expected to shape both verbal and nonverbal communication. In this sense, Gudykunst et al. (1996) argued that the “styles individuals use to commu-nicate vary across cultures” (Gudykunst et al., 1996, p. 511). In particular, cultural individualism–collectivism (e.g., Gudykunst et al., 1996; Hall, 1976; Hofstede, Hofstede, & Minkov, 2011) has been considered as the most important factor in explaining how culture influences people’s communication styles, including language use, self-presentation, and nonverbal cues.
The purpose of this study is to examine how cross-cultural differences influence people’s use of nonverbal cues on the Internet, specifically their use of emoticons on Twitter, one of the most popular text-based social network services (SNSs) in the world. To the best of our knowledge, most studies on text-based computer-mediated communication (CMC) have focused on the exchange of linguistic information;
people’s use of nonverbal cues has received far less attention. Users of SNSs such as Twitter and Facebook actively communicate through textual messages, where nonverbal cues have little presence (Dunlap & Lowenthal, 2009). To supplement the lack of nonverbal cues in text-based CMC through websites such as Twitter, as well as to augment the relational meaning of messages, users utilizeemoticons, which are graphic representations of facial expressions (Walther & D’Addario, 2001, p. 324). Emoticons in text-based CMC serve important social functions during interaction (Provine, Spencer, & Mandell, 2007) and help people to interpret nuances of meaning, attitudes of the conversational partner, and levels of emotion not captured by verbal elements alone (Gajadhar & Green, 2005).
Some cross-cultural psychologists have noted that emoticon usage varies accord-ing to users’ cultural background, especially in the individualism–collectivism dimension. For example, East Asians (people living within collectivistic cultures, such as Korea, China, and Japan) employ a vertical style as in ^_^, while West-erners (those living within individualistic cultures, such as North American and European countries) favor a horizontal style as in :-) (Yuki, Maddux, & Masuda, 2007). Moreover, studies have demonstrated that cross-cultural differences in how emoticons are perceived can be traced to differences in the facial cues that people from the East and West seek when detecting emotions (Jack, Garrod, Yu, Caldara, & Schyns, 2012; Yuki et al., 2007). In general, individualistic cultures emphasize the
self, while collectivistic ones highlight shared values in a society. For this reason, people from individualistic cultures are more likely to be trained to express their feelings through explicit cues, whereas those from collectivistic cultures are taught to suppress personal feelings, conveying them indirectly through subtle cues (Nisbett & Masuda, 2003). Some cross-cultural psychologists have conducted experiments showing that people’s evaluations of emoticons are influenced by their culture and preferred cultural cues (Yuki et al., 2007).
Although emoticons have many interesting implications for cross-cultural communication research, existing studies on emoticons suffer from two kinds of limitations. First, previous cross-cultural emoticon studies compared a small number of countries, such as Japan to represent East Asian culture (Yuki et al., 2007) and the United States to represent Western culture (for a similar critique, see Heine, 2010). The limited scope of such research results in a lack of generalizability. Second, although experimental studies are good at confirming causal inference, their findings are often based on artificial experimental designs (Shadish, Cook, & Campbell, 2002). Experimental studies that confirm theorized cross-cultural differences in the detection of facial cues do not necessarily test whether such perceptual differences lead to differences in how users express emotions through the use of facial nonverbal cues. In short, there remains a gap in understanding between how peopleinterpret
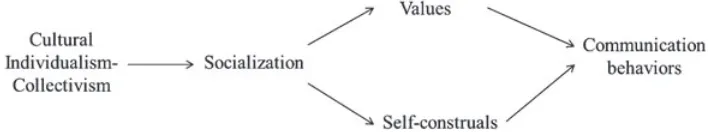
Figure 1 Gudykunst’s cultural variability in communication framework.Source: Gudykunst et al. (1996, p. 512).
This study aims to identify cross-cultural differences in people’s use of emoticons as nonverbal cues by systematically crawling a near-complete corpus of tweets from around the world (549 GB in size, containing 1,755,925,520 tweets). When commu-nicating on Twitter, users’ activities are recorded, stored, and cumulated, making it possible to extract theoretically meaningful information from large-scale online activ-ities (e.g., see Miller, 2011; O’Reilly Media, 2012). Furthermore, the text on Twitter is publicly accessible, and animation emoticons (such as instead of :-)) are not enabled. To quantify cross-cultural differences in the individualism–collectivism dimension, Hofstede’s national culture scores are utilized. Although Hofstede’s culture scores are based on an unrepresentative sample (Hofstede et al., 2011, pp. 34–38) that undeni-ably differs from the demographic profile of Twitter users, his scores are the most comprehensive measures available and cover most industrialized countries, where there is solid Internet infrastructure and Twitter is actively used. In addition, this study attempts to control the potential influence of economic well-being on cultural shifts (Inglehart & Welzel, 2005) and the adoption of Twitter by using national official statistics published by the World Bank. By merging data-mined tweets with Hof-stede’s national culture scores and World Bank data, this study aims to (a) sketch cross-cultural differences in actual emoticon use and (b) test whether prior experi-mental findings validating cross-cultural theories are confirmed on a worldwide scale by communication on Twitter.
Conceptual framework for cultural variability in communication and facial expression
In Gudykunst’s CVC model, “the major dimension of cultural variability … is
individualism–collectivism” (Gudykunst, 1997, p. 331, emphasis added). In general, the self is emphasized in individualistic cultures, and thus one’s communication behaviors (either verbal or nonverbal) are expected to clearly express one’s own views or feelings with explicit signs or cues. In contrast, thegrouporcooperationis more valued in collectivistic cultures, where communication behaviors are less assertive and indirect, relying on implicit signs or cues, in order to protect others’ “face-work” (e.g., Gudykunst et al., 1996; Hall, 1976).
Although not based on Gudykunst’s CVC model, the cross-cultural psychology literature has repeatedly shown how cultural individualism–collectivism influences facial expressions of emotion (Ekman, 1992; Heine, 2010; Marsh, Elfenbein, & Ambady, 2003; Nisbett & Masuda, 2003). Studies on facial expressions and emotions across cultures are generally consistent with those adopting Gudykunst’s frame-work. In general, people within individualistic cultures are relatively free to express their feelings, and therefore facial expressions of emotion are more direct and less constrained. People within collectivistic cultures, however, are more attentive to decoding others’ feelings so as to keep their face-work, and thus facial expressions of emotion are more indirect and less explicit.
To examine how cross-cultural variability influences the use of emoticons on Twitter, this study relies on Gudykunst’s CVC framework while incorporating insights about facial expressions of emotion from cross-cultural psychology. The next sections describe how emoticons, defined as graphic representations of facial expressions (Walther & D’Addario, 2001), can be investigated under the expanded CVC framework.
Emoticons on Twitter: Textual representation of nonverbal cues revealing of emotions
and the use of emoticons surged during the holidays, when messages tended to be relational rather than informational. Additionally, among the emoticons used in the messages, about 65% were smiley faces like :-) or :), and 8% were frown faces like :( or :-(. Rezabek and Cochenour’s study indicates that the popularity of emoticons in academic discourse dates back at least to the 1990s.
To the best of our knowledge, the systematic content analysis of emoticon use by Rezabek and Cochenour (1998) was the first of its kind. However, their textual cor-pus suffered from limitations in scope, language, and genre. The results of their study strongly imply that text-oriented communication on Twitter should include active use of emoticons, given that the most important functions of social media are building or maintaining relationships (boyd & Ellison, 2007). Considering the substantial gap in time between their study and ours, as well as the wide diffusion of social media like Facebook and Twitter that has occurred in the interim, our study is of both theo-retical and practical interest for understanding how people use emoticons on social media. We overcome the limitations of small-scale, manual content analyses of online text (e.g., Rezabek & Cochenour, 1998), as our big data-driven approach exploits a near-complete corpus of content from Twitter.
Cultural individualism–collectivism and emoticon use on Twitter
Emoticons are, essentially, textual representations of facial expressions conveying the writer’s emotional state, such as happy, angry, and sad. As indicated in a series of nonverbal communication studies (Ambady & Weisbuch, 2010; Burgoon et al., 2010), cross-cultural scholars have not yet reached a consensus on whether facial expressions are universal or culture-specific. As one study noted, “the answer (may) lie somewhere in the middle” (Marsh et al., 2003, p. 373). In this work, we argue that emoticons are culture-specific for the following two reasons.
explored earlier in this article, it follows that this activity must be culture-specific. In short, emoticon use must be influenced by the national culture where users reside.
Second, studies have reported that people from individualistic cultures read a conversation partner’s emotions by focusing on the zygomatic major (a muscle around the mouth), while those from collectivistic cultures infer their partner’s emotions by detecting movement of the orbicularis oculi (a muscle around the eyes) (Ekman, 1992). On the basis of these anatomical facts, cross-cultural psychologists have emphasized two points. First, the mouth takes up a larger area of the face than the eyes, meaning that a change in mouth shape is more easily noticeable than a change in eye shape. Second, because the zygomatic major is a larger muscle than the orbicularis oculi, it is easier to consciously control the shape of the mouth than of the eyes (Ekman, 1992). These are important facts in explaining the cultural variability in facial expressions of emotions. Given that people from collectivistic cultures are trained to suppress their feelings (Nisbett & Masuda, 2003), it is understandable why eye-oriented facial expressions are emphasized in such cultures; such expressions arise naturally from movement of the orbicularis oculi, which is harder to control than the zygomatic major. In contrast, for people from individualistic cultures who are taught to express their feelings, movement of the zygomatic major is an easier—albeit unnatural—cue for reading others’ feelings. When users of Twitter deliberatively select emoticons to convey their intended emotions, people from collectivistic cultures will emphasize the shape of the eyes. Likewise, people from individualistic cultures will highlight the shape of the mouth.
Several experimental studies have shown that cultural variation exists in emo-tion recogniemo-tion. The influence of culture on the reading of emoemo-tions is also detected at the level of the individual (Mai et al., 2011). This work builds upon these exist-ing findexist-ings by attemptexist-ing to shed light on the relationship between national cul-ture and emoticon use in social media, and constructs two research hypotheses. The first hypothesis predicts how cultural individualism–collectivism is related with the way in which emoticons are read. Specifically, H1 predicts thatpeople from individ-ualistic cultures favor horizontal-style emoticons emphasizing the shape of the mouth (e.g.,:)or:-)), while those from collectivistic cultures use vertical-style emoticons focus-ing on the shape of the eyes (e.g.,^_^ or ^.^) (H1). The second hypothesis exam-ines how cultural individualism–collectivism influences the choice of emphasized facial cues for emotion expression. Specifically, H2 anticipates thatpeople from indi-vidualistic cultures express emotions by changing the shape of the mouth (e.g.,:-)for happiness and:-(for sadness) (H2a), while those from collectivistic cultures convey emo-tions by modifying the shape of the eyes (e.g.,^_^for happiness andT_Tfor sadness) (H2b).
Methods
Cropping tweets from all over the world
Our key data comprised emoticons used on Twitter. In order to obtain global emoti-con usage patterns, we used a corpus of near-complete Twitter data emoti-containing the entire first 3.5 years’ worth of tweets (2006–2009) as well as the geo-locations of users. This data covered all user IDs in Twitter except for the 8% of users who set their accounts as private and disallowed access by Web crawlers. We relied on Cha and colleagues’ (Cha, Haddadi, Benevenuto, & Gummadi, 2010) Web crawler and Twitter application programming interface (API).1
The Twitter data consists of 1,755,925,520 tweets, 54,981,152 users, and 1,963,263,821 follow links, where the follow links are based on a topology snap-shot obtained from August to September 2009. The 1.7 billion tweets were posted by the 55 million users. Each tweet entry contains the tweet content as well as the corresponding time stamp, while the user information consists of the number of tweets, followers, and followees, as well as the start date of the account and the geo-location (i.e., location name and time zone). This study focused mainly on tweets with emoticon-like expressions identified by guidelines in Wikipedia.2
Identifying geo-location information
In order to classify users into countries, we utilized the geo-location information on user profiles in a similar manner to other studies (Golder & Macy, 2011; Kulshrestha, Kooti, Nikravesh, & Gummadi, 2012). In particular, we relied on Kulshrestha et al.’s (2012) inference method, which obtained location information entered by the user as a free-text string and time zone entries and inferred the country using a public API provided by Yahoo Maps and Bing Maps.3These authors compared the resolved
coun-try information from three sources (i.e., Yahoo Maps, Bing Maps, and the time zone) and consequently obtained the geo-location information of 12,220,719 users. These users accounted for 23.5% of all users (73.65% of all tweets) in the dataset, distributed across 231 countries.4
Detection of emoticons on Twitter and country-level aggregated tweet use
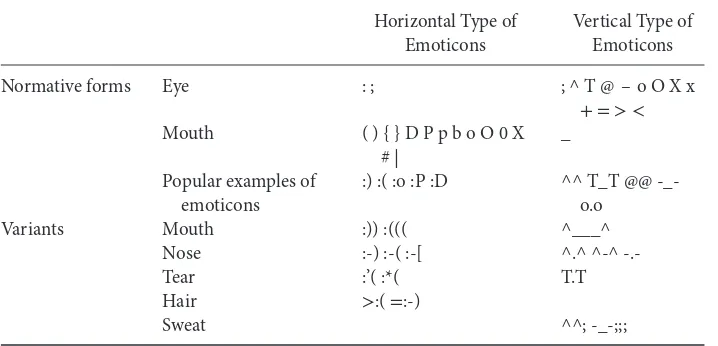
We used two kinds of emoticons as defined in existing research (Yuki et al., 2007): horizontal and vertical. Horizontal emoticons like :), which are commonly used in Western countries, emphasize the shape of the mouth, whereas vertical emoticons like ^_^, which are widely used in East Asian countries, highlight the shape of the eyes.
Table 1 Classification of Emoticons on Twitter
Horizontal Type of Emoticons
Vertical Type of Emoticons
Normative forms Eye : ; ; ^ T @ – o O X x
+ => < Mouth ( ) { } D P p b o O 0 X
# |
_
Popular examples of emoticons
:) :( :o :P :D ^^ T_T @@ -_-o.o
Variants Mouth :)) :((( ^___^
Nose :-) :-( :-[ ^.^ ^-^
-.-Tear :’( :*( T.T
Hair >:(=:-)
Sweat ^^; -_-;;;
Source: The emoticons are drawn from those listed on Wikipedia. Only popular emoticons on Twitter are introduced. For the full list of emoticons, please visit http://en.wikipedia.org/wiki/ List_of_emoticons.
On the basis of the list of emoticons drawn from Wikipedia and their variants, we obtained 15,059 distinct forms of emoticons, which appeared a total of 130,957,062 times over 3.5 years on Twitter. While about 15,000 emoticons were used, their pop-ularity distribution resembles the so-called heavy-tail distribution, indicating that a small fraction of emoticons had a disproportionately large share of total usage. In par-ticular, only 517 emoticons appeared more than 1,000 times, and 76% of all emoticons appeared fewer than 10 times. The top 517 emoticons account for more than 99% of all emoticon usages, implying that this small set might be enough to cover the key usage pattern of emoticons on Twitter.
the most popular was :) (n=61,886,521), where the mouth expresses happiness but the eyes do not reveal any specific emotion (i.e., neutral).
Using the geo-location information, we aggregated emoticon usages by country for cross-cultural comparison.
Sample
To test our research hypotheses, we merged three distinct datasets published indepen-dently by three different agencies. The first data source was generated by our group: big data from Twitter. As mentioned earlier, this dataset includes a near-complete set of tweets, the automatically identified geo-location of each user, and the country-level aggregation of tweets and emoticons. The average number of emoticons per coun-try (N=78) was 1,213,163 (SD=5,391,959,Median=161,574). To adjust the skewed distribution, the number of emoticons was log-transformed using 10 as a base in the analyses (M=5.13,SD=.97,Median=5.19).
The second data source is Geert Hofstede’s national culture scores.5 Hofstede
(Hofstede et al., 2011) provided a four-dimensional model of national culture to explain cultural differences. These national culture scores were calculated by aggre-gating survey responses with regard to self-reported attitudes from International Business Machine (IBM) workers (Hofstede et al., 2011, pp. 29–32).6The four scores
are: (a) power distance (PDI), where countries with high PDI consider inequality between members of a society to be normal; (b) femininity vs. masculinity (MAS), where countries with high MAS put more emphasis on assertiveness and competition between members of a group; (c) uncertainty avoidance (UAI), where countries with high UAI are more tolerant of uncertainty or ambiguity and more open to an unpredictable future; and, finally, (d) collectivism vs. individualism (IDV), where countries with high IDV emphasize “I” rather than “we.”
The cultural indexes used in this study have clear limitations. Hofstede constructed his model based on survey data from employees of a multinational corporation. There-fore, the representativeness of the sample is low because participants were highly educated, white-collar professionals (Voronov & Singer, 2002). The demographic pro-file of Hofstede’s sample and that of Twitter users are not clearly matched. Moreover, Hofstede’s cultural dimensions were generated by an analysis of face-to-face interac-tion in organizainterac-tional contexts (Voronov & Singer, 2002). This study, in contrast, is based on Twitter, where people interact mainly through 140 characters, without any facial cues. Such limitations should be taken seriously when interpreting the findings. The third data source is composed of the World Bank national indicators.7The
World Bank annually gathers and provides basic country-level statistics from nearly all of the countries in the world. These national indicators were used to control for statistical measures, as economic development and the status of Internet diffusion are expected to influence people’s use of Twitter.
Measures of main interest Type of emoticons
On the basis of manual coding, both vertical and horizontal emoticons were aggre-gated by country. The average number of vertical emoticons used in a given country was 88,062 (SD=295,223, Median=10,468, ranging between 3 and 2,272,331) and that of horizontal emoticons per country was 1,140,291 (SD=5,193,988,
Median=150,006, ranging between 206 and 45,201,022), indicating a skewed dis-tribution. The numbers were log-transformed using 10 as a base, and emoticons of the horizontal (M=5.09,SD=.98,Median=4.72) and vertical (M=3.96,SD=1.09,
Median=4.02) type were used in analyses.
Percent of vertical emoticons
We define several quantitative measures. First, percent of vertical emoticons (PVE) measures the percentage of vertical emoticons (e.g., “^_^”) out of the total con occurrences in a given country. For example, if there are a total of 1,000 emoti-con usages, where 300 are vertical and 700 are horizontal, that country’s PVE is 30. The average PVE value across all 78 countries was 9.94 (SD=13.21,Median=5.55, ranging between .96 and 80.71), and this distribution was also highly skewed to the right. We took a logarithm of base 10 to adjust any skewedness (M=.80,SD=.38,
Median=.74, ranging between−.02 and 1.91).
Percent of mouth-oriented emoticons
The next measure, percent of mouth-oriented emoticon (PME) use, denotes the percentage of horizontal emoticons whose emotional expression is dependent on the shape of the mouth. Both the mouth and eyes can convey happy, sad, or neutral emotional states. PME quantifies the percent of emoticons whose eyes are neutral but whose mouth is either happy or sad; for instance, “)” in “:)” expresses happiness while “(”in “:(” expresses sadness. Across the 78 countries, the average PME was .74 (SD=.13,Median=.66, ranging between .17 and .90). Because this distribution is not skewed, we did not apply any transformation before data analysis.
Percent of eye-oriented emoticons
The final measure we introduce, percent of eye-oriented emoticon (PEE) use, denotes the percentage of vertical emoticons whose emotional expression is dependent on the shape of the eyes. Similar to PME, PEE quantifies the fraction of emoticons whose mouth is neutral but eyes are judged to be either happy or sad; for instance, “^” in “^_^” expresses happiness while “T” in “T_T” expresses sadness.
The average PEE was .08 (SD=.12,Median=.05, ranging from .01 to .77). Sim-ilar to PVE, PEE is skewed to the right and was log-transformed for data analysis (M= −1.30, SD=.40,Median= −1.34, ranging from−2.15 to−.16).
National culture scores
national culture scores do not show any particularly skewed distribution; hence, we use their values without any transformation. Descriptive statistics of the four scores are: (a) power distance (M=61.95, SD=21.59), (b) femininity versus masculinity (M=49.55,SD=17.01), (c) uncertainty avoidance (M=66.72,SD=22.81), and (d) individualism versus collectivism (M=41.00,SD=23.13).
Measures of statistical controls Number of tweets per country
We control for several factors that could affect our hypothesized relationships. First, the number of tweets per country was controlled, as it is expected to posi-tively correlate with the number of emoticons on Twitter. We calculated the total number of tweets per country by using the geo-location information of users. The most active country was the United States with 776,779,266 tweets and 7,056,051 users. The average number of tweets per country was 16,438,230 (SD=88,497,460,
Median=1,504,682), indicating that this distribution is highly skewed. We therefore log-transformed this quantity, using 10 as a base (M=6.11,SD=.95,Median=6.17).
Gross domestic product per capita of a country
A country’s gross domestic product (GDP) per capita was controlled for two rea-sons. First, previous research has shed light on the relationship between economic status and users’ activities on Twitter (Garcia-Gavilanes, Quercia, & Jaimes, 2013). The study found that people living in poor countries, compared to those in wealthy countries, are more likely to enjoy SNSs like Twitter in their working hours. Second, previous research using Hofstede’s national scores has reported strong correlations between economic status and scores in the five dimensions (Hofstede et al., 2011). In short, GDP per capita is suspected to be associated with both outcome measures and national culture scores.
We used the GDP per capita data published by the World Bank. We retrieved the 2009 data to be consistent with the time of data crawling. The average GDP per capita was US$ 19,608 (SD=20,420,Median=10,287), showing a skewed distribu-tion. Thus, the log-transformed GDP per capita (M=3.98,SD=.60,Median=4.01) was used in analyses.
Status of Internet diffusion in each country
Results
Emoticon use among Twitter users
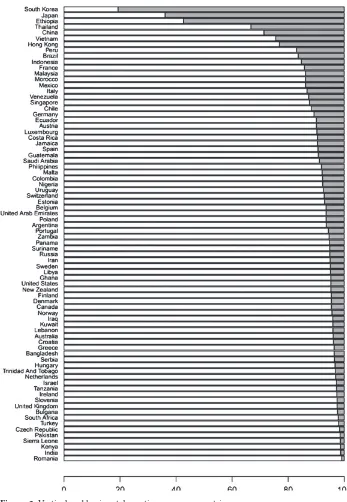
Before testing the research hypotheses, we first describe high-level characteristics of emoticon use on Twitter. First, we compare the distribution of horizontal and ver-tical emoticons across 78 countries in Figure 2, where the white bars represent the proportion of horizontal emoticons and the gray bars represent the proportion of ver-tical emoticons. As seen in this figure, South Korea and Japan mostly favor verver-tical emoticons. Except for Ethiopia, most other countries favoring vertical emoticons are East Asian countries (i.e., Thailand and China). While Ethiopia seems very active in using vertical emoticons, there were only 371 Twitter users, and the country had low Internet diffusion (.54 per 100 inhabitants). Therefore, Ethiopia, a country with a col-lectivistic national culture but located on the African continent, should be considered separately from East Asian countries.
Second, we examined how two types of facial cues (i.e., eye-oriented vs. mouth-oriented cues) are differently represented in horizontal and vertical emoti-cons. As shown in Table 2, the two types of cues differ according to the verticality of the emoticons. For horizontal emoticons, the shape of the eyes often conveys a neutral state (84%), while the mouth shape acts as the major emotional signal, i.e., 84% for happiness and 13% for sadness. In contrast, among vertical emoticons, mouth shape is usually neutral (66%), while the shape of the eyes represents happiness (40%) or sadness (34%). The findings in Table 2 clearly show that vertical emoticons mainly rely on the shape of the eyes to represent emotional state, while horizontal emoticons mainly depend on the shape of the mouth for emotional expression.
So far, we have gained insights into the different usages of vertical and horizon-tal emoticons. Next, we delve deep into finding empirical evidence to test our main research hypotheses.
Relationship between national culture and vertical or horizontal emoticon use
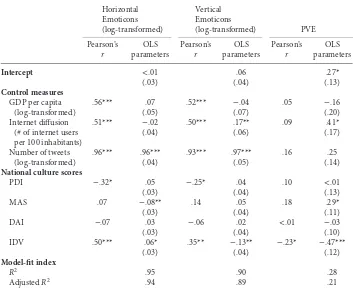
The first hypothesis suggests that horizontal emoticons are favored in countries with individualistic cultures while vertical emoticons are favored in countries with collectivistic cultures. To test this hypothesis, both national culture scores and con-trol measures are used to predict three outcome measures: (a) horizontal emoticons, (b) vertical emoticons, and (c) PVE (out of total emoticons). Table 3 provides results of the first hypothesis using ordinary least squares (OLSs) regression. In order to clarify the effectiveness of the multivariate test compared to the bivariate test, the Pearson correlation coefficients between predictors (i.e., both national culture scores and control variables) and each outcome are provided with the results of OLS regressions. As shown in Table 3, results demonstrate that adding adequate control measures is of utmost importance. The most striking finding is obtained in the relationship between IDV and vertical emoticon use. Pearson correlation coefficients imply that individualistic cultures are associated with the use of vertical emoticons (r=.35,
Figure 2 Vertical and horizontal emoticons across countries.
Table 2 Emotional State Represented by Facial Cues in Horizontal and Vertical Emoticons
Mouth Shape
Eye Shape Happy Neutral Sad Total (eye shape)
Horizontal
Note:Number of emoticons entered with percent in parentheses.
is striking because judgments concerning the relationship could be misguided if scholars rely on the bivariate correlation test. The finding is consistent with the result shown in the last column of Table 3. As shown in this table, countries with indi-vidualistic cultures show lower PVE (i.e., PVE;b= −.47, p<.001), which provides empirical support for our first hypothesis.
Another interesting finding is the relationship between MAS and horizontal emoticon use. While the bivariate relationship shows that there is no relationship (r=.07,p=n.s.), multivariate testing clearly shows that horizontal emoticon use is less popular among countries that emphasize competition and assertiveness (b= −.08,
p<.01). This finding is also confirmed in the last column, adopting PVE as the outcome variable (b=.29,p<.05), because vertical emoticons are detected more fre-quently among countries with high MAS. According to Fernández, Carrera, Sánchez, Páez, and Candia (2000), countries with high MAS express verbal and nonverbal emotions less frequently than those with low MAS. Furthermore, they tend to have better control over their emotional expression, particularly for negative emotions. Therefore, people from such cultures may want to deliver their emotional expression through vertical emoticons that focus on eye shape, which cannot be controlled easily and are perceived as more sincere facial cues (Mai et al., 2011; Yuki et al., 2007).
Table 3 Relationship Between National Culture and Use of Vertical or Horizontal Emoticons on Twitter Across Countries (N=78)
Horizontal
Note: All predictors are rescaled 0 to 1, in order to compare their effect sizes on each outcome variable. DAI=uncertainty avoidance; GPD=gross domestic product; IDV=collectivism vs. individualism; MAS=femininity vs. masculinity; OLS=ordinary least squares; PDI=power dynamics; PVE=percent of vertical emoticons.
*p<.05. **p<.01. ***p<.001.
on multivariate testing (b=.05,b=.04,p’s=n.s., respectively). Given that a signifi-cant relationship is not detected when predicting PVE, the bivariate correlations may represent spurious relationships.
To summarize the results in Table 3, our first hypothesis succeeds in obtaining empirical evidence, indicating that people from individualistic cultures more fre-quently use horizontal emoticons on Twitter than those from collectivistic cultures, who in turn favor vertical emoticons.
Relationship between national culture and emotional expression of facial cues
Table 4 Relationship Between National Culture and Expression of Emotions Using Emoticons on Twitter Across Countries (N=78)
PME PEE
Pearson’sr OLS parameters Pearson’sr OLS parameters
Intercept .95***
Note: All predictors are rescaled 0 to 1, in order to compare their effect sizes on each outcome variable. DAI=uncertainty avoidance; GPD=gross domestic product; IDV=collectivism vs.
individualism; MAS=femininity vs. masculinity; OLS=ordinary least squares; PDI=power
dynamics; PEE=percent of eye-oriented emoticons; PME=percent of mouth-oriented
emoticons.
*p<.05. **p<.01. ***p<.001.
hypothesis, the results of bivariate and multivariate tests are simultaneously provided in Table 4.
collectivistic cultures show a higher degree of eye-oriented emotional expression. Therefore, the second hypotheses successfully received empirical support.
Second, countries with high MAS show lower PME (b= −.25,p<.05) and higher PEE (b=.28,p<.05). With similar theoretical logic as that used to explain the nega-tive relationship between MAS and PVE, countries with high MAS suppress emotion, which drives people from such cultures to deliver their emotional expressions by focusing on eye shape. This is because eye muscle movement cannot be easily con-trolled and thus is perceived as a more sincere facial cue, as pointed out in previous experimental studies (Yuki et al., 2007).
In summary, our results provide strong evidence that the individualism– collectivism dimension successfully predicts the type of emoticon (vertical or hori-zontal) as well as the style of facial cues a user will adopt in his or her emoticon usage. In addition, we found the femininity–masculinity dimension of national culture to be an important factor predicting people’s choice of emoticon style.
Discussion
Relying on Gudykunst’s CVC framework (Gudykunst, 1997; Gudykunst & Lee, 2005), our study examined how people use emoticons as nonverbal cues in com-munication via Twitter and how national culture influences people’s choice of emoticons. We merged near-complete Twitter data with national indicators and Hofstede’s national culture scores (Hofstede et al., 2011) to examine cross-cultural differences in emoticon use across countries and to test research hypotheses derived from cross-cultural theories and previous experimental studies on emoticon use. By merging three country-level datasets gathered by independent agencies, our study provides empirical evidence on a worldwide scale concerning national culture’s influence on emoticon use.
Cross-cultural studies of facial expression (Jack et al., 2012) and emoticon use (Yuki et al., 2007) were incorporated into Gudykunst’s CVC framework to construct two research hypotheses. The first hypothesis tested whether vertical-style emoticons are more frequently used among countries with collectivistic cultures. The results showed that countries with more individualistic cultures had a lower percentage of vertical emoticons, supporting the first hypothesis. Additionally, the style of emoticon (i.e., vertical or horizontal) differed according to the femininity–masculinity (MAS) dimension of national culture. Findings in previous experiments comparing only two countries (Yuki et al., 2007) were successfully replicated in our study relying on more countries (N=78).
We believe this study has a number of important theoretical and methodologi-cal implications. Theoretimethodologi-cally, this study is, to the best of our knowledge, the first cross-cultural comparison of emoticon use based on unstructured, textual big data. Previous findings based on experimental designs are limited in that they are artificial. In contrast, our study shows how people in real and natural settings use nonverbal cues when constrained to using only 140 characters in a Twitter message. The world-wide comparison enables us to overcome the lack of generalizability from which prior studies comparing only a few cultures suffered. In this sense, our findings demon-strate the importance of methodological triangulation in social science research; this is defined as “the use of multiple methods to study one research question” (Schutt, 2006, p. 18). Experimental studies from which our hypotheses are derived are good at confirming causal inference but limited in their representativeness. While the national survey method is often recommended to achieve representative findings, it is very dif-ficult to conduct such surveys across a large number of countries (even when using convenience survey samples). In this respect, big data on the Internet, although not necessarily providing a representative sample for a given country, can serve as a great resource for examining cross-cultural differences reported in experimental studies of limited scope and with small numbers of participants, without requiring excessive effort or time. Our study, in this sense, serves to demonstrate how big data approaches can advance social scientific knowledge as well as communication theory.
Methodologically, our study clearly shows the potential problems of conven-tional big data analyses that focused on descriptive and bivariate statistics such as correlation coefficients (e.g., Cha et al., 2010; Kwak, Lee, Park, & Moon, 2010; Miller, 2011; Thelwall, Buckley, & Paltoglou, 2011). Of course, these studies are informative and interesting in their own right. However, exploratory big data approaches that rely on descriptive statistics could be misguided, as such statistics might suffer from well-known statistical inferential problems such as omitted variable bias or confounding factors (Rosenbaum, 1995). Our findings strongly imply that modeling relationships between variables extracted from big data must be guided by theoretical reasoning, and necessary control variables may be added from other data sources (not necessarily big data).
Second, Twitter popularity is not equally distributed across countries. Although a country’s economic status is controlled in our findings, there are other confounders affecting Twitter popularity. For example, Twitter has been blocked in China since June 2009, replaced by local SNSs (e.g., Weibo). Because we gathered tweets from 2006 to 2009, China’s Twitter blocking policy might not pose a serious problem for our results. In fact, out of a total of 6,161,664 tweets from any location in China, about 76% were encoded in Chinese, indicating that most tweets were written by Chinese people. Furthermore, we conducted analyses after dropping China from our sample and obtained virtually identical results to those reported in Tables 3 and 4. Concerns about Twitter popularity are still legitimate, however, because there are many alterna-tive SNSs competing with or replacing Twitter in non-U.S. countries (e.g., me2day in Korea, Koprol in Indonesia, and Weibo in China).
Third, Twitter users are not a representative sample of a given country. As has been noted frequently, social media users (including Twitter users) are wealthier, younger, and more educated compared to the general population (e.g., for the United States see Smith, 2011). Also, as has been noted in international comparison studies, the sub-cultures of younger populations in less developed or developing countries are more Westernized compared to older populations (see Inglehart & Welzel, 2005; Norris & Inglehart, 2009). Hence, there is an inherent lack of representativeness in Twitter data, regardless of how big the data may be. Nonetheless, the representativeness of emoti-con use is meaningful for young populations (not the whole population), who are the primary users of emoticons and who are also active on Twitter. In this sense, the lack of representativeness in comprehensive big data, at least in this study, does not seriously hurt the validity of the findings.
Fourth, we aggregated big data into country-level, small-sized data. While aggre-gation is not a bad strategy for cross-cultural or international comparison, it sacrifices valuable individual-level information. For example, at the individual level, an anal-ysis of the effect of Twitter users’ gender, age, or other personal characteristics on emoticon use would be expected to lead to theoretically important findings. In this respect, both individual-level and message-level analyses are promising and theoreti-cally fruitful. In this work, we did not consider individual characteristics, as this field is still in an early stage despite considerable advances in recent applications (e.g., see Al Zamal, Liu, & Ruths, 2012; Sharma, Ghosh, Benevenuto, Ganguly, & Gummadi, 2012). Although our study adopts a convenient method of comparing cross-cultural emoti-con use, future algorithmic advances will provide a helpful methodological infras-tructure for the development of communication theories.
to control confounders hurts the validity of our findings. At the present stage, we cannot obtain reliable data sources for the confounders and lack adequate knowledge for classifying countries according to such confounders. Future research on the relationship between national culture and communication behaviors should consider such potential confounding factors.
Despite these limitations, we believe our study is the first to demonstrate cul-tural differences in the use of nonverbal cues in text-based CMC using a dataset naturally generated by users, and hence it serves as a valuable example of how big data approaches can help communication scholars refine and advance their theories from the perspective of methodological triangulation. Our study shows how a big data approach guided by a theoretical framework can be used for hypothesis testing, which is necessary to advance theory-based research in the social sciences and communication fields.
Endnotes
1 Details can be found at https://dev.twitter.com.
2 The list of emoticons can be found at http://en.wikipedia.org/wiki/List_of_emoticons. 3 Details concerning Yahoo Maps are available at http://developer.yahoo.com/maps/;
information on Bing Maps can be found at
http://www.microsoft.com/maps/choose-your-bing-maps-API.aspx.
4 The inference methodology used in Kulshrestha et al. (2012) could be biased for the following reasons: (a) Users from different countries may have different probabilities of sharing their location with online friends (e.g., Japanese users may be more hesitant to do so than American users); (b) the country information was not perfectly resolved by using the map APIs (i.e., map APIs do not always provide correct locations); and (c) even when the resolved geo-locations are accurate, users may come from different cultures (e.g., Korean American users would be expected to display an emoticon usage distinguishable from that of European Americans).
5 Hofstede’s five-dimensional scores are publicly available at http://geert-hofstede.com/dimensions.html.
6 There are two more dimensions,long-term orientationandindulgence versus restraint(see Hofstede et al., 2011, pp. 37–38, pp. 44–45, respectively), which this study does not consider because the long-term orientation dimension contains fewer countries (n=45)
and the indulgence versus restraint dimension does not yet have publicized national scores. 7 National indicators published by the World Bank are available at
http://data.worldbank.org/datacatalog/world-development-indicators.
References
Al Zamal, F., Liu, W., & Ruths, D. (2012).Homophily and latent attribute inference: Inferring latent attributes of Twitter users from neighbors. Paper presented at the Proceedings of the 4th International AAAI Conference on Weblogs and Social Media (ICWSM).
Ambady, N., & Weisbuch, M. (2010). Nonverbal behavior. In S. T. Fiske, D. T. Gilbert, & G. Lindzey (Eds.),Handbook of social psychology(pp. 464–497). Hoboken, NJ: Wiley. Bargh, J. A., & McKenna, K. Y. A. (2004). The Internet and social life.Annual Review of
boyd, d. m., & Ellison, N. B. (2007). Social network sites: Definition, history, and scholarship. Journal of Computer-Mediated Communication,13(1), 210–230.
doi:10.1111/j.1083-6101.2007.00393.x.
Burgoon, J. K., Floyd, K., & Guerrero, L. K. (2010). Nonverbal communication theories of interaction adaptation. In C. R. Berger, M. E. Roloff, & D. R. Roskos-Ewoldsen (Eds.),The handbook of communication science(pp. 93–108). Thousand Oaks, CA: Sage.
Cha, M., Haddadi, H., Benevenuto, F., & Gummadi, K. (2010).Measuring user influence in Twitter: The million follower fallacy.Paper presented at the Proceedings of the 4th International AAAI Conference on Weblogs and Social Media (ICWSM).
Dunlap, J. C., & Lowenthal, P. R. (2009). Tweeting the night away: Using Twitter to enhance social presence.Journal of Information Systems Education,20(2), 129–135.
Ekman, P. (1992). Facial expressions of emotion: New findings, new questions.Psychological Science,3(1), 34–38. doi:10.2307/40062750.
Fernández, I., Carrera, P., Sánchez, F., Páez, D., & Candia, L. (2000). Differences between cultures in emotional verbal and nonverbal reactions.Psicothema,12(1), 83–92. Friedl, J. (2006).Mastering regular expressions. Sebastopol, CA: O’Reilly Media. Gajadhar, J., & Green, J. (2005). The importance of nonverbal elements in online chat.
Educause Quarterly,28(4), 63–64.
Garcia-Gavilanes, R., Quercia, D., & Jaimes, A. (2013).Cultural dimensions in Twitter: Time, individualism and power.Paper presented at the Proceedings of the 7th International AAAI Conference on Weblogs and Social Media (ICWSM).
Golder, S. A., & Macy, M. W. (2011). Diurnal and seasonal mood vary with work, sleep, and daylength across diverse cultures.Science,333(6051), 1878–1881.
doi:10.1126/science.1202775.
Gudykunst, W. B. (1997). Cultural variability in communication: An introduction.Human Communication Research,24(4), 327–348. doi:10.1177/009365097024004001.
Gudykunst, W. B., & Lee, C. M. (2005). Theorizing about intercultural communication. In W. B. Gudykunst & B. Mody (Eds.),Handbook of international and intercultural
communication(Vol. 2, pp. 25–50). Thousand Oaks, CA: Sage.
Gudykunst, W. B., Matsumoto, Y., Ting-Toomey, S., Nishida, T., Kim, K., & Heyman, S. (1996). The influence of cultural individualism-collectivism, self construals, and individual values on communication styles across cultures.Human Communication Research,22(4), 510–543. doi:10.1111/j.1468-2958.1996.tb00377.x.
Hall, E. T. (1976).Beyond culture. Garden City, NY: Doubleday.
Heine, S. J. (2010). Cultural psychology. In S. T. Fiske, D. T. Gilbert, & G. Lindzey (Eds.), Handbook of social psychology(pp. 1423–1464). Hoboken, NJ: Wiley.
Hofstede, G. H., Hofstede, G. J., & Minkov, M. (2011).Cultures and organizations: Software of the mind(3rd ed.). New York, NY: McGraw-Hill.
Inglehart, R., & Welzel, C. (2005).Modernization, cultural change, and democracy: The human development sequence. New York, NY: Cambridge University Press.
Jack, R. E., Garrod, O. G. B., Yu, H., Caldara, R., & Schyns, P. G. (2012). Facial expressions of emotion are not culturally universal.Proceedings of the National Academy of Sciences of the United States of America,109(19), 7241–7244. doi:10.1073/pnas.1200155109. Kulshrestha, J., Kooti, F., Nikravesh, A., & Gummadi, P. K. (2012).Geographic dissection of the
Kwak, H., Lee, C., Park, H., & Moon, S. (2010).What is Twitter, a social network or a news media?Paper presented at the Proceedings of the 19th International Conference on World Wide Web, Raleigh, NC.
Mai, X., Ge, Y., Tao, L., Tang, H., Liu, C., & Luo, Y.-J. (2011). Eyes are windows to the Chinese soul: Evidence from the detection of real and fake smiles.PLoS ONE,6(5), 1–6.
doi:10.1371/journal.pone.
Masuda, T., Ellsworth, P. C., Mesquita, B., Leu, J., Tanida, S., & Van de Veerdonk, E. (2008). Placing the face in context: Cultural differences in the perception of facial emotion. Journal of Personality and Social Psychology,94(3), 365–381. doi:10.1037/
0022-3514.94.3.365.
Marsh, A. A., Elfenbein, H. A., & Ambady, N. (2003). Nonverbal “accents”: Cultural differences in facial expressions of emotion.Psychological Science,14(4), 373–376. Miller, G. (2011). Social scientists wade into the tweet stream.Science,333(6051),
1814–1815. doi:10.1126/science.1167742.
Nisbett, R. E., & Masuda, T. (2003). Culture and point of view.Proceedings of the National Academy of Sciences of the United States of America,100(19), 11163–11170.
doi:10.1073/pnas.1934527100.
Norris, P., & Inglehart, R. (2009).Cosmopolitan communications: Cultural diversity in a globalized world. New York, NY: Cambridge University Press.
O’Reilly Media (2012).Big data now: 2012 edition. Sebastopol, CA: O’Reilly Media. Provine, R. R., Spencer, R. J., & Mandell, D. L. (2007). Emotional expression online:
Emoticons punctuate website text messages.Journal of Language and Social Psychology, 26(3), 299–307. doi:10.1177/0261927X06303481.
Rezabek, L. L., & Cochenour, J. J. (1998). Visual cues in computer-mediated communication: Supplementing text with emoticons.Journal of Visual Literacy,18(2), 201–215.
Rosenbaum, P. R. (1995).Observational studies. New York, NY: Springer-Verlag. Schutt, R. K. (2006).Investigating the social world: The process and practice of research.
Thousand Oaks, CA: Pine Forge Press.
Shadish, W. R., Cook, T. D., & Campbell, D. T. (2002).Experimental and quasi-experimental designs for generalized causal inference. Boston, MA: Houghton Mifflin.
Sharma, N. K., Ghosh, S., Benevenuto, F., Ganguly, N., & Gummadi, K. (2012). Inferring who-is-who in the Twitter social network.ACM SIGCOMM Computer Communication Review,42(4), 533–538. doi:10.1145/2377677.2377782.
Smith, A. (2011).22% of online Americans used social networking or Twitter for politics in 2010 campaign(pp. 1–92). Washington, DC: Pew Research Center.
Thelwall, M., Buckley, K., & Paltoglou, G. (2011). Sentiment in Twitter events.Journal of the American Society for Information Science and Technology,62(2), 406–418.
doi:10.1002/asi.21462.
Voronov, M., & Singer, J. A. (2002). The myth of individualism-collectivism: A critical review. The Journal of Social Psychology,142(4), 461–480. doi:10.1080/00224540209603912. Walther, J. B., & D’Addario, K. P. (2001). The impacts of emoticons on message interpretation
in computer-mediated communication.Social Science Computer Review,19(3), 324–347. doi:10.1177/089443930101900307.