STUDY OF TRAFFIC ACCIDENT COSTS IN THAILAND
1. Rationale
Traffic accidents incur immense losses to individuals, families and the country by being the cause of so many untimely deaths, debilitating injuries, damage to properties and loss in productivity. In addition to economic losses traffic accidents have a social component in that victims and/or their families are often beset with grief, hardship and even a degraded quality of life. Although in many cases estimation of the overall cost of an accident is difficult, nonetheless it is necessary to gauge the monetary value of these losses in order to highlight the extent of damage incurred to society as a whole. Information about the cost of traffic accidents will help to evaluate the effectiveness of road safety programs as well as in the proper allocation of the country’s limited financial resources for the most effective prevention plans.
Determination of traffic accident costs for a given province, or for the whole country, helps to raise the awareness of the losses from road crashes. Classification of these losses by crash severity provides a basis for the analysis and comparison of the effectiveness of prevention measures and related investments in the campaign to reduce road accidents in Thailand.
2. Objectives and Scope of Project
Objectives
• To detail a sound and comprehensive method of calculating traffic accident costs which enables values to be regularly updated.
• To enable the application of cost benefit analyses of traffic accident reduction projects.
• To identify actual traffic accident costs and the burden placed on society for use in raising the awareness of policy makers and the public.
The scope of the study
The following activities together with detailed reports outlining the results and recommendations that result from the study are required.
Stage 1 (10 months)
• Review available data and methodologies for determining traffic accident costs both nationally and internationally.
• Recommend the most appropriate method for use in Thailand taking into consideration available data, economic realities, practicability and other local issues and constraints.
Stage 2 (14 months)
• Implement a similar study in at least 3 other Provinces to confirm applicability of method across all of Thailand.
• Produce estimates of costs for all severities of crash and injury for rural and urban crashes and other categories of crash as appropriate. Produce a gross cost estimate for the country as a whole including and allowance for under-reporting and definition issues. • Produce guidelines and simple software to enable annual adjustments and less frequent
recalculations of crash costs in the future. The guideline should include an example of the application of the costs for use in cost-benefit analysis of a road safety scheme.
• Establish a training/education regime that allows the transfer of knowledge, technologies, findings and issues related to the recommended method. It is expected that a minimum of 2 formal training seminars will be held each year.
• Examine and make recommendations on how the private sector can contribute/assist in the implementation of the method.
Consideration of the following factors shall be included in completing the above activities.
• The human capital approach shall be used. • The costs shall include at least the following.
- Property damage costs
- Emergency services costs (police, doctors) - Insurance services costs
- Judicial system costs - Vehicle repair costs - Loss of productivity - Hospital costs
• Khon Kaen Central Hospital shall be used as the pilot hospital in the first year of the project.
• Account shall be taken of the priority accident locations in evaluation of traffic safety improvement cost benefits.
Timing
The project starts on 1 September 2005 will be completed in August 2007 runs for 24 months.
3. Review of Methods for Traffic Accident Costing
Among the number of methods in use to determine traffic accident costs, there are two popular approaches hat have been adopted in several countries, namely, the Human Capital Approach and the Willingness to Pay Approach.
The human capital approach (HC) is based on the assumption that human beings are a resource for economic production; prevention of accidents will then prevent the loss in productivity due to human deaths or injuries caused by accidents.
The willingness to pay approach is preferred in developed economies such as the UK, Sweden and USA. The study team, however, opted for the human capital approach which has been employed in similar studies in many developing countries, such as Vietnam, Bangladesh, Thailand, Korea, Nepal, Tanzania, Zambia, Malawi and Egypt as well as a number of developed countries including Germany, Norway, Denmark and Australia. The main advantage of the HC approach is in its simpler calculation method than that for the WP approach. After a series of reviews on the way the HC approach is employed in several countries, the method used in Australia was selected to provide an initial framework for our study. The Australian approach covers both direct and indirect costs. There are, however, similar the methodologies employed in Europe such as in Germany and Denmark.
Characteristics of the Australian system of accident costing
The Australian system of accident costing takes into account many items of cost all of which fall into three categories: costs involving human beings or human costs; property damage costs and general costs of a crash. The cost items in each of these categories must be evaluated in monetary terms. The items are listed below.
Human Costs Category. This comprises:
• loss of productivity
• loss in terms of quality of life • medical care cost
• long-term care cost • forensic examination cost • cost of untimely burial
• judicial administration expenses • penal expenses
• loss resulting from the work interruptions and personnel replacement
Property Damage Costs Category. This category includes:
• cost of vehicle repairs • cost of towage
• cost of time lost due to unavailability of vehicle
General Costs of Crash. This category comprises:
• damage to non-vehicle properties • police administration expenses • firefighting expenses
• cost of insurance administration • cost of travel delay
Findings of the review of similar studies in Thailand.
are Prapee Komnamoon (1979), Chareonrat Promglam (1998), Rungnapa Kradang-Nga (1999), and Wanapa Sumiratana (1996). Other studies, such as Watana S. Chanchareon et. al. (1993) and Supachai Kunaratanapruek et. al. (1995), focus on medical costs of road accidents.
Most research projects on road crash costs in Thailand include only lost output due to death and injury of the victims, and do not take into account lost output due to care taking of the injured. However, there are three studies [Direk Patamasiriwat (1994), R. Tosutho (1997), and Worawate Suwanrada (2005)] which attempt to quantify the loss of income of those who carry the burden of caring for the disabled.
In estimating lost output, most researchers use the same principle by examining losses in terms of time and income which should have been earned during the remaining working life of the dead. In the case of injury, income losses are estimated during and after the hospitalization period, both for the injured and their care takers. Therefore, it is necessary to make projections of future income for those affected by accidents. The methods of income projection are elaborated clearly in Prapee Komnamoon (1979), Direk Patamasiriwat (1994), R. Tosutho (1997), Worawate Suwanrada (2005), and Angsana Boontam (2001). The methods used differ from one another. Worawate Suwanrada (2005) calculates foregone income from the “wage function” which relates wage income to age, and is estimated based on the data from a work status survey by the National Statistical Office. R. Tosutho (1997) estimates average income classified by age from the “earning function”, while Direk Patamasiriwat (1994) derives average income classified by age and gender from a set of survey data by the National Statistical Office. Nonetheless, none of the studies covers as comprehensive a range of cost items as those conducted in Australia.
4. Determination of Traffic Accident Costs for Thailand.
4.1 Component of Traffic Accident Costs
Human Capital Approach
Human Costs Category
Loss of Productivity Costs
Quality of Life Costs
Medical Costs
EMS. Costs
Long Term Care Costs
Property Damage Costs Category
Vehicle Damage Costs
Non-Vehicle Damage Costs
General Crash Costs Category
Insurance Administration
Police Administration
Judicial System Costs
ERS. Costs
Travel Delay Costs
Figure 1: Grouping of Crash Costs by Human Capital Approach
4.2 Traffic Accident Cost Model for Thailand.
With the human capital approach the model for calculating traffic accident costs uses three equations listed below.
Total accident cost = A + B+ C……….……….….(1)
The total cost of each category is defined by
• Human Costs (A) = A1 + A2 + A3 + A4 + A5 …………(2) • Property Damage Costs (B) = B1 + B2 .. ……… …………(3) • General Crash Costs (C) = C1 + C2 + C3 + C4 + C5.………...(4)
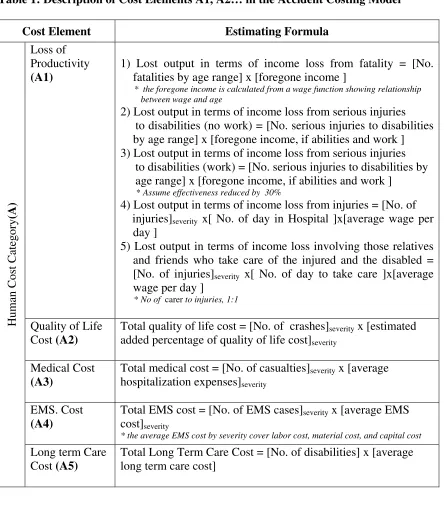
Table 1: Description of Cost Elements A1, A2… in the Accident Costing Model
Cost Element Estimating Formula
Loss of Productivity
(A1)
1) Lost output in terms of income loss from fatality = [No. fatalities by age range] x [foregone income ]
* the foregone income is calculated from a wage function showing relationship between wage and age
2) Lost output in terms of income loss from serious injuries to disabilities (no work) = [No. serious injuries to disabilities
by age range] x [foregone income, if abilities and work ] 3) Lost output in terms of income loss from serious injuries to disabilities (work) = [No. serious injuries to disabilities by age range] x [foregone income, if abilities and work ]
* Assume effectiveness reduced by 30%
4) Lost output in terms of income loss from injuries = [No. of injuries]severity x[ No. of day in Hospital ]x[average wage per
day ]
5) Lost output in terms of income loss involving those relatives and friends who take care of the injured and the disabled = [No. of injuries]severity x[ No. of day to take care ]x[average
wage per day ]
* No of carer toinjuries, 1:1
Quality of Life Cost (A2)
Total quality of life cost = [No. of crashes]severity x [estimated
added percentage of quality of life cost]severity
Medical Cost
(A3)
Total medical cost = [No. of casualties]severity x [average
hospitalization expenses]severity
EMS. Cost
(A4)
Total EMS cost = [No. of EMS cases]severity x [average EMS
cost]severity
* the average EMS cost by severity cover labor cost, material cost, and capital cost
Human Cost Category
(A
)
Long term Care Cost (A5)
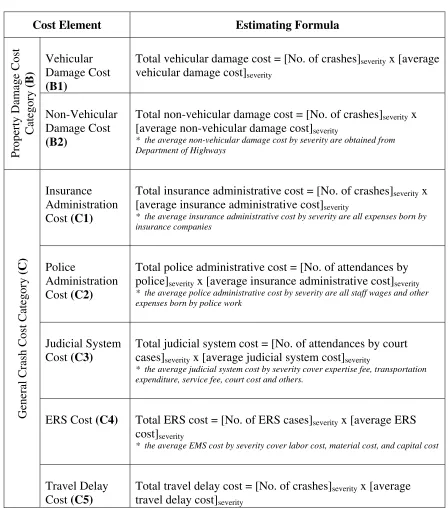
Table 1: Accident Costing Model (Continued)
Cost Element Estimating Formula
Vehicular Damage Cost
(B1)
Total vehicular damage cost = [No. of crashes]severity x [average
vehicular damage cost]severity
Total non-vehicular damage cost = [No. of crashes]severity x
[average non-vehicular damage cost]severity
* the average non-vehicular damage cost by severity are obtained from Department of Highways
Insurance Administration Cost (C1)
Total insurance administrative cost = [No. of crashes]severity x
[average insurance administrative cost]severity
* the average insurance administrative cost by severity are all expenses born by insurance companies
Police
Administration Cost (C2)
Total police administrative cost = [No. of attendances by police]severity x [average insurance administrative cost]severity
* the average police administrative cost by severity are all staff wages and other expenses born by police work
Judicial System Cost (C3)
Total judicial system cost = [No. of attendances by court cases]severity x [average judicial system cost]severity
* the average judicial system cost by severity cover expertise fee, transportation expenditure, service fee, court cost and others.
ERS Cost (C4) Total ERS cost = [No. of ERS cases]severity x [average ERS
cost]severity
* the average EMS cost by severity cover labor cost, material cost, and capital cost
General Crash Cost Category
(C)
Travel Delay Cost (C5)
Total travel delay cost = [No. of crashes]severity x [average
4.3 Determining Accident Cost Items for Model Input.
The total cost incurred in a province, region or the whole country is determined by using two key sources of data, namely (1) data on number of crash casualties and the number of crashes that have taken place; and (2) information relating to the unit cost.
(1) Data on number of crash casualties and number of crashes:
• Total number of crash casualties classified according to severity -- death, disability, seriously injured and slightly injured.
• Total number of crashes classified according to severity -- crashes resulting in death, disability, seriously injured and slightly injured and property damage only. The number of occurrences can be computed from the data of total number of accident casualties and the average number of casualties per crash.
• Number of times emergency medical service is administered • Number of accidents involving damage to vehicles.
• Number of accidents involving damage to non-vehicle properties. • Number of times insurance service is called upon
• Number of times police service is called upon. • Number of times a court case is involved.
• Number of times emergency rescue service is called upon.
(2) Data for the unit cost include the following:
Human Costs Category (average per casualty)
• Productivity cost classified by gender and age groups. • Cost of or ratio of loss in quality of life.
• Cost of medical care by level of severity.
• Cost of service provided by emergency medical team. • Cost of long-term care.
Property Damage Costs Category (average per case)
• Costs relating to the damaged vehicles.
• Costs relating to non-vehicle property damage.
General Crash Costs Category (average per case)
• Cost of provision of insurance service. • Cost of police administration.
• Cost of court proceedings • Cost of rescue team service.
Notes:
(1) The cost of productivity loss can be adjusted to match each locality in terms of wages, economic growth, interest rates, expected life of productivity and the number of work days in a month.
(2) Loss of quality of life includes losses as a result of pain and grief suffered by the accident victim, his family and friends; including the inability to lead a normal life. For this study, a survey was conducted in order to determine the cost of this loss. A number of respondents including the public in general, legal experts and accident victims themselves were asked to rate the loss as percentage of losses from the job absence of the victims/carers plus cost of medical care. Results of the survey are summarised in Table 2.
Table 2: Percentages (median and maximum) for Determining Losses in Life Quality.
Case Severity Fatality Disability Serious Injury Slight Injury
Median % 125 150 75 25
Max% 167 200 100 40
Source: Consultant’s surveys
5. Software for Calculating Thailand Traffic Accident Cost (TACOST)
Figure 2: Sample Interface of Thailand Traffic Accident Cost Program
6. Outcomes of the Traffic Accident Cost Study
In this study, traffic accident costs were determined by province. Should it be required to determine the total cost for a region, it would be necessary to take into consideration the characteristics of accidents in each region. Since the frequency of crashes, the number of people involved, severity of crashes and the wage scales in Bangkok differ by far from those characteristics of the provinces, the Consultant therefore consider the city as a separate region in itself. Therefore, the accident costs were determined for five regions namely Bangkok, Central region (excluding Bangkok), North, Northeast and South.
Traffic Accident Cost for Year 2004
Table 3 shows the cost of traffic accident for each cost category in the five study areas(based on median factor of loss in life quality). It is found that the three topmost cost items for Bangkok are travel delay (52.39%), loss in quality of life (16.40%), and damage to vehicle (16.16%), whereas the top three items for the other provinces are loss in quality of life (34.19%), damage to vehicle (25.98%), and loss in productivity (20.96%).
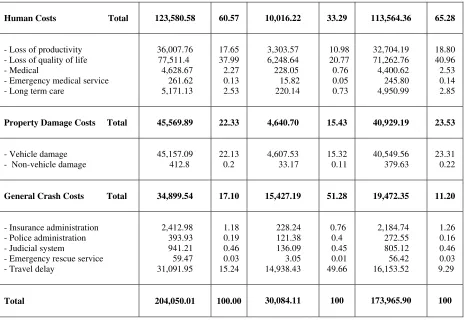
Table 3 : Breakdown of Traffic Accident Costs for Thailand for 2004 (Computed by using average QOL factor)
Thailand Bangkok Other Provinces
Cost Elements
- Loss of productivity - Loss of quality of life - Medical
- Emergency medical service - Long term care - Non-vehicle damage
45,157.09
- Emergency rescue service - Travel delay
Table 4 : Breakdown of Traffic Accident Costs for Thailand for 2004 (Computed by using maximum QOL factor)
The total cost of traffic accidents to the whole country amounted to 184,568 million baht (based on median value of loss in life quality). The 4 topmost cost items were loss in life quality (31.44%), damage to properties (24.47%) loss in productivity (19.51%) and travel delays (16.85%), as shown in Figure 3.
Figure 4 show details of breakdown of traffic accident costs for 2004, as computed by using maximum value of QOL factor.
Human Costs Total 123,580.58 60.57 10,016.22 33.29 113,564.36 65.28
- Loss of productivity - Loss of quality of life - Medical
- Emergency medical service - Long term care - Non-vehicle damage
45,157.09
- Emergency rescue service - Travel delay
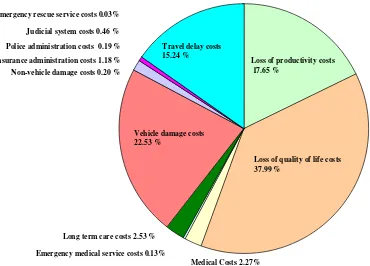
Figure 3 : Percentage of Elements of Thailand Road Crash Costs for 2004 (average case)
Figure 4 : Percentage of Elements of Thailand Road Crash Costs for 2004 (Maximum case)
Loss of productivity costs
19.51%
Loss of quality of life costs
31.44 %
Medical costs 2.51%
Emergency medical service costs 0.14%
Long term care costs 2.80 %
Vehicle damage costs
24.47 %
Non-vehicle damage costs 0.22 %
Insurance administration costs 1.31%
Police administration costs 0.21 %
Judicial system costs 0.51 %
Travel delay costs
16.85 %
Emergency rescue service costs 0.03 %
Loss of productivity costs 17.65 %
Loss of quality of life costs 37.99 %
Vehicle damage costs 22.53 %
Travel delay costs 15.24 %
Medical Costs 2.27% Long term care costs 2.53 %
Insurance administration costs 1.18 % Non-vehicle damage costs 0.20 % Police administration costs 0.19 % Judicial system costs 0.46 % Emergency rescue service costs 0.03%
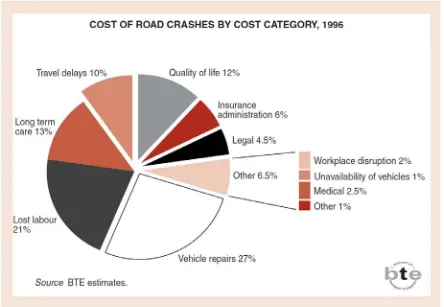
Figure 5 below show the percentages of traffic accident costs incurred in Australia. Main cost items for the Australian condition are damage to vehicle (27%), loss in productivity or Lost Labour (21%) long-term care cost (13%) loss in life quality (12%) and cost of traffic delay (10%). It can be seen that all the Australian cost items are comparatively lower than those incurred in Thailand.
Figure 5 : Percentages of Traffic Accident Costs in Australia.
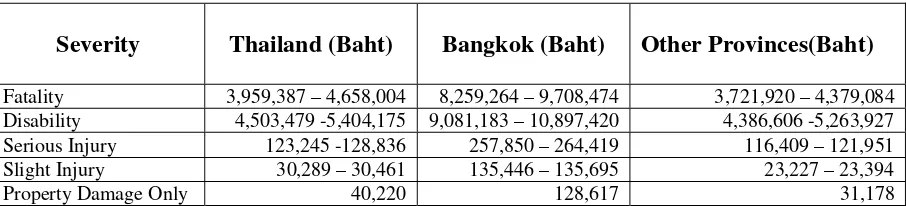
Cost of Accident for Various Degree of Crash Severity
For Bangkok, the accident cost per case was found to be between 8,259,264 – 9,708,474 baht per fatal case, 9,081,183 – 10,897,420 baht per disability case; 257,850 – 264,419 baht per severe injury case, 135,446 – 135,695 baht per slight injury case and 128,617 baht per case of damage to properties,
For the other provinces, the accident cost per case in the 4 regions studied was found to be 3,721,920 – 4,379,084 baht, 4,386,606 – 5,263,927 baht, 116,409 – 121,951 baht, 23,227 – 23,394 baht and 31,178 baht for fatal, disability, serious injury, slight injury and property damage only case respectively.
Table 5 : Average Accident Cost Sustained by Victim by Severity.
Severity Thailand (Baht) Bangkok (Baht) Other Provinces(Baht)
Fatality 3,959,387 – 4,658,004 8,259,264 – 9,708,474 3,721,920 – 4,379,084 Disability 4,503,479 -5,404,175 9,081,183 – 10,897,420 4,386,606 -5,263,927 Serious Injury 123,245 -128,836 257,850 – 264,419 116,409 – 121,951 Slight Injury 30,289 – 30,461 135,446 – 135,695 23,227 – 23,394 Property Damage Only 40,220 128,617 31,178
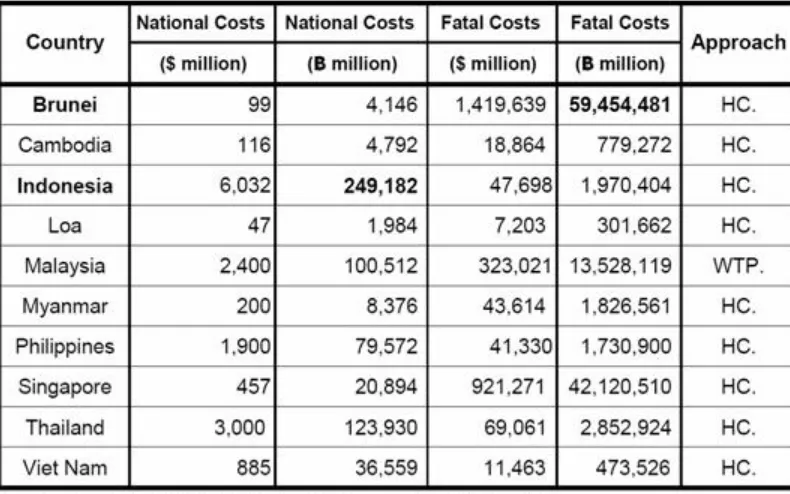
Comparison of Traffic Accident Costs of Thailand and Other Countries.
The magnitudes of accident cost established by this study are much higher than those found in most other studies conducted in Thailand. The cost of one fatality determined in this study was between 3,963,507 to 4,662,124 baht. The amount was comparable to that determined in the study by Direk Patamasiriwat (1994) which was 4.76 million baht per case. When compared with the costs determined in Europe in countries using the same human capital approach, Thailand’s costs were lower than those of the Netherlands, France, Belgium and Germany (see Table 6). Accident costs for ASEAN countries (human capital approach) are compared in Table 7. The cost of one fatality for Singapore and Brunei are much higher than that of Thailand, probably due to the much higher per capita incomes of those two countries. For the same reason, the cost of one fatality for Thailand is higher than those of Indonesia and the Philippines. In addition, due to the much more comprehensive cost items considered in this study, the traffic accident cost per fatality for Thailand (2004) therefore rose to between 3,959,387 and 4,658,004 million baht.
Table 7 : Costs of Fatal Casualty in a Road Accident in ASEAN Countries.
7. Application of Crash Cost Estimates
This section gives an example for application of crash cost estimates.
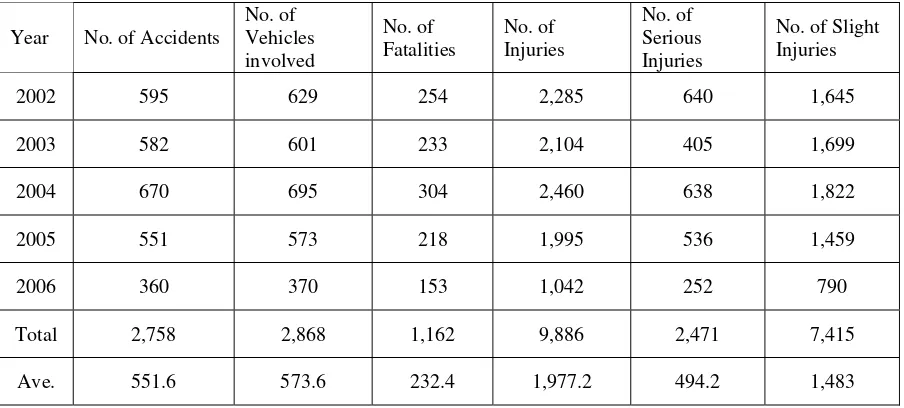
Statistics of Large-Bus Crashes -- Data from Highways Department
Table 8 : Number of Large-Bus Crashes on National Highways, with Associated Fatalities and Injuries, from 2002 to 2006 (5 years)
Year No. of Accidents
No. of Vehicles involved
No. of Fatalities
No. of Injuries
No. of Serious Injuries
No. of Slight Injuries
2002 595 629 254 2,285 640 1,645
2003 582 601 233 2,104 405 1,699
2004 670 695 304 2,460 638 1,822
2005 551 573 218 1,995 536 1,459
2006 360 370 153 1,042 252 790
Total 2,758 2,868 1,162 9,886 2,471 7,415
Ave. 551.6 573.6 232.4 1,977.2 494.2 1,483
Source: Bureau of Traffic Safety, Department of Highways, 2007
Figures in Table 8 indicate that for every crash, the number of fatalities are 0.42; disabilities 0.03 serious injuries 0.79 and slight injuries 2.76. The cost incurred in each crash is computed thus: = 0.42*4,658,004 + 0.03*5,404,175 + 0.79*128,836 + 2.76*30,461 which amounts to 2,304,340 or approximately 2.3 million baht per crash. The total cost of large-bus crashes on national highways for the 5 years period 2002-2006 is equal to 2758*2.3 or 6,343.4 million Baht.
8. Problems Encountered in Data Collection
Data were collected in Khon Kaen, Lampang, Nakhonsawan, Songkhla, and Bangkok from public and private-sector agencies involved in crash-related activity. Interviews were conducted with a number of people involved including government authorities, experts as well as the families and friends of accident victims. Losses ascribed to traffic accidents were then assessed and categorized. This results in three categories of losses; the first category is the human costs, the second, the properties damaged, and the third is general losses associated with traffic crashes.
1. Crash injury data of some of the care providers were not systematically maintained, thus could not be readily employed. The Consultant had to resort to the IS database of the Khon Kaen Central Hospital, Lampang Central Hospital, Nakhonsawanpracharak Hospital, Hatyai and records from the Report on Survey of Human Disability and Incapacity 2002 of the National Statistical Office for determining percentages in each data category such as gender, age and number of crash-induced disabilities.
2. Data of crash vehicle repair costs kept by insurance companies were largely inaccessible. Those that were available were limited to broad, overall figures; none were systematically maintained data. To remedy this lack, the Consultant obtained additional data from repair garages in order to better gauge the costs associated with crash-damaged vehicles.
3. Data relating to losses of properties other than vehicles were requested from Department of Highways and road authorities. For some agencies, such data had not been maintained properly, thereby hampering data checking. Much of these data could not be employed for this investigation.
9. Suggestion for Data Update
1. Estimation for the wage function
Because the structure of the economy dose not change every year. And we assume that the length of structural change is 5 years. Thus, in estimating the wage function, the parameters will be updated every 5 years.
2. Calculation for the value of lost output
The value of lost output per case as obtained from calculation in this study is for the year 2004 price. Based on the data obtained from the Bank of Thailand, the average inflation rate betweens 2004 – 2007 is 3.6%. We use this rate for calculating the value at current price.
For example, if the value of lost output per case is A Baht at 2004 price. The length betweens 2004 – 2007 is 3 years, the value at current price is A x (1+3.6%)3