Maureen Mellody, Rapporteur
Committee on Applied and Theoretical Statistics Board on Mathematical Sciences and Their Applications
THE NATIONAL ACADEMIES PRESS 500 Fifth Street, NW Washington, DC 20001
NOTICE: The project that is the subject of this report was approved by the Governing Board of the National Research Council, whose members are drawn from the councils of the National Academy of Sciences, the National Academy of Engineering, and the Institute of Medicine.
This study was supported by Grant DMS-1332693 between the National Academy of Sciences and the National Science Foundation. Any opinions, findings, or conclusions expressed in this publication are those of the author and do not necessarily reflect the views of the organizations or agencies that provided support for the project.
International Standard Book Number-13: 978-0-309-31437-4 International Standard Book Number-10: 0-309-31437-2
This report is available in limited quantities from:
Board on Mathematical Sciences and Their Applications 500 Fifth Street NW
Washington, DC 20001 [email protected]
http://www.nas.edu/bmsa
Additional copies of this workshop summary are available for sale from the National Academies Press, 500 Fifth Street, NW, Keck 360, Washington, DC 20001; (800) 624-6242 or (202) 334-3313; http://www.nap.edu/.
Copyright 2015 by the National Academy of Sciences. All rights reserved.
Academy of Sciences, as a parallel organization of outstanding engineers. It is autonomous in its administration and in the selection of its members, sharing with the National Academy of Sciences the responsibility for advising the federal government. The National Academy of Engineering also sponsors engineering programs aimed at meeting national needs, encourages education and research, and recognizes the superior achievements of engineers. Dr. C. D. Mote, Jr., is president of the National Academy of Engineering.
The Institute of Medicine was established in 1970 by the National Academy of Sciences to secure the services of eminent members of appropriate professions in the examination of policy matters pertaining to the health of the public. The Institute acts under the responsibility given to the National Academy of Sciences by its congressional charter to be an adviser to the federal government and, upon its own initiative, to identify issues of medical care, research, and education. Dr. Victor J. Dzau is president of the Institute of Medicine.
The National Research Council was organized by the National Academy of Sciences in 1916 to asso-ciate the broad community of science and technology with the Academy’s purposes of furthering knowledge and advising the federal government. Functioning in accordance with general policies determined by the Academy, the Council has become the principal operating agency of both the National Academy of Sciences and the National Academy of Engineering in providing services to the government, the public, and the scientific and engineering communities. The Council is administered jointly by both Academies and the Institute of Medicine. Dr. Ralph J. Cicerone and Dr. C. D. Mote, Jr., are chair and vice chair, respectively, of the National Research Council.
v
RAGHU RAMAKRISHNAN, Microsoft Corporation, Co-Chair
DEEPAK AGARWAL, LinkedIn Corporation CORINNA CORTES, Google, Inc.
JEFF DOZIER, University of California, Santa Barbara ANNA GILBERT, University of Michigan
PATRICK HANRAHAN, Stanford University RAFAEL IRIZARRI, Harvard University ROBERT KASS, Carnegie Mellon University PRABHAKAR RAGHAVAN, Google, Inc.
NATHANIEL SCHENKER, Centers for Disease Control and Prevention ION STOICA, University of California, Berkeley
Staff
vi
COMMITTEE ON APPLIED AND THEORETICAL STATISTICS
CONSTANTINE GATSONIS, Brown University, Chair
MONTSERRAT (MONTSE) FUENTES, North Carolina State University ALFRED O. HERO III, University of Michigan
DAVID M. HIGDON, Los Alamos National Laboratory IAIN JOHNSTONE, Stanford University
ROBERT KASS, Carnegie Mellon University JOHN LAFFERTY, University of Chicago XIHONG LIN, Harvard University
SHARON-LISE T. NORMAND, Harvard University GIOVANNI PARMIGIANI, Harvard University RAGHU RAMAKRISHNAN, Microsoft Corporation
ERNEST SEGLIE, Office of the Secretary of Defense (retired) LANCE WALLER, Emory University
EUGENE WONG, University of California, Berkeley
Staff
MICHELLE K. SCHWALBE, Director
vii
L. ANTHONY COX, JR., Cox Associates, Inc. CONSTANTINE GATSONIS, Brown University
MARK L. GREEN, University of California, Los Angeles DARRYLL HENDRICKS, UBS Investment Bank
BRYNA KRA, Northwestern University
ANDREW W. LO, Massachusetts Institute of Technology DAVID MAIER, Portland State University
WILLIAM A. MASSEY, Princeton University JUAN C. MESA, University of California, Merced JOHN W. MORGAN, Stony Brook University CLAUDIA NEUHAUSER, University of Minnesota FRED S. ROBERTS, Rutgers University
CARL P. SIMON, University of Michigan
KATEPALLI SREENIVASAN, New York University EVA TARDOS, Cornell University
Staff
ix
This report has been reviewed in draft form by persons chosen for their diverse perspectives and technical expertise in accordance with procedures approved by the National Research Council’s Report Review Committee. The purpose of this independent review is to provide candid and critical comments that will assist the institution in making its published report as sound as possible and to ensure that the report meets institutional standards of objectivity, evidence, and responsiveness to the study charge. The review comments and draft manuscript remain confi-dential to protect the integrity of the deliberative process. We thank the following individuals for their review of this report:
Michael Franklin, University of California, Berkeley, Johannes Gehrke, Cornell University,
Claudia Perlich, Dstillery, and
Duncan Temple Lang, University of California, Davis.
xi
1 INTRODUCTION 1
Workshop Overview, 2 National Efforts in Big Data, 4 Organization of This Report, 7
2 THE NEED FOR TRAINING: EXPERIENCES AND CASE STUDIES 8
Training Students to Do Good with Big Data, 9
The Need for Training in Big Data: Experiences and Case Studies, 10
3 PRINCIPLES FOR WORKING WITH BIG DATA 13
Teaching about MapReduce, 14
Big Data Machine Learning—Principles for Industry, 15 Principles for the Data Science Process, 16
Principles for Working with Big Data, 19
4 COURSES, CURRICULA, AND INTERDISCIPLINARY PROGRAMS 22
Computational Training and Data Literacy for Domain Scientists, 23 Data Science and Analytics Curriculum Development at Rensselaer (and the Tetherless World Constellation), 25
xii CO N T E N T S
5 SHARED RESOURCES 31
Can Knowledge Bases Help Accelerate Science?, 32 Divide and Recombine for Large, Complex Data, 33 Yahoo’s Webscope Data Sharing Program, 36 Resource Sharing, 37
6 WORKSHOP LESSONS 40
Whom to Teach: Types of Students to Target in Teaching Big Data, 40 How to Teach: The Structure of Teaching Big Data, 42
What to Teach: Content in Teaching Big Data, 42 Parallels in Other Disciplines, 44
REFERENCES 45
APPENDIXES
A Registered Workshop Participants 49
B Workshop Agenda 52
1
Introduction
Data sets—whether in science and engineering, economics, health care, pub-lic popub-licy, or business—have been growing rapidly; the recent National Research Council (NRC) report Frontiers in Massive Data Analysis documented the rise of “big data,” as systems are routinely returning terabytes, petabytes, or more of information (National Research Council, 2013). Big data has become pervasive because of the availability of high-throughput data collection technologies, such as information-sensing mobile devices, remote sensing, radiofrequency identification readers, Internet log records, and wireless sensor networks. Science, engineering, and business have rapidly transitioned from the longstanding state of striving to develop information from scant data to a situation in which the challenge is now that the amount of information exceeds a human’s ability to examine, let alone absorb, it. Web companies—such as Yahoo, Google, and Amazon—commonly work with data sets that consist of billions of items, and they are likely to increase by an order of magnitude or more as the Internet of Things1 matures. In other words,
the size and scale of data, which can be overwhelming today, are only increasing. In addition, data sets are increasingly complex, and this potentially increases the problems associated with such concerns as missing information and other quality concerns, data heterogeneity, and differing data formats.
1 The Internet of Things is the network of uniquely identifiable physical objects embedded
TR A I N I N G ST U D E N T S T O EX T R A C T VA L U E F R O M BI G DA T A 2
Advances in technology have made it easier to assemble and access large amounts of data. Now, a key challenge is to develop the experts needed to draw reliable inferences from all that information. The nation’s ability to make use of the data depends heavily on the availability of a workforce that is properly trained and ready to tackle these high-need areas. A report from McKinsey & Company (Manyika et al., 2011) has predicted shortfalls of 150,000 data analysts and 1.5 mil-lion managers who are knowledgeable about data and their relevance. It is becom-ing increasbecom-ingly important to increase the pool of qualified scientists and engineers who can extract value from big data. Training students to be capable in exploiting big data requires experience with statistical analysis, machine learning, and compu-tational infrastructure that permits the real problems associated with massive data to be revealed and, ultimately, addressed. The availability of repositories (of both data and software) and computational infrastructure will be necessary to train the next generation of data scientists. Analysis of big data requires cross-disciplinary skills, including the ability to make modeling decisions while balancing trade-offs between optimization and approximation, all while being attentive to useful met-rics and system robustness. To develop those skills in students, it is important to identify whom to teach, that is, the educational background, experience, and char-acteristics of a prospective data science student; what to teach, that is, the technical and practical content that should be taught to the student; and how to teach, that is, the structure and organization of a data science program.
The topic of training students in big data is timely, as universities are already experimenting with courses and programs tailored to the needs of students who will work with big data. Eight university programs have been or will be launched in 2014 alone.2 The workshop that is the subject of this report was designed to
enable participants to learn and benefit from emerging insights while innovation in education is still ongoing.
WORKSHOP OVERVIEW
On April 11-12, 2014, the standing Committee on Applied and Theoretical Statistics (CATS) convened a workshop to discuss how best to train students to use big data. CATS is organized under the auspices of the NRC Board on Mathematical Sciences and Their Applications.
To conduct the workshop, a planning committee was first established to refine the topics, identify speakers, and plan the agenda. The workshop was held at the Keck Center of the National Academies in Washington, D.C., and was sponsored by the National Science Foundation (NSF). About 70 persons—including speakers,
2 See the Master’s in Data Science website at http://www.mastersindatascience.org/ for more
members of the parent committee and board, invited guests, and members of the public—participated in the 2-day workshop. The workshop was also webcast live, and at least 175 persons participated remotely.
A complete statement of task is shown in Box 1.1. The workshop explored the following topics:
• The need for training in big data.
• Curricula and coursework, including suggestions at different instructional levels and suggestions for a core curriculum.
• Examples of successful courses and curricula.
• Identification of the principles that should be delivered, including sharing of resources.
Although the title of the workshop was “Training Students to Extract Value from Big Data,” the term big data is not precisely defined. CATS, which initiated the workshop, has tended to use the term massive data in the past, which implies data on a scale for which standard tools are not adequate. The terms data analytics and
data science are also becoming common. They seem to be broader, with a focus on using data—maybe of unprecedented scale, but maybe not—in new ways to inform decision making. This workshop was not developed to explore any particular one of these definitions or to develop definitions. But one impetus for the workshop
BOX 1.1 Statement of Task
An ad hoc committee will plan and conduct a public workshop on the subject of train-ing undergraduate and graduate students to extract value from big data. The committee will develop the agenda, select and invite speakers and discussants, and moderate the discussions. The presentations and discussions at the workshop will be designed to enable participants to share experience and perspectives on the following topics:
• What current knowledge and skills are needed by big data users in industry, govern-ment, and academia?
• What will students need to know to be successful using big data in the future (5-10 years out)?
• How could curriculum and training evolve to better prepare students for big data at the undergraduate and graduate levels?
• What options exist for providing the necessary interdisciplinary training within typical academic structures?
TR A I N I N G ST U D E N T S T O EX T R A C T VA L U E F R O M BI G DA T A 4
was the current fragmented view of what is meant by analysis of big data, data ana-lytics, or data science. New graduate programs are introduced regularly, and they have their own notions of what is meant by those terms and, most important, of what students need to know to be proficient in data-intensive work. What are the core subjects in data science? By illustration, this workshop began to answer that question. It is clear that training in big data, data science, or data analytics requires a multidisciplinary foundation that includes at least computer science, machine learning, statistics, and mathematics, and that curricula should be developed with the active participation of at least these disciplines. The chapters of this summary provide a variety of perspectives about those elements and about their integration into courses and curricula.
Although the workshop summarized in this report aimed to span the major topics that students need to learn if they are to work successfully with big data, not everything could be covered. For example, tools that might supplant MapReduce, such as Spark, are likely to be important, as are advances in Deep Learning. Means by which humans can interact with and absorb huge amounts of information— such as visualization tools, iterative analysis, and human-in-the-loop systems—are critical. And such basic skills as data wrangling, cleaning, and integration will con-tinue to be necessary for anyone working in data science. Educators who design courses and curricula must consider a wide array of skill requirements.
The present report has been prepared by the workshop rapporteur as a factual summary of what occurred at the workshop. The planning committee’s role was limited to planning and convening the workshop. The views contained in the report are those of individual workshop participants and do not necessarily represent the views of all workshop participants, the planning committee, or the NRC.
NATIONAL EFFORTS IN BIG DATA
Suzanne Iacono, National Science Foundation
Suzanne Iacono, of NSF, set the stage for the workshop by speaking about national efforts in big data, current challenges, and NSF’s motivations for spon-soring the workshop. She explained that the workshop was an outgrowth of the national big data research and development (R&D) initiative. The federal govern-ment is interested in big data for three reasons:
• To stimulate commerce and the economy.
• To accelerate the pace of discovery and enable new activities.
Big data is of interest to the government now because of the confluence of technical, economic, and policy interests, according to Iacono. Advances in technol-ogy have led to a reduction in storage costs, so it is easier to retain data today. On the policy side, data are now considered to be assets, and government is pushing agencies to open data sets to the public. In other words, there has been a democ-ratization of data use and tools.
Iacono described a recent book (Mayer-Schönberger and Cukier, 2012) that outlined three basic shifts in today’s data:
• There are more data than ever before.
• Data are messy, and there must be an increased acceptance of imperfection. • Correlations can help in making decisions.
She then described the national Big Data Research and Development Initiative in more detail. A 2010 report from the President’s Council of Advisors on Science and Technology argued that the federal government was not investing sufficiently in big data research and development and that investment in this field would pro-duce large returns. A working group in big data, under the interagency Networking and Information Technology Research and Development (NITRD) program and managed by the Office of Science and Technology Policy, was charged with estab-lishing a framework for agency activity. The result was that in 2012, $200 million was allocated for big data R&D throughout the NITRD agencies, including the Defense Advanced Research Projects Agency (DARPA), the Department of Energy (DOE) Office of Science, the National Institutes of Health (NIH), and NSF. Iacono showed the framework for moving forward with big data R&D, which included the following elements:
• Foundational research. Iacono stressed that this research is critical because data are increasing and becoming more heterogeneous.
• Cyberinfrastructure. New and adequate infrastructure is needed to manage and curate data and serve them to the larger research community. • New approaches to workforce and education.
• New collaborations and outreach.
Iacono noted that policy envelops all four elements of the framework.
TR A I N I N G ST U D E N T S T O EX T R A C T VA L U E F R O M BI G DA T A 6
out that NIH’s PubMed3 program may be a useful model in that it shares research
papers. However, she noted that access to data will be much more difficult than access to publications because each discipline and community will have its own implementation plan and will treat data privacy, storage duration, and access differently.
Iacono described foundational R&D in more detail. She explained that NSF and NIH awarded 45 projects in big data in 2012 and 2013. About half were related to data collection and management and one-fourth to health and bioinformatics. The remaining awards were spread among social networks, physical sciences and engineering, algorithms, and cyberinfrastructure. Seventeen agencies are involved in the Big Data Senior Steering Group, and each is implementing programs of its own related to big data. For example, DARPA has implemented three new programs—Big Mechanism, Memex, and Big Data Capstone; the National Insti-tute of Standards and Technology maintains a Big Data Working Group; DOE has an Extreme Scale Science initiative; and NSF and NIH each has a broad portfolio related to big data. Iacono stressed that big data is a national issue and that there is substantial interest now in industry and academe, so she believes that government should consider multistakeholder partnerships.
Iacono discussed three challenges related to big data:
• Technology. She emphasized that technology alone cannot solve big data problems, and she cited several recent popular books that discuss the folly of technological solutionism (Mayer-Schönberger and Cukier, 2012; Mele, 2013; Reese, 2013; Schmidt and Cohen, 2013; Surdak, 2014; Webb, 2013). • Privacy. Iacono pointed out that many of our behaviors—including shop-ping, searching, and social interactions—are now tracked, and she noted that a White House 90-day review to examine the privacy implications of big data was under way.4 In general, Iacono noted the importance of
regulating data use, as opposed to data collection; balancing interests; and promoting data sharing.
• Education and workforce. As noted above, the 2011 report from the McKinsey & Company predicted large shortfalls of big data experts. Iacono noted that the Harvard Business Review labeled data science as “the sexiest job of the 21st century” (Davenport and Patil, 2012). The New York Times
has recently hired a chief data scientist. The bottom line, Iacono explained,
3 See the National Center for Biotechnology Information’s PubMed database at http://www.ncbi.
nlm.nih.gov/pubmed (accessed May 25, 2014) for more information.
4 That study has since been completed and can be found at Executive Office of the President, Big
is that the talent pool in data science must be expanded to meet current and future needs.
Iacono pointed out that there are traditional ways to educate students through school curricula but that there are also other ways to learn. Such companies as DataKind and Pivotal are matching data scientists with data problems in the non-profit community. Universities, such as the University of Chicago, as discussed by Rayid Ghani (see Chapter 2), are also working to connect data scientists to prob-lems of social good. Iacono concluded by stressing the many opportunities and challenges in big data that lie ahead.
ORGANIZATION OF THIS REPORT
8
2
The Need for Training:
Experiences and Case Studies
Important Points Made by Individual Speakers
• Students often do not recognize that big data techniques can be used to solve problems that address societal good, such as those in edu-cation, health, and public policy; educational programs that foster relationships between data science and social problems have the potential to increase the number and types of students interested in data science. (Rayid Ghani)
• There may be a mismatch between some industry needs and related academic pursuits: current studies of recommendation systems, such as off-line score prediction, do not always correlate well with important industry metrics, such as sales and user engagement. (Guy Lebanon) • Academia does not have sufficient access to practical data scenarios
in industry. (Guy Lebanon)
TRAINING STUDENTS TO DO GOOD WITH BIG DATA
Rayid Ghani, University of Chicago
Rayid Ghani explained that he has founded a summer program at the Univer-sity of Chicago, known as the Data Science for Social Good Fellowship, to show students that they can apply their talents in data science to societal problems and in so doing affect many lives. He expressed his growing concern that the top technical students are disproportionately attracted to for-profit companies, such as Yahoo and Google, and posited that these students do not recognize that solutions to problems in education, health, and public policy also need data.
Ghani showed a promotional video for the University of Chicago summer program and described its applicant pool. Typically, half the applicants are com-puter science or machine learning students; one-fourth are students in social sci-ence, public policy, or economics; and one-fourth are students in statistics. Some 35 percent of the enrolled students are female (as Ghani pointed out, this is a larger proportion than is typical of a computer science graduate program). Many of the applicants are graduate students, and about 25 percent are undergraduate seniors. The program is competitive: in 2013, there were 550 applicants for 36 spots. Ghani hypothesized that the program would be appropriate for someone who had an affinity for mathematics and science but a core interest in helping others. Once in the program, students are matched with mentors, most of whom are computer scientists or economists with a strong background in industry.
He explained that the program is project-based, using real-world problems from government and nonprofit organizations. Each project includes an initial mapping of a societal problem to a technical problem and communication back to the agency or organization about what was learned. Ghani stressed that stu-dents need to have skills in communication and common sense in addition to technical expertise. The curriculum at the University of Chicago is built around tools, methods, and problem-solving skills. The program now consistently uses the Python language, and it also teaches database methods. Ghani emphasized the need to help students to learn new tools and techniques. He noted, for instance, that some of the students knew of regression only as a means of evaluating data whereas other tools may be more suitable for massive data.
TR A I N I N G ST U D E N T S T O EX T R A C T VA L U E F R O M BI G DA T A 10
and who was not likely to apply. In response to the data analysis, the school district has begun a targeted career-counseling program to begin intervention.
THE NEED FOR TRAINING IN BIG DATA: EXPERIENCES AND CASE STUDIES
Guy Lebanon, Amazon Corporation
Guy Lebanon began by stating that extracting meaning from big data requires skills of three kinds: computing and software engineering; machine learning, statis-tics, and optimization; and product sense and careful experimentation. He stressed that it is difficult to find people who have expertise and skills in all three and that competition for such people is fierce.
Lebanon then provided a case study in recommendation systems. He pointed out that recommendation systems (recommending movies, products, music, advertise ments, and friends) are important for industry. He described a well-known method of making recommendations well-known as matrix completion. In this method, an incomplete user rating matrix is completed to make predictions. The matrix completion method favors low-rank (simple) completions. The best model is found by using a nonlinear optimization procedure in a high-dimensional space. The concept is not complex, but Lebanon indicated that its implementation can be difficult. Implementation requires knowledge of the three kinds referred to earlier. Specifically, Lebanon noted the following challenges:
• Computing and software engineering: language skills (usually C++ or Java), data acquisition, data processing (including parallel and distributed com-puting), knowledge of software engineering practices (such as version control, code documentation, building tools, unit tests, and integration tests), efficiency, and communication among software services.
• Machine learning: nonlinear optimization and implementation (such as stochastic gradient descent), practical methods (such as momentum and step selection size), and common machine learning issues (such as overfitting).
• Product sense: an online evaluation process to measure business goals; model training; and decisions regarding history usage, product modifica-tion, and product omissions.
important industry metrics, such as sales and increased user engagement. Second, academe does not have sufficient access to practical data scenarios from indus-try. Lebanon posited that academe cannot drive innovation in recommendation systems; research in recommendation systems does not always translate well to the real world, and prediction accuracy is incorrectly assumed to be equivalent to business goals.
He then described a challenge run by Netflix. In the early 2000s, Netflix held a competition to develop an improved recommendation system. It provided a data set of ratings that had been anonymized and offered a $1 million prize to the top team. The competition created a boost in research, which saw a corresponding increase in research papers and overall interest. However, a group of researchers at the University of Texas, Austin, successfully deanonymized the Netflix data by joining them with other data. Netflix later withdrew the data set and is now facing a lawsuit. As a result of that experience, industry is increasingly wary about releas-ing any data for fear of inadvertently exposreleas-ing private or proprietary data, but this makes it difficult for academe to conduct relevant and timely research.
Lebanon pointed out that the important result in a recommendation system is prediction of a user’s reaction to a specific recommendation. For it to be successful, one needs to know the context in which the user acts—for instance, time and loca-tion informaloca-tion—but that context is not conveyed in an anonymized data set. In addition, methods that perform well on training and test data sets do not perform well in real environments when a user makes a single A/B comparison.1 Lebanon
proposed several new ideas to address those characteristics:
• Study the correlations between existing evaluation methods and increased user engagement in an A/B test.
• Develop new off-line evaluations to account for user context better. • Develop efficient searches among the possibilities to maximize A/B test
performance.
Few data sets are publicly available, according to Lebanon. Working with limited data, the research community may focus on minor improvements in incremental steps, not substantial improvements that are related to the additional contextual information that is available to the owners of the data, the companies. He pointed out that real-world information and context, such as user addresses and other profile information, could potentially be incorporated into a traditional recommendation system.
1 In A/B testing, more formally known as two-sample hypothesis testing, two variants are
TR A I N I N G ST U D E N T S T O EX T R A C T VA L U E F R O M BI G DA T A 12
13
Principles for Working
with Big Data
Important Points Made by Individual Speakers
• MapReduce is an important programming method designed for easy parallel programming on commodity hardware. (Jeffrey Ullman) • There is an expertise gap between domain scientists and data
scien-tists: domain scientists do not know what is possible technically, and data scientists do not understand the domain. (Juliana Freire)
• A data scientist should have expertise in databases, machine learn-ing and statistics, and visualization; it is challenglearn-ing, and perhaps un realistic, to find people who have expertise in all three. (Juliana Freire and other discussion participants)
• Data preparation is an important, time-consuming, and often over-looked step in data analysis, and too few people are trained in it. (Juliana Freire)
TR A I N I N G ST U D E N T S T O EX T R A C T VA L U E F R O M BI G DA T A 14
TEACHING ABOUT MAPREDUCE
Jeffrey Ullman, Stanford University
MapReduce (Dean and Ghemawat, 2004), explained Jeffrey Ullman, is a pro-gramming method designed for easy parallel propro-gramming on commodity hard-ware, and it eliminates the need for the user to implement the parallelism and to address recovery from failures. MapReduce uses a distributed file system that replicates chunks to protect against data loss, and it is architected so that hardware failures do not require that the job be restarted. Hadoop1 is an open-source
imple-mentation of MapReduce, which is proprietary to Google.
MapReduce, Ullman said, consists of a map function and a reduce function. The map function converts a single element (such as a document, integer, or infor-mation record) into key-value pairs. The map tasks are executed in parallel; the code is sent to the data, and the task executes wherever chunks of input are. After the map function has been applied to all inputs, the key-value pairs are sorted by key. The reduce function takes a single key with its list of associated values and provides an output. Reduce tasks are also executed in parallel, and each key with its list of inputs is handled independently.
Ullman then described a data mining course being taught at Stanford Uni-versity in which students are given access to Amazon Web Services, and many do choose to implement their algorithms by using Hadoop. The course uses real-world data from a variety of sources, including Twitter, Wikipedia, and other companies. Teams of three students propose projects, including the data set to use, the expected results, and how to evaluate their results. About a dozen teams are selected to par-ticipate in the course.
Ullman described a 2012 team project on drug interactions. The team used data from Stanford’s medical school from which it extracted records for 3,000 drugs. It sought to identify drug interactions and examine each pair of drugs with a chi-squared test, a statistical test to evaluate the likelihood that differences in data arise by chance. The team was able to identify 40 of the 80 known drug combinations that lead to an increased risk of heart attack. More important, it identified two previously unknown pairs on which there was very strong evidence of interaction. Ullman ex-plained that the team recognized that to make the problem more tractable, it needed to address it with fewer keys and longer lists of values, and it combined the drugs into groups, thereby reducing the number of comparisons and correspondingly reducing the amount of network-use time needed. Ullman stated that this example illustrated how communication time can often be the bottleneck in MapReduce algorithms.
1 See Apache Software Foundation, “Apache Hadoop,” http://hadoop.apache.org/ (accessed May 14,
Ullman then spoke more broadly about the theory of MapReduce models. Such models require three elements:
• Reducer2 size: the maximum number of inputs that a given reducer can have, which leads to an upper bound on the length of the value list. • Replication rate: the average number of key-value pairs generated by a
mapper on one input. This measures communication cost per input; it is common for the replication rate to measure the length of time needed to run the algorithm.
• Mapping schema: a description of how outputs for a problem are related to inputs or an assignment of inputs to sets of reducers. No reducer is assigned more inputs than the reducer size; and for every output, there is some reducer that receives all the inputs associated with it.
Ullman showed that replication rate is inversely proportional to reducer size; this forces a trade-off between the two variables and provides a bound on replica-tion rate as a funcreplica-tion of reducer size. Ullman pointed out that the inverse relareplica-tion- relation-ship makes sense: when more work is done by a single reducer, less parallelism is needed, and the communication cost becomes smaller.
BIG DATA MACHINE LEARNING—PRINCIPLES FOR INDUSTRY
Alexander Gray, Skytree Corporation
Alexander Gray began by briefly describing the first three phases of machine learning: artificial intelligence and pattern recognition (1950s-1970s), neural net-works and data mining (1980s and 1990), and convergence of machine learning with statistics (middle 1990s to today). Gray considers that we are now seeing the beginning of a fourth phase, defined by big data with new scalable systems needed to support it.
Gray explained that almost every industry has big data and would be better served by understanding it. He noted a variety of situations in which machine learning is “mission-critical”; in general, this occurs when some extreme is needed, such as high volume, high speed, or extreme accuracy. Gray described a number of kinds of applications of big data, including science (the Search for Extra-Terrestrial Intelligence, the Sloan Digital Sky Survey, and the Large Hadron Collider), medi-cine (health-care cost reduction, predictive health,3 and early detection), finance
2 A reducer is a function that typically maps a larger set of values to a smaller set of values.
3 The goal of “predictive health” is to predict the probability of future diseases to identify useful
TR A I N I N G ST U D E N T S T O EX T R A C T VA L U E F R O M BI G DA T A 16
(improving derivative pricing, risk analysis, portfolio optimization, and algorith-mic trading), and security (cybersecurity, crime prevention, and antiterrorism). In addition, Gray noted kinds of applications that he described as having lower stakes: recommendations, face tagging, dating matches, and online advertising. He posited that many companies would benefit from machine learning to compete and ultimately to survive.
Gray then asked how to maximize predictive accuracy and explained that overall prediction error decomposes into errors that result from the use of finite samples, the choice of model parameters (i.e., algorithmic accuracy), and the choice of models. He noted that one can increase computational speed by orders of mag-nitude by using smarter algorithms. In addition, speed is connected to accuracy in that speed allows the analyst more time to explore the parameter space. Gray then described weak and strong scaling, a high-performance computing concept that manages data either by using more machines (strong scaling) or by taking more time (weak scaling). With data sets that contain millions of items, parallelism can provide good scaling—for example, changing from one computer to five com puters might lead to a 5-fold speed increase in calculation. Gray indicated that data sets that contain billions of items are not uncommon and said that his firm has worked with one client that had data sets that contained trillions of items. Gray noted that strong and weak scaling result in different errors.
In addressing algorithmic accuracy, Gray pointed out that stochastic methods are optimal but generally do not reach optimal results in a single iteration. That type of computation is useful for “quick and dirty” applications. In addressing model error, Gray emphasized the importance of understanding and using a variety of models, as the best model changes on the basis of the data set. He also indicated that the treatment of outliers can change the outcome of an analysis. And he pointed out the utility of visualizing data in a data-specific and domain-specific approach and indicated a need for improved exploratory data analysis and visualization tools. A workshop participant supported the use of visualiza-tion and emphasized the need to include the human in the loop; the user should be responsible for and involved in the visualization, not passive, and the visualization should enhance understanding of the data.
PRINCIPLES FOR THE DATA SCIENCE PROCESS
Duncan Temple Lang, University of California, Davis
importance of interpretation and reasoning—not only methods—in address-ing data. Students who work in data science will have to have a broad set of skills—including knowledge of randomness and uncertainty, statistical methods, programming, and technology—and practical experience in them. Students tend to have had few computing and statistics classes on entering graduate school in a domain science.
Temple Lang then described the data analysis pipeline, outlining the steps in one example of a data analysis and exploration process:
1. Ask a general question.
2. Refine the question, identify data, and understand data and metadata. Temple Lang noted that the data used are usually not collected for the specific question at hand, so the original experiment and data set should be understood.
3. Access data. This is unrelated to the science but does require computational skill.
4. Transform to data structures.
5. Perform exploratory data analyses to understand the data and determine whether the results will scale. This is a critical step; Temple Lang noted that 80 percent of a data scientist’s time can be spent in cleaning and preparing the data.
6. Perform dimension reduction. Temple Lang stressed that it can be difficult or impossible to automate this step.
7. Perform modeling and estimation. Temple Lang noted that computer and machine learning scientists tend to focus more on predictive models than on modeling of physical behavior or characteristics.
8. Perform diagnostics. This helps to understand how well the model fits the data and identifies anomalies and aspects for further study. This step has similarities to exploratory data analysis.
9. Quantify uncertainty. Temple Lang indicated that quantifying uncertainty with statistical techniques is important for understanding and interpreting models and results.
10. Convey results.
understand-TR A I N I N G ST U D E N T S T O EX T R A C T VA L U E F R O M BI G DA T A 18
ing, and Temple Lang described the statistical concepts that should be taught to a student:
• Mapping the general question to a statistical framework.
• Understanding the scope of inference, sampling, biases, and limitations. • Exploratory data analyses, including missing values, data quality, cleaning,
matching, and fusing.
• Understanding randomness, variability, and uncertainty. Temple Lang noted that many students do not understand sampling variability.
• Conditional dependence and heterogeneity.
• Dimension reduction, variable selection, and sparsity. • Spurious relationships and multiple testing.
• Parameter estimation versus “black box” prediction and classification. • Diagnostics—residuals and comparing models.
• Quantifying the uncertainty of a model.
• Sampling structure and dependence for data reduction. Temple Lang noted that modeling of data becomes complicated when variables are not inde-pendent, identically distributed.
• Statistical accuracy versus computational complexity and efficiency.
Temple Lang then briefly discussed some of the practical aspects of computing, including the following:
• Accessing data.
• Manipulating raw data.
• Data structures and storage, including correlated data.
• Visualization at all stages (particularly in exploratory data analyses and conveying the results).
• Parallel computing, which can be challenging for a new student. • Translating high-level descriptions to optimal programs.
During the discussion, Temple Lang proposed computing statistics on visual-izations to examine data rigorously in a statistical and automated way. He explained that “scagnostics” (from scatter plot diagnostics) is a data analysis technique for graphically exploring the relationships among variables. A small set of statistical measures can characterize scatter plots, and exploratory data analysis can be con-ducted on the residuals.4
A workshop participant noted the difference between a data error and a data blunder. A blunder is a large, easily noticeable mistake. The participant gave the
example of shipboard observations of cloud cover; blunders, in that case, occur when the location of the ship observation is given to be on land rather than at sea. Another blunder would be a case of a ship’s changing location too quickly. The participant speculated that such blunders could be generalized to detect problem-atic observations, although the tools would need to be scalable to be applied to large data sets.
PRINCIPLES FOR WORKING WITH BIG DATA
Juliana Freire, New York University
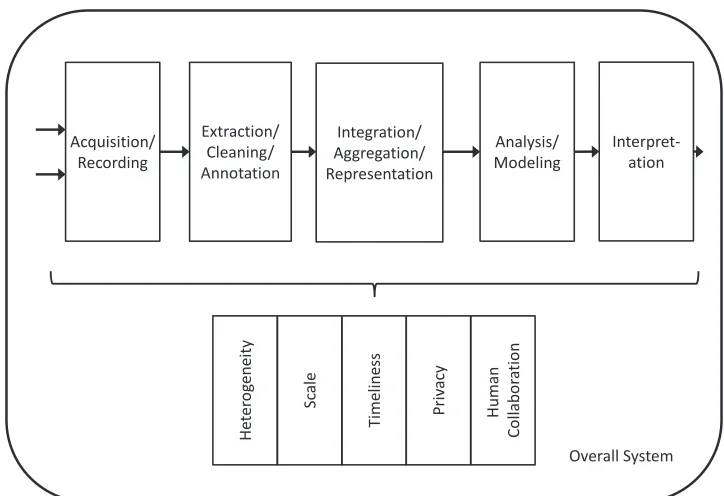
Juliana Freire began her presentation by discussing the tasks involved in addressing big data. She referred to a Computing Research Association (CRA) report5 on the challenges posed by big data. CRA also documented the data
analy-sis pipeline, which includes acquisition and recording; extraction, cleaning, and annotation; analysis and modeling; and interpretation. A simplified schematic of the pipeline is shown in Figure 3.1.
Freire posited that scaling for batch computation is not difficult—people have been working on this problem for several decades, and there is an infrastructure to support it. However, the human scalability is difficult; as the data size increases, it becomes more difficult for an analyst to explore the data space. The path from data to knowledge, she noted, is human-based and has many complicated elements. Freire explained that the CRA data analysis pipeline tasks can be classified into two categories: data preparation (which includes acquisition and recording; extraction, cleaning, and annotation; and integration, aggregation, and representa-tion) and data analysis (which includes modeling and interpretarepresenta-tion). Data science includes statistics, machine learning, data mining, and visualization, but Freire noted that in many institutions it is synonymous with machine learning, and less emphasis is placed on the other elements. She pointed out that data visualization has been growing in importance and that there is a corresponding need for addi-tional training in it. Freire emphasized that the data pipeline is complex and that what is shown in Figure 3.1 is an oversimplification; for instance, the pipeline is not linear. She also stressed the importance of research provenance: provenance of the exploration process should be captured for transparency, reproducibility, and knowledge reuse. She noted that provenance management is not often taught. Freire acknowledged that people underestimate the effort required in preparing data. Few people have the expertise to prepare data, but there is a high demand for
5 “Challenges and Opportunities with Big Data—A Community White Paper Developed by
TR A I N I N G ST U D E N T S T O EX T R A C T VA L U E F R O M BI G DA T A 20
data preparation. In contrast, there are many experts to conduct the analysis, but relatively little time is needed for this step. She stated that data preparation takes a long time, is idiosyncratic, and can limit analyses. She also noted that new data sets continually provide new challenges in big data, and many needs are not met by existing infrastructure.
Freire then provided an example of recent work in applying data science principles to New York City taxis. The raw data set consisted of 500,000 trips per day taken for more than 3 years, which yielded 150 GB of data. The data were not enormous, but they were complex and had spatial and temporal attributes. The data show an unusual degree of regularity; one can easily see temporal changes related to weekends and holidays. The goal was to allow city officials to explore the data visually. The work involved developing a spatiotemporal index that was based on an out-of-core k-dimensional tree (Ferreira et al., 2013) and a new interactive map view.
Freire stated that domain scientists do not know what is possible to do with
Acquisition/
their data, and technologists do not know the domain, so there is an expertise gap. Freire quoted Alex Szalay (Faris et al., 2011), who described the ideal scientist as “π-shaped,” with deep knowledge in two fields and connections between them. Freire argued that although the data scientist is supposed to fill the expertise gap, in reality three people make up a “data scientist”: a database expert, a machine learning and statistics expert, and a visualization expert. She said that computer science and data management research have partly failed in that it has not been able to create usable tools for end users. Freire stated that the complexity of data science problems is often underestimated.
Freire was asked by a workshop participant how to prepare students in software while teaching them their domain science. She suggested adding a new course for students who do not have a computer science background. She noted that there were several boot-camp-style programs for Ph.D. science students but that their overall effectiveness is not known.
Participants also discussed the requirements for a data analyst, a topic discussed by Temple Lang during his presentation. One person posited that the single expert in databases, machine learning and statistics, and visualization that Freire described should also be knowledgeable in systems and tools. The database expertise should include computational environments, not just databases. Another participant described the data analyst as a “jazz player” rather than a “symphony player”—in other words, a data analyst should improvise and make decisions rapidly, which cannot be done if the analyst does not know the subject matter well.
Some participants discussed tools. One person noted that commercial tools (such as Spotfire6 and Tableau7) exist in a polished form and work in a variety of
applications. Others responded, however, that students need training on these tools, and that a single tool does not usually solve complex data problems. A participant noted that students cannot afford a subscription to Tableau and argued that the existing tools should be open-source; however, open-source tools may not always be well curated.
6 See TIBCO Software, Inc., “Spotfire,” http://spotfire.tibco.com/, accessed June 9, 2014, for more
information.
7 See the Tableau Software website at http://www.tableausoftware.com/ (accessed June 9, 2014)
22
4
Courses, Curricula, and
Interdisciplinary Programs
Important Points Made by Individual Speakers
• A residual effect of training students to work with data is that the train-ing will empower them with a toolkit that they can use in multiple domains. (Joshua Bloom)
• Boot camps and other short courses appear to be successful in teach-ing data computteach-ing techniques to domain scientists and in addressteach-ing a need in the science community; however, outstanding questions remain about how to integrate these types of classes into a traditional educational curriculum. (Joshua Bloom)
• Educators should be careful to teach data science methods and prin-ciples and avoid teaching specific technologies without teaching the underlying concepts and theories. (Peter Fox)
• Massive online open courses (MOOCs) are one avenue for teaching data science techniques to a large population; thus far, data science MOOC participants tend to be computer science professionals, not students. (William Howe)
By the end of 2014, more than 30 major universities will have programs in data science.1 Existing and emerging programs offer many opportunities for lessons
1 See the Master’s in Data Science website at http://www.mastersindatascience.org/ (accessed
learned and potential course and content models for universities to follow. The fourth workshop session focused on specific coursework, curricula, and interdisci-plinary programs for teaching big data concepts. The session was chaired by James Frew (University of California, Santa Barbara). Presentations were made in this session by Joshua Bloom (University of California, Berkeley), Peter Fox (Rensselaer Polytechnic Institute), and William Howe (University of Washington).
COMPUTATIONAL TRAINING AND DATA LITERACY FOR DOMAIN SCIENTISTS
Joshua Bloom, University of California, Berkeley
Joshua Bloom noted that the purpose of graduate school is to prepare students for a career in the forefront of science. A residual effect of training students to work with data is that the training will empower the students with a toolkit that they can use even if they leave a particular domain. He pointed out that the modern data-driven science toolkit is vast and that students are being asked to develop skills in both the domain science and the toolkit.
Bloom then described upcoming data challenges in his own domain of astron-omy. The Large Synoptic Survey Telescope is expected to begin operations in 2020, and it will observe 800 million astronomical sources every 3 days. A large compu-tational framework is needed to support that amount of data, probably 20 TB per night. Other projects in radio astronomy have similar large-scale data production.
A goal in data science for time-domain astronomy in the presence of increas-ing data rates is to remove the human from the real-time data loop, explained Bloom—in other words, to develop a fully automated, state-of-the-art scientific stack to observe transient events. Often, the largest bottleneck is in dealing with raw data, but there are large-scale inference challenges further downstream.
TR A I N I N G ST U D E N T S T O EX T R A C T VA L U E F R O M BI G DA T A 24
used his materials to hold its own boot camp. Bloom noted, in response to a ques-tion, that instructors in his course walk around the room to assist students while they work. He posited that 90 percent of that interaction could be replaced with a well-organized chat among instructors and students; the course would probably take longer, and students would have to be self-directed.
Bloom explained that the boot camp is a prerequisite to Berkeley’s graduate-level follow-on seminar course in Python computing for science. The graduate seminar was the largest graduate course ever taught in Berkeley’s astronomy department; this indicated an unmet need for such a course at the graduate science level. Bloom said that the boot camps and seminars give rise to a set of education questions: Where do boot camps and seminars fit into a traditional domain-science curriculum? Are they too vocational or practical to be part of higher-education coursework? Who should teach them, and how should the instructors be credited? How can students become more (broadly) data literate before we teach them big data techniques? He emphasized that at the undergraduate level the community should be teaching “data literacy” before it teaches data proficiency. Some basic data-literacy ideas include the following:
• Statistical inference. Bloom noted that this is not necessarily big data; something as simple as fitting a straight line to data needs to be taught in depth.
• Versioning and reproducibility. Bloom noted that several federal agencies are likely to mandate a specific level of reproducibility in work that they fund.
Bloom suggested that there is a “novelty-squared” problem: what is novel in the domain science may not be novel in the data science methodology. He stressed the need to understand the forefront questions in various fields so that synergies can be found. For example, Berkeley has developed an ecosystem for domain and methodological scientists to talk and find ways to collaborate.
Bloom also noted that data science tends to be an inclusive environment that appeals to underrepresented groups. For instance, one-third of the students in the Python boot camps were women—a larger fraction than their representation in physical science graduate programs.
Bloom concluded by stating that domain science is increasingly dependent on methodologic competences. The role of higher education in training in data science is still to be determined. He stressed the need for data literacy before data proficiency and encouraged the creation of inclusive and collaborative environments to bridge domains and methodologies.
level, as well as experience in programming languages and concepts. However, he noted that a top-quality domain scientist would always be desirable regardless of computational skills.
A participant commented that as much as 80 percent of a researcher’s time is spent in preparing the data. That is a large amount of time that could be spent on more fundamental understanding. Bloom responded that such companies and products as OpenRefine,2 Data Wrangler,3 and Trifacta4 are working on data
clean-ing techniques. However, for any nontrivial question, it is difficult to systematize data preparation. He also suggested that a body of fundamental research should be accessible to practitioners. However, large-scale, human-generated data with interesting value do not typically flow to academe because of privacy and secu-rity concerns. He conjectured that the advent of the Internet of Things will allow greater data access, because those data will not be human data and therefore will have fewer privacy concerns.
DATA SCIENCE AND ANALYTICS CURRICULUM DEVELOPMENT AT RENSSELAER (AND THE TETHERLESS WORLD CONSTELLATION)
Peter Fox, Rensselaer Polytechnic Institute
Peter Fox began by describing the Tetherless World Constellation5 at Rensselaer
Polytechnic Institute (RPI). The research themes are divided loosely into three topics: future Web (including Web science, policy, and social issues), Xinfomatics (including data frameworks and data science), and semantic foundations (includ-ing knowledge provenance and ontology engineer(includ-ing environments). Fox indicated that his primary focus is Xinformatics. He deliberately did not define X, saying that it can mean any number of things.
Fox explained that to teach data science, one must “pull apart” the ecosystem in which data science lives. Data, information, and knowledge are all related in a data science ecosystem; there is no linear pathway from data to information to knowledge. He explained that he teaches or is involved in classes on data science, Xinformatics, geographic information systems for the sciences, semantic eScience, data analytics, and semantic technologies. The students in those classes have varied backgrounds. Last semester, his data science class had 63 students (most of them graduate students), and Xinformatics had about 35 students. Fox structures his
2 See the OpenRefine website at http://openrefine.org/ (accessed June 9, 2014) for more information. 3 See Stanford Visualization Group, “Data Wrangler alpha,” http://vis.stanford.edu/wrangler/,
accessed June 9, 2014, for more information.
4 See the Trifacta website at http://www.trifacta.com/ (accessed June 9, 2014) for more information.
5 See Rensselaer Polytechnic Institute (RPI), “Tetherless World Constellation,” http://tw.rpi.edu,
TR A I N I N G ST U D E N T S T O EX T R A C T VA L U E F R O M BI G DA T A 26
classes so that the first half of the semester focuses on individual work and gain-ing knowledge and skills. The second half focuses on team projects (with teams assigned by him) to demonstrate skills and share perspectives.
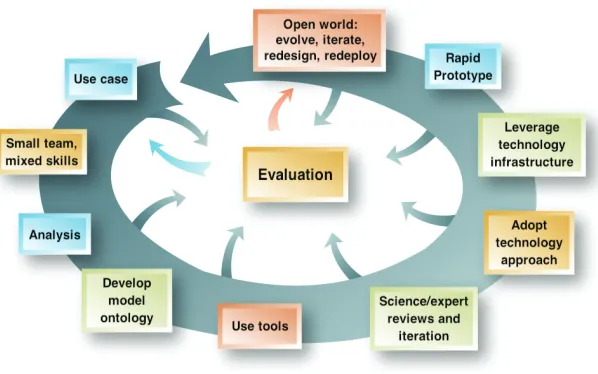
Fox explained that he teaches modern informatics and marries it with a method: the method that he teaches is iterative and is based on rapid prototyping applied to science problems. The framework for the iterative model is shown in Figure 4.1. Fox stressed that technology does not enter the method until well over halfway through the spiral; technology will change, so it is important to impart skills before adopting and leveraging technology.
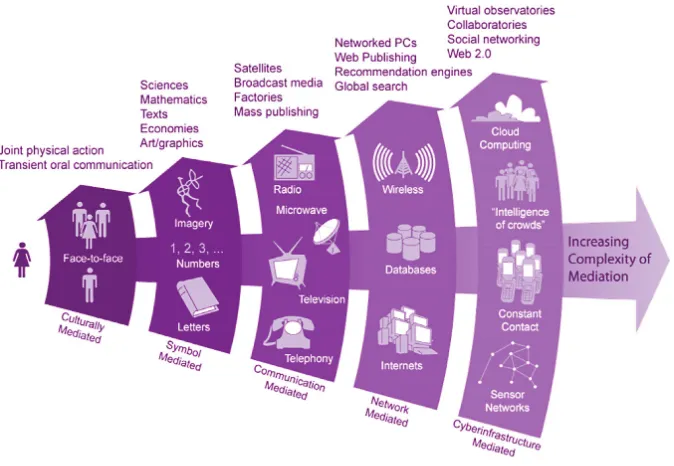
Fox explained that a report was produced for NSF (Borgman et al., 2008) and that a diagram was developed that describes five types of mediation of increasing complexity (shown in Figure 4.2). The five generations of mediation were designed to apply to learning, but they hold true for science and research as well. Fox ex-plained that, in contrast with most generational plots, all generations are present and active at once in both the learning and teaching environment and the science and research environment.
Fox explained that data analytics is a new course at RPI, and his desired pre-requisites are not taught at the university; as a result, his class has no prepre-requisites. After teaching a variety of computer application languages simultaneously, Fox now
FIGURE 4.2 Generations of mediation, applied to the learning and teaching environment and the sci-ence and research environment. SOURCE: Illustration by Roy Pea and Jillian C. Wallis, from Borgman et al. (2008).
uses the R and RStudio6 environment exclusively. (Students preferred the
simplic-ity of learning a single language.) The data analytics course builds from data to processing to reporting to analytics, both predictive and prescriptive. Fox explained that in the ideal scenario, value would be added as one progresses from one step to the next. Part of the challenge is to teach students to understand the value added and to teach them to identify when value is not being added. He emphasized the importance of understanding the value and application of data analysis, not just learning the individual steps. In response to a later question, Fox clarified that students work with self-selected, application-specific examples.
Fox then described information technology and Web-science coursework at RPI. RPI has an interdisciplinary program that consists of a B.S. with 20 concen-trations, an M.S. with 10 concenconcen-trations, and a multidisciplinary Ph.D. offering.7
The program has four technical tracks—computer engineering, computer science,
6 RStudio is an open source, professional user interface for R. See the RStudio website at http://
www.rstudio.com/, accessed September 20, 2014.
7 See the RPI Information Technology and Web Science website at http://itws.rpi.edu (May 22,
TR A I N I N G ST U D E N T S T O EX T R A C T VA L U E F R O M BI G DA T A 28
information systems, and Web science—with numerous concentrations in each track. Fox said that the M.S. was recently revised to include data analytics in the core curriculum and that the M.S. concentrations were updated. He noted in particular the addition of the Information Dominance concentration, which is designed to educate a select group of naval officers each year in skills needed to execute military cyberspace operations.
Fox talked about the Data Science Research Center8 and the less formal Data
Science Education Center at RPI. The centers are loosely organized; more than 45 faculty and staff are involved. RPI also maintains a data repository9 for scientific
data that result from on-campus research.
He listed some lessons learned after 5 years with these programs:
• Be interdisciplinary from the start; grow both technical and data skills simultaneously. Fox noted that teaching skills (such as how to manipulate data by using specific programming languages) can be difficult; skills need to be continually reinforced, and he cautioned that teaching skills may be perceived as training rather than education.
• Teach methods and principles, not technology.
• Make data science a skill in the same vein as laboratory skills. • Collaboration is critical, especially in informatics.
• Teach foundations and theory.
Fox stated that access to data is progressing from provider-to-user to machine-to-user and finally to machine-to-machine; the burden of data access and usability shifts from the user to the provider. In the current research-funding paradigm, data are collected, data are analyzed by hand for several years, and the results are then published. Although that paradigm has served the research community well, Fox noted that it fails to reflect the change in responsibilities that is inherent in the new information era, in which the burden of access shifts from the user to the provider.
Fox concluded by positing that the terms data science and metadata will be obsolete in 10 years as researchers come to work with data as routinely as they use any other research tool.
Bloom noted that there was no mention of “big data” in Fox’s presentation, only data. Fox stated that he does not distinguish big data from data. However, he acknowledged that, as a practical matter, size, heterogeneity, and structural repre-sentations will need to be parts of a student’s course of study.
8 See the RPI Data Science Research Center website at http://dsrc.rpi.edu/ (May 22, 2014) for
more information.
9 See RPI, “Rensselaer Data Services,” http://data.rpi.edu, accessed May 22, 2014, for more
EXPERIENCE WITH A FIRST MASSIVE ONLINE OPEN COURSE ON DATA SCIENCE
William Howe, University of Washington
William Howe stated that the University of Washington (UW) founded the eScience Institute in 2008 and that the institute is now engaged in a multi- institution partnership with the University of California, Berkeley, and New York University and is funded by the Gordon and Betty Moore Foundation and the Alfred P. Sloan Foundation to advance new data science techniques and technologies, foster collabo-ration, and create a cross-campus “data science environment.” According to Howe, the strategy is to establish a “virtuous cycle” between the data science methodology researchers and the domain-science researchers in which innovation in one field will drive innovation in the other. The eScience Institute works to create and reinforce connections between the two sides, and six working groups act as bridges. One of the working groups is involved with education and training.
Howe explained that the education and training working group focuses on different ways to educate students and practitioners in data science. Through the working group, the UW eScience Institute has developed a data science certifi-cate for working professionals, an interdisciplinary Ph.D. track in big data, new intro ductory courses, a planned data science master’s degree, and a MOOC called “Introduction to Data Science.” Howe focused in more detail on his experiences in developing and teaching the MOOC. Teaching a MOOC involves a large amount of work, he said, and the course is continuously developing. The goal of the MOOC is to organize a set of important topics spanning databases, statistics, machine learning, and visualization into a single introductory course. He provided some statistics on the data science MOOC:
• More than 110,000 students registered for the course. Howe noted that that is not a particularly relevant statistic, inasmuch as many people who register for MOOCs do not necessarily plan to participate.
• About 9,000 students completed the course assignments. Howe indicated that that is a typical level of attrition for a MOOC.
• About 7,000 students passed the course and earned the certificate.
He explained that the course had a discussion forum that worked well. Many comments were posted to it, and it was self-sustaining; Howe tried to answer questions posed there but found that questions were often answered first by other engaged students.
TR A I N I N G ST U D E N T S T O EX T R A C T VA L U E F R O M BI G DA T A 30
• Background and scope of “data science.” • Data manipulation at scale.
• Analytics. Howe taught selected statistics concepts in 1 week and machine learning concepts in another week.
• Visualization.
• Graph and network analytics. Howe indicated this was a single, short module.
Howe explained that the selection of topics was motivated by a desire to develop the four dimensions of the course: tools versus abstractions (weighted toward abstractions), desktop versus cloud (weighted toward cloud), hackers ver-sus analysts (balanced, although perhaps slightly in favor of hackers), and data structures and programming versus mathematics and statistics (weighted toward structures).
He conducted a demographic study of his MOOC participants and remarked that most of them were working professional software engineers, as has been reported for other MOOCs. He suggested that perhaps a MOOC could be used like a textbook, with instructors having their students watch some lectures and skip others, just as they do chapters of a book.
A teaching strategy that consists of both online and in-person components, he explained, has two possible approaches: offer the same course simultaneously online and in person or use the online component as a textbook and class time as an opportunity for practical application (juxtaposing the traditional roles of homework and classwork). There are examples of both teaching strategies, and it is unclear whether either will dominate. He also reiterated the importance of student-to-student learning that took place in his experience with a MOOC structure.
In the discussion period, a participant asked about the importance of under-standing the foundations of programming and suggested that algorithms and data constructs should be taught to younger students, for example, in high school. (That last point generated some disagreement among participants. One suggested that even elementary school would be appropriate, but another was concerned that this might displace students from calculus and other critical engineering mathe matics courses.) Howe replied that computer science enrollment is increasing at the under-graduate level by about 20 percent per year, and statistics departments are also seeing increased enrollment. Students understand that they need to understand the core concepts at the undergraduate level.
31
Shared Resources
Important Points Made by Individual Speakers
• Synthetic knowledge bases for domain sciences, such as the PaleoDeepDive system at Stanford University, can be developed by using the automatic extraction of data from scientific journals. ( Christopher Ré)
• Divide and recombine methods are powerful tools for analysts who conduct deep examinations of data, and such systems can be used by analysts without the need for complex programming or a profound understanding of the tools used. (Bill Cleveland)
• Yahoo Webscope is a reference library of large, scientifically useful, publicly available data sets for researchers to use. (Ron Brachman) • Amazon Web Services (AWS) hosts large data sets in a variety of
models (public, requestor-paid, and private or community) to foster large-scale data sharing. AWS also provides data computation tools, training programs, and grants. (Mark Ryland)