Big Data at Work
The amount of data in our world has been exploding, and analyzing large data sets—so called big data—will become a key basis of competition in business. Statisticians and researchers will be updating their analytic approaches, methods, and research to meet the demands created by the availability of big data. The goal of this book is to show how advances in data science have the ability to fundamentally influence and improve organizational science and practice. This book is primarily designed for researchers and advanced undergraduate and graduate students in psychology, management, and statistics.
Scott Tonidandel is Associate Professor, Department of Psychology, Davidson College, NC. He received his PhD in Industrial Organizational Psychology from Rice University in 2001. He teaches courses in Psychological Research, Design and Analysis, and Research Methods and Issues in Psychology. His research includes issues related to computerized testing, and statistical and methodological issues.
Eden B. King is Associate Professor of Industrial Organizational Psychology at George Mason University. She earned her PhD from Rice University in 2006. Her research is mostly in the area of diversity, inclusion, and women in business. She is currently the Associate Editor of the Journal of Management and the Journal of Business and Psychology. She is also on the Editorial Board of the Academy of Management Journal.
SIOP Organizational Frontiers Series
The Organizational Frontiers Series is sponsored by the Society for Industrial and Organizational Psychology (SIOP). Launched in 1983 to make scientific contributions accessible to the field, the series publishes books addressing emerging theoretical developments, fundamental and translational research, and theory-driven practice in the field of Industrial-Organizational Psychology and related organizational science disciplines including organizational behavior, human resource management, and labor and industrial relations.
Books in this series aim to inform readers of significant advances in research; challenge the research and practice community to develop and adapt new ideas; and promote the use of scientific knowledge in the solution of public policy issues and increased organizational effectiveness.
The Series originated in the hope that it would facilitate continuous learning and spur research curiosity about organizational phenomena on the part of both scientists and practitioners.
The Organizational Frontiers Series
Series Editor
Richard Klimoski
George Mason University
Editorial Board
Neal M. Ashkanasy University of Queensland
Jill Ellingson
The Ohio State University
Ruth Kanfer
Georgia Institute of Technology
Eden King
George Mason University
Fred Oswald Rice University
Stephen Zaccaro George Mason University
Deborah Rupp Purdue University
Mo Wang University of Florida
Georgia Institute of Technology
SIOP Organizational Frontiers Series
Series Editor
Richard Klimoski George Mason University
Tonidandel/King/Cortina: (2015) Big Data at Work: The Data Science Revolution and Organizational Psychology
Finkelstein/Truxillo/Fraccaroli/Kanfer: (2014) Facing the Challenges of a Multi-Age Workforce: A Use-Inspired Approach
Coovert/Thompson: (2013) The Psychology of Workplace Technology Highhouse/Dalal/Salas: (2013) Judgment and Decision Making at Work
Cortina/Landis: (2013) Modern Research Methods for the Study of Behavior in Organizations
Olson-Buchanan/Koppes Bryan/Foster Thompson: (2013) Using Industrial Organizational Psychology for the Greater Good: Helping Those Who Help Others
Eby/Allen: (2012) Personal Relationships: The Effect on Employee Attitudes, Behavior, and Well-being
Goldman/Shapiro: (2012) The Psychology of Negotiations in the 21st Century Workplace: New Challenges and New Solutions
Ferris/Treadway: (2012) Politics in Organizations: Theory and Research Considerations.
Jones: (2011) Nepotism in Organizations
Hofmann/Frese: (2011) Error in Organizations
Outtz: (2009) Adverse Impact: Implications for Organizational Staffing and High Stakes Selection
Kozlowski/Salas: (2009) Learning, Training, and Development in Organizations Klein/Becker/Meyer: (2009) Commitment in Organizations: Accumulated
Wisdom and New Directions
Kanfer/Chen/Pritchard: (2008) Work Motivation: Past, Present and Future
De Dreu/Gelfand: (2008) The Psychology of Conflict and Conflict Management in Organizations
Ostroff/Judge: (2007) Perspectives on Organizational Fit
Baum/Frese/Baron: (2007) The Psychology of Entrepreneurship
Weekley/Ployhart: (2006) Situational Judgment Tests: Theory, Measurement and Application
Dipboye/Colella: (2005) Discrimination at Work: The Psychological and Organizational Bases.
Griffin/O’Leary-Kelly: (2004) The Dark Side of Organizational Behavior. Hofmann/Tetrick: (2003) Health and Safety in Organizations.
Jackson/Hitt/DeNisi: (2003) Managing Knowledge for Sustained Competitive Knowledge.
Barrick/Ryan: (2003) Personality and Work.
Lord/Klimoski/Kanfer: (2002) Emotions in the Workplace.
Drasgow/Schmitt: (2002) Measuring and Analyzing Behavior in Organizations. Feldman: (2002) Work Careers.
Zaccaro/Klimoski: (2001) The Nature of Organizational Leadership. Rynes/Gerhart: (2000) Compensation in Organizations.
Klein/Kozlowski: (2000) Multilevel Theory, Research and Methods in Organizations.
Ilgen/Pulakos: (1999) The Changing Nature of Performance.
Earley/Erez: (1997) New Perspectives on International I-O Psychology. Murphy: (1996) Individual Differences and Behavior in Organizations. Guzzo/Salas: (1995) Team Effectiveness and Decision Making.
Howard: (1995) The Changing Nature of Work.
Big Data at Work
The Data Science Revolution and
Organizational Psychology
First published 2016 by Routledge
711 Third Avenue, New York, NY 10017
and by Routledge
2 Park Square, Milton Park, Abingdon, Oxon, OX14 4RN
Routledge is an imprint of the Taylor & Francis Group, an informa business
© 2016 Taylor & Francis
The right of the editors to be identified as the authors of the editorial material, and of the authors for their individual chapters, has been asserted in accordance with sections 77 and 78 of the Copyright, Designs and Patents Act 1988.
All rights reserved. No part of this book may be reprinted or reproduced or utilised in any form or by any electronic, mechanical, or other means, now known or hereafter invented, including photocopying and recording, or in any information storage or retrieval system, without permission in writing from the publishers.
Trademark notice: Product or corporate names may be trademarks or registered trademarks, and are used only for identification and explanation without intent to infringe.
Library of Congress Cataloging-in-Publication Data
Big data at work : the data science revolution and organizational psychology / edited by Scott Tonidandel, Eden B. King, & Jose M. Cortina.
pages cm. — (The organizational frontiers series) Includes bibliographical references and index.
1. Organizational behavior. 2. Big data. 3. Organizational sociology. 4. Psychology, Industrial. I. Tonidandel, Scott. II. King, Eden. III. Cortina, Jose M.
2015010678
ISBN: 978-1-84872-581-2 (hbk) ISBN: 978-1-84872-582-9 (pbk) ISBN: 978-1-31578-050-4 (ebk)
Typeset in Minion
Contents
Foreword by Richard Klimoski
Chapter 1 Building Understanding of the Data Science Revolution and I-O Psychology
Eden B. King, Scott Tonidandel, Jose M. Cortina, and Alexis A. Fink
PART I Big Issues for Big Data Methods
Chapter 2 A Big Data Platform for Workforce Analytics
Jacqueline Ryan and Hailey Herleman
Chapter 3 Statistical Methods for Big Data: A Scenic Tour
Frederick L. Oswald and Dan J. Putka
Chapter 4 Twitter Analysis: Methods for Data Management and a Word Count Dictionary to Measure City-level Job Satisfaction
Ivan Hernandez, Daniel A. Newman, and Gahyun Jeon
Chapter 5 Data Visualization
Evan F. Sinar
Chapter 6 Sensing Big Data: Multimodal Information Interfaces for Exploration of Large Data Sets
Jeffrey Stanton
PART II Big Ideas for Big Data in Organization
I-O Science and Practice
Dan J. Putka and Frederick L. Oswald
Chapter 8 Big Data in Talent Selection and Assessment
A. James Illingworth, Michael Lippstreu, and Anne-Sophie Deprez-Sims
Chapter 9 Big Data in Turnover and Retention
John P. Hausknecht and Huisi (Jessica) Li
Chapter 10 Using Big Data to Advance the Science of Team Effectiveness
Steve W. J. Kozlowski, Georgia T. Chao, Chu-Hsiang (Daisy) Chang, and Rosemarie Fernandez
Chapter 11 Using Big Data to Create Diversity and Inclusion in Organizations
Whitney Botsford Morgan, Eric Dunleavy, and Peter D. DeVries
Chapter 12 How Big Data Matter
Richard A. Guzzo
Foreword
Building Understanding of the Data Science
Revolution and I-O Psychology
Eden B. King, Scott Tonidandel, Jose M. Cortina, and
Alexis A. Fink
“The amount of data in our world has been exploding, and analyzing large data sets—so-called big data— will become a key basis of competition, underpinning new waves of productivity growth, innovation, and consumer surplus …”
—James Manyika et al., McKinsey Global Institute (2011) “Work-force science, in short, is what happens when big data meets H.R… . In the past, studies of worker behavior were typically based on observing a few hundred people at most. Today, studies can include thousands or hundreds of thousands of workers, an exponential leap ahead.”
—Steve Lohr, New York Times (2013) “We’re seeing a revolution in measurement, and it will revolutionize organizational economics and personnel economics.”
—Erik Brynjolfsson, MIT (2013)
These quotes exemplify the profuse conversations about the intersection of big data and business in newspapers, blogs, and popular books. Markedly absent from this discourse is the voice of industrial-organizational (I-O) psychologists. This book, purposefully and permanently, brings I-O psychologists into this important discussion.
theorizing about big data, and (2) to ignite rigorous scholarship on big data in organizations.
What Are Big Data?
What Are the Emerging Opportunities for Science and
Practice?
What could it mean for the study and practice of organizational psychology if we had access to varied and dynamic data? How can we apply new analytic strategies to understand workplace dynamics in more nuanced ways? What could we learn and how could we enhance organizational effectiveness and employee wellness? This is the world of big data, which represents an opportunity to build our science and expand the impact of our discipline. Here we hope to ignite interest in this topic by brainstorming about the major areas of scholarship and practice in organizational psychology that could be explored, expanded, and impacted though big data. Testing of models in these areas—a small sample of which are listed in Table 1 and discussed in the second section of the book— might be facilitated through new data and techniques.
Emerging Tools and Potential Applications
In this section, we describe several new tools and sources of data that can be leveraged to build big data and organizational science: sociometric sensors, social media data and sentiment analyses, microexpression analyses, and psychophysiological measures. This is not an exhaustive list, but rather a preliminary set of data sources that (especially in combination) might offer new insights into I-O psychology. These and other tools, through complementary inductive and deductive approaches, allow new questions and ideas to be generated.
Table 1.1
Areas of opportunity at the intersection of big data and I-O psychology
Area Example New Topics
Selection - Targeted recruitment (targeted marketing efforts)
- Limitless biodata to increase validity and inspire new theory
Training - Genuinely adaptive training environments
Performance
Management - Visualization of individual, team, and organizationalperformance over time - Real-time, continuous monitoring and feedback - Deducing effective physical space designs for teams that
vary with regard to type and interdependence Occupational
Health - Preventative identification of health or safety risk factorsor behaviors - Adaptive gamification to motivate employee health
Horizons - The influence of global or community factors/events onemployees and organizations
variety of highly accurate data can be available such as nonlinguistic social signals (e.g., interest, excitement, influence) and relative location monitoring. Indeed, such sensors are being used to investigate a host of phenomena in organizational behavior. For example, activity and number of team interactions have been shown to be related to creativity (Tripathi & Burleson, 2012). Similarly, Olguín-Olguín and Pentland (2010) found that activity level and interaction patterns as measured by sociometric sensors predicted success by teams in an entrepreneurship competition. These same sensors have also been used in field studies to measure inter-team collaboration patterns as well as integration processes in multicultural teams (Kim, McFee, Olguín, Waber, & Pentland, 2012). In their chapter on teamwork, Kozlowski Chao, Chang, and Fernandez describe the initial stages of team-based research that leverages this kind of technology to assess team process dynamics.
Social media data, text analysis, and sentiment analyses. An obvious area of focus in the world of big data is social media. Social media include websites and applications that enable users to create and share content or participate in social networking. The content of this electronic communication is a treasure trove of psychologically relevant information about people, their relationships, and their behavior. Analyses might involve simply tracking patterns of viewing or clicking, time spent in different virtual spaces, or social network patterns such as who is interacting with whom. According to IBM (2015), social media analytics are designed to “help organizations understand and act upon the social media impact of their products, services, markets, campaigns, employees and partners.” For employers, of course, social media can take on a different importance. Social media activity can give clues to employee engagement and warn of exit behavior. Recruiters can and do review social media information to find and vet candidates. Reviews on sites like Glassdoor affect employment branding and thereby influence the recruiting process of organizations.
sophisticated forms of sentiment analyses use deep learning models to represent full sentences and capture the contexts around which particular language is used. The potential of big data sentiment analyses on business-relevant constructs is further evidenced by the chapter on Twitter analysis (Hernandez, Newman, & Jeon), which develops and applies a word count dictionary representing job satisfaction to a Twitter feed of over one million tweets per day. This is an exciting area, with emerging firms applying real-time methodologies like natural language processing that can recognize sarcasm and emotional nuances (e.g., Kanjoya) and connecting specific text strings and properties to outcomes (e.g., Textio). The leading players in this space are combining sophisticated algorithms with powerful computing and elegant visualization, and they are driving specific, measurable business outcomes.
Microexpression analyses. Another exciting tool with a range of potential applications involves microexpression analyses. Microexpressions can be understood as representations of brief and unconscious reactions to stimuli that cannot be masked but can be detected through careful observation (Ekman, 2009). The original facial action coding system was first published in 1978 and involved intensive ongoing training procedures and coding schemes. Technology has advanced to the point that these codings can be programmed and used to automatically assess genuine reactions and responses to stimuli (Shreve, Godavarthy, Goldgof, & Sarkar, 2011). This advancement has clear applications for law enforcement (i.e., detection of lies, hostility, and dangerous demeanor), but being able to objectively assess genuine human emotion can also be useful to phenomena relevant to I-O such as selection, decision-making, and leadership (see Barsade, Ramarajan, & Westen, 2009). The ability to link microexpression measurement to specific organizational stimuli may lead to insights into effective manager behavior and change management strategies, or to new approaches to measuring and managing employee engagement.
health and fitness that have relevance for occupational health psychology. These are not new but are growing in production, shrinking in size and cost, and increasing in their potential applications for understanding workplace dynamics. The rise in personal biometrics systems opens the door to scalable data capture and enables fascinating new analyses. As offerings in this segment evolve to include biometric measurements and connectivity to smartphones and other devices, new opportunities emerge for real-time linkage analyses.
Novel Questions Enabled by Big Data
Perhaps the most highly touted advantage of big data is that it will allow us to answer old questions in more comprehensive ways. We must not forget, however, that big data may also allow (or force) us to reconceptualize phenomena that we have been studying for decades. Consider the findings of Ilies, Scott, and Judge (2006) that citizenship varies substantially within person, and that this variance can be explained in part by job attitudes (again, within person). Regardless of whether one considers the experience sampling approaches used in their study to be big data or not, there is no denying that the results suggest an entirely different citizenship phenomenon (i.e., some days I’m a good citizen, some days I’m not) from the one that appears in previous work (i.e., I’m a good citizen, you aren’t). As Cortina and Landis (2008) put it, “… these results call into question organizational science. We chose three examples from a broader list of potential topics (see Table 1) that are not covered elsewhere in the book but nonetheless exemplify the potential of big data to inspire scholarship.
prioritize work or family and the immediate affective and physical consequences (e.g., Shockley & Allen, 2013). The tools and sources of big data could take this approach—and with it, our understanding—substantially further. Sensors with geospatial and relational trackers or health monitoring devices, for example, could provide incredibly rich, detailed, and objective observations of the behavioral patterns and corresponding physical consequences for men and women across work and family divides. Knowing where and with whom men and women with different family and work obligations spend their time may allow us to isolate the individual behaviors and decisions that lead to work-family conflict and balance, which in turn could have transformative effects on describing, predicting, and preventing work/life conflict more generally.
Example 2: Training. The proliferation of Internet- and/or computer-based training systems opens up the possibility for genuinely adaptive training systems. Algorithms could be constructed that—like computer adaptive testing—adapt automatically to the needs of learners and tailor their experiences appropriately. To the extent that these adaptive responses are consistent with empirically supported theories of learning, and potentially even tailored to individual differences such as goal orientation, training outcomes could be maximized. This could be accomplished through adaptations in the delivery modality or on the actual content delivered. That is, big data analyses could use techniques such as random forests analysis (see Chapter 3 by Oswald and Putka, this volume) to identify and automatically generate effective combinations of content, form, practice, and assessment that generate optimal training outcomes. In essence, big data give us the opportunity to move from rigid, prescriptive approaches to more agile strategies that capitalize on equifinality. These approaches may expand the absolute quantity of talent available in the marketplace by creating a greater development in a larger population of workers.
basis? In one study using wearable sociometric sensors, co-located and distributed team members were provided visual cues that represent the relative contributions of each team member to the task discussion (Kim, Chang, Holland, & Pentland, 2008). These cues motivated behavioral changes: teams engaged in more collaborative interactions and communication balance after the visual cues than before. Thus, the immediate feedback enabled by big data (its collection, computation, and visualization) enabled higher performance teams. And of course, this raises new questions about the tradeoffs between resource allocation to the task and resource allocation to the processing of feedback, a question that seems irrelevant when feedback only occurs once or twice per year.
These examples complement the much more detailed descriptions of big data applications in selection and assessment (Illingworth, Lippstreu, & Deprez-Sims), teams (Kozlowski et al.), turnover (Hausknecht & Li), and diversity (Botsford Morgan, Dunleavy, & DeVries) that comprise the second half of this book.
Finally, it is worth noting that one of the significant promises of big data is the opportunity for many small improvements, rather than a few larger ones. When data collection is laborious, sample sizes are small, many relevant variables remain unmeasured, and computational power is a scarce resource, a conservative approach focusing on just a few sure bets was important. As we evolve to a world where data are ubiquitous, sample sizes are enormous, a nearly infinite variety of variables are measured, and computational power is abundant, it becomes efficient to pursue many small improvements, in essence building a mountain out of pebbles (see Schumpeter, 2014).
What Are the Dominant Challenges?
The world of big data, though full of opportunity, is not a panacea. Our enthusiasm must be tempered in light of practical and conceptual concerns that cannot be overlooked. We briefly describe some of the most common challenges that big data engenders below.
Practical Concerns
methods that were developed for single shot studies with a limited set of variables and a relatively small number of subjects. With samples sizes increasing by orders of magnitude, our customary reliance on statistical significance testing becomes obsolete. Increased volume in terms of larger sets of variables creates a need for nonstandard data reduction techniques, as established methods become intractable with many, many columns of data. Standard regression practices that typically rely on a well-defined set of variables or attempt to identify the best model from a larger set of variables are outmoded, as they fail to leverage all of the information available. Despite these obstacles, numerous advances in computer science and other domains can be successfully applied to the organizational sciences to provide better answers. Oswald and Putka review a number of these modern techniques.
A related problem arises from the variety of data now available. Simple quantifiable metrics like test scores, responses to survey items, or supervisor ratings of behavior are being replaced by more varied and complex forms of data. These data may consist of textual data, location data, auditory information, or social network graphs. Two chapters in the current volume illustrate applications of these new forms of data to traditional organizational science research questions. Hernandez, Newman, and Jeon describe the challenges associated with the novel use of Twitter data to index job satisfaction while Kozlowski et al. describe using wearable sensors to investigate team dynamics.
The sheer size and complexity of big data demand these new techniques. However, many of these techniques can be applied beneficially to smaller, less complex data sets as well, allowing new insights. For example, machine learning and random forests can be applied where previously we may have used regression. These techniques will yield additional insights. As the systems that apply insights become more sophisticated, some of these more nuanced findings become practical to investigate and apply.
definition. Nevertheless, when data contain substantial volume, velocity, and especially variety, it may be particularly challenging to ensure veracity. The appropriate use of big data requires making use of new statistical techniques to identify and correct (or discard) questionable data points and to translate those that remain into something that allows appropriate inferences regarding variables and phenomena of interest.
Moreover, our prior notions of measurement quality may need to be expanded or modified for big data applications. Concepts such as test-retest reliability are irrelevant for phenomena that vary from moment to moment, but we as a field may have overrated its relevance for such phenomena because we study them at a more temporally molar level. In contrast, more emphasis may need to be placed on errors specific to the measurement instrument. While surveys are identical instruments across individuals, big data measurement technology may not be. Take wearable sensors as an example. It is highly probable that these devices are manufactured such that variability exists in their baseline sensitivity. Furthermore, the sensitivity of any given device may vary with changes in the environment (e.g., walking through a doorway, sitting down at a desk). If these devices were used to identify team centrality, the individual with the most sensitive device, either as a matter of technology or as a matter of environment, may be identified as being most central in the network. Their device would pick up more team member signals on more occasions, not because the person is actually more central, but because their device is more successful at measuring the variable of interest than are the devices of others in the network. However, we believe that, as I-O psychologists, we are ideally situated to contribute to the big data movement because of our expertise with measurement issues. While measurement quality is seldom mentioned in most big data applications, we can bring to bear numerous theories of measurement, such as generalizability theory, that incorporate error from different sources into overall evaluation of measurement quality.
data are often housed in completely separate systems with incompatible interfaces. Moreover, the volume of this data further exacerbates the difficulties of bringing together these disparate sources into a single data system. As discussed earlier in this chapter, much of the most exciting work in big data is in integrating data from multiple data sources, such as biometric sensors, or from entirely separate databases, such as financial systems, click data from websites, and so forth. Significant challenges are encountered in terms of just accessing the data necessary for a big data project. The chapter by Ryan discusses the myriad issues related to integrating disparate big data sources along with some proposed solutions for overcoming these difficulties.
Conceptual Concerns
The question of novelty. Although the popular conception is that these approaches have just evolved since about 2010, in truth, applying science to data from work is old news. We have been doing data analytics about workplace dynamics for over a century. Clearly, the act of using data to inform the science of work is not new. Yet another chapter in the book (Illingworth et al.) details the ways in which big data approaches to selection and assessment differ from traditional lenses. We have moved from gigabytes to terabytes, from real-time capture to real-time analysis, and from structured to unstructured data. Together, these chapters suggest that while data science is indeed old, big data science is quite new.
analytics evolve as an organizational practice, we are seeing depth of content expertise (which is to say, application of theory) as a critical differentiator between those internal research teams that produce the most consistent actionable insights and that struggle more to create impact.
Conclusion
References
Barsade, S. G., Ramarajan, L., & Westen, D. (2009). Implicit affect in organizations. Research in Organizational Behavior, 29, 135–162.
Becker, W. J., Cropanzano, R., & Sanfey, A. G. (2011). Organizational neuroscience: Taking organizational theory inside the neural black box. Journal of Management, 37(4), 933–961.
Cortina, J. M., & Landis, R. S. (2008). When small effect sizes tell a big story, and when large effect sizes don’t. In C. E. Lance & R. J. Vandenberg (Eds.), Statistical and Methodological Myths and Urban Legends: Received Doctrine, Verity, and Fable in the Organizational and Social Sciences (pp. 287–308). Malwah, NJ: Erlbaum.
Ekman, P. (2009). Telling lies: Clues to deceit in the marketplace, politics, and marriage (revised edition). New York, NY: WW Norton & Company.
Goel, V. (2014, June 29). Facebook tinkers with users’ emotions in news feed experiment, stirring outcry. New York Times.
IBM (2015). Retrieved from http://www.ibm.com
Ilies, R., Scott, B. A., & Judge, T. A. (2006). The interactive effects of personal traits and experienced states on intraindividual patterns of citizenship behavior. Academy of Management Journal, 49(3), 561–575. Kim, T., Chang, A., Holland, L., & Pentland, A. (2008). Meeting mediator: Enhancing group collaboration
using sociometric feedback. In Proceedings of the 2008 ACM Conference on Computer Supported Cooperative Work, 457–466. Retrieved from http://dl.acm.org/citation.cfm? id=1460563&picked=prox&CFID=523388114&CFTOKEN=38029144
Kim, T., McFee, E., Olguín, D. O., Waber, B., & Pentland, A. (2012). Sociometric badges: Using sensor technology to capture new forms of collaboration. Journal of Organizational Behavior, 33(3), 412–427. Kramer, A. D., Guillory, J. E., & Hancock, J. T. (2014). Experimental evidence of massive-scale emotional
contagion through social networks. Proceedings of the National Academy of Sciences, 111(24), 8788-8790. Laney, D. (2001). 3-D data management: Controlling data volume, velocity and variety. META Group
Research Note. Retrieved from http://goo.gl/Bo3GS
Lohr, S. (2013, April 20). Big data, trying to build better workers. The New York Times.
Manyika, J., Chui, M., Brown, B., Bughin, J., Dobbs, R., Roxburg, C., & Byers, A. H. (2011). Big data: The next frontier for innovation and productivity. McKinsey Global Institute. Retrieved from http://www.mckinsey.com/insights/business_technology/big_data_the_next_frontier_for_innovation Olguín-Olguín, D., & Pentland, A. (2010). Sensor-based organisational design and engineering. International
Journal of Organisational Design and Engineering, 1(1), 69–97.
data’ that add up to something big. The Economist.
Shockley, K. M., & Allen, T. D. (2013). Episodic work–family conflict, cardiovascular indicators, and social support: An experience sampling approach. Journal of Occupational Health Psychology, 18(3), 262–275. Shreve, M., Godavarthy, S., Goldgof, D., & Sarkar, S. (2011). Macro- and micro-expression spotting in long
videos using spatio-temporal strain. In Automatic Face & Gesture Recognition and Workshops (FG 2011), 2011 IEEE International Conference 51–56.
Part I
A Big Data Platform for Workforce Analytics
Jacqueline Ryan and Hailey Herleman
Industrial and organizational psychologists are very familiar with statistical techniques to find patterns in data that either support or fail to support a hypothesis. The field is less familiar with mining large datasets for patterns; however, the growth and variety of big data are causing researchers to take an interest in what can be learned from these datasets. One of the main challenges to progress in the academic literature relates to gaining access to the organizational datasets required to mine for patterns and/or test hypotheses. In fact at the 2014 SIOP conference many presenters in sessions on big data stated, and restated, that their largest challenge to really understanding the implications of big data in the field was finding big data to analyze.
Organizations, however, have the opposite problem. They have so much data available from both internal and external sources such as transactional systems, events, emails, social media, and sensors (to name a few) that they are challenged to figure out how to find patterns and insights in the inherent complexity of data. Applied I-O psychologists struggle to supply data for research because figuring out where it is, how to get to it, and how to put it together in some meaningful form is quite a challenge. In order to advance the field and truly understand what can be learned from big data, more knowledge is needed about the basics of big data management and accessibility from both a methodology and software perspective.
Big Data in the Workforce
Big data in the realm of workforce management are not new; however, it is being created and stored in volumes we could not have imagined even ten years ago. What is new is the availability of technology to get value out of the breadth of data that exist about employees for use in workforce analytics. Let’s look at one perspective of big data in HR.
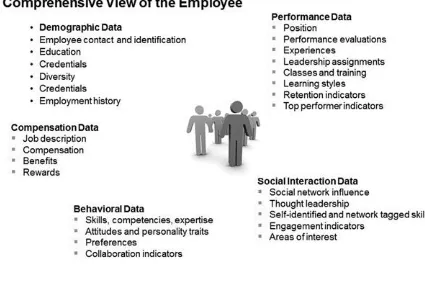
Data about employees can be categorized into at least five different subgroups: demographic data, compensation data, performance data, behavioral data, and social interaction data. Business results data could arguably also be included to create a sixth category for those roles where revenue can be directly attributed to a job role. Sources for employee data can include survey responses, systems of record, social business platforms, and learning systems, to name a few. Taken all together, a complete view of the employee (Figure 2.1) can start to be seen.
Figure 2.1
Employee data from different interactions within the workforce
patterns and insights to be discovered that are not possible when individual data points about an employee are taken in isolation.
Demographic data are unique to a candidate or employee and are transferable through an employee’s career. Typically these data are captured during the job application process and the onboarding process and managed within a human resources information system (HRIS). Employee demographic data are essential for employers to understand their diversity and compliance profile. Examples include:
Employee identification (name, social security number, title) Employee contact information (address, phone, email)
Education (highest educational level, school, degree, graduation year)
Diversity (gender, age, ethnicity, marital status, birth date & country, veteran status—US, disability)
Skills/credentials (languages, credentials, certifications)
Employment history (within company, external to company).
Demographic data, while generally available on all employees, can be some of the most sensitive information to use as there is an expectation, and in certain countries a legal requirement, to maintain and validate security compliance of personally identifiable information such as a social security numbers. When demographic data security is properly managed, these data can provide important workforce segmentation insights when combined with other data such as social interaction data.
Compensation data are specific to an employee’s job and employment within a company. These data reflect information about salary and benefits for the work an employee performs. Data in this category are typically quantitative; however, there are also qualitative attributes such as work flexibility, developmental opportunities, etc. Examples include:
Job description (job title, responsibilities, functions)
Compensation (base pay, commissions, overtime pay, bonus, stock)
Compensation data, like demographic data, are usually maintained in an HRIS and are also very sensitive in nature. In order to conduct employee research at the individual level, information such as compensation has to be carefully governed. Although, as employee compensation often represents the most significant cost to an organization (Society for Human Resource Management, 2008), the data patterns surrounding compensation can be critical to understand in conjunction with other data such as employee performance and employee engagement.
Performance data are accumulated over the lifespan of an employee and describe their business impact and objectives achieved relative to their roles within the business. Examples include:
Retention indicators (employee engagement scores, employee attitudes, loyalty, workplace climate)
Top performer indicators (upward mobility, relative ranking, business impact).
Performance data in I-O research often represent the criterion variable. A key goal in the field is to discover the factors that influence employee performance and retention. However, in big data research, performance data can be defined in many different ways and represent different types of information. While this information is somewhat sensitive, especially performance ratings, it doesn’t carry nearly the expectation of privacy that demographic and compensation data carry. These data, however, carry their own set of challenges. They are often not consistently measured, recorded, or stored. Performance data could be stored in a performance management system, onboarding system, learning software system, HRIS, or in all of the above. Reconciling data across all these systems to get a clear view of an employee’s performance profile can be challenging.
obtained from psychometric testing such as assessments, or rated by supervisors.
Behavioral data are essential to understanding an employee’s (or applicant’s) potential. Where performance data record how a person actually performs in his/her job, these data points provide information on individual knowledge, skills, abilities, and other characteristics (KSAOs) and traits that may indicate what an employee or candidate is capable of doing even if not currently given the opportunity to display these traits in his/her current job. These data are more difficult to measure, although I-O psychologists and psychometricians have focused great energy to ensure there are sound methods available for measuring such characteristics. In addition these data, like performance data, are often scattered in various applicant tracking systems, assessment systems, performance management software, and/or social software. While these can be key predictors of future behavior and success, finding and compiling these data can be tricky for most organizations today.
Scope of influence (network profile) Thought leadership (influencer, follower) Skills (self-identified and network tagged)
Engagement (passion, sentiment, contribution level, loyalties) Areas of interest
Social business collaboration platforms such as Connections, Yammer, and SharePoint amass large amounts of social interaction data each day as employees conduct normal business creating activities, loading files, commenting in communities and blogs, and forming subgroups for collaboration. Employee interactions with other employees and with customers also occur on external social platforms such as Twitter, Facebook, and LinkedIn. Advances in social analytics technology that facilitate employee sentiment analysis, identification of trending topics and issues, etc. have enabled HR leaders to engage in some of the same activities in which marketing has been involved for several years.
Characteristics of Workforce Big Data
As was explained earlier in the chapter, big data refers to all data in workforce analytics and can be characterized by four traits: volume, variety, velocity, and veracity (Zikopoulos et al., 2013).
Figure 2.2
Workforce big data characteristics
Let’s look at each trait relative to the employee data types that were just described.
Volume refers to the size of data. There are more sources of data available to organizations today than ever before in our history. This is due in part to the world becoming much more instrumented and interconnected, thereby generating data well beyond petabyte ranges. Data on this scale pose real management and cost challenges that are relevant for the functioning of workforce analytics. Consider employee network analysis, employee sentiment analysis, and trending topic analysis as links to employee engagement, employee impact, and employee retention. These types of analysis operate using social media data, which are oftentimes extremely voluminous.
web site and applying for a job online. This type of data, collected over long periods of time and used for trend analysis and analysis of abandoned application processes, is another example of highly voluminous data.
Variety refers to the many types of data available: structured, semi-structured, and unstructured. Employee demographic data are an example of structured data, where data are typically stored and managed using relational data store methods. Employee social interaction data is an example of unstructured data typically represented as text data. XML and email are examples of semi-structured data. Historically, quantitative and qualitative techniques have been applied to different sorts of questions by different people with different training. The difference with big data is that now researchers must consider the overall picture created from analytic processes applied to a variety of data. As an example, combining insights from a predictive retention analysis applied over structured data with predictive analysis applied over social media data provides a stronger signal on retention risk factors but requires skill in large sample, longitudinal, quantitative and qualitative textual analysis, and the means by which one combines the previous two.
or in streaming real time such as employee social interactions over social platforms. While as a field I-O research has always appreciated the depth of insight that can be created by longitudinal studies, data velocity is a relatively new challenge for the field. The discussion is no longer only about insight gained from a single dataset. It is now also about the decision making rhythm on a particular topic, how often data are made available and updated so that they can be analyzed for insight to inform a given decision, and how to pull it together in those timeframes. High velocity big data are critical to support ongoing, data driven decision making at the point in time in which an event is occurring.
Challenges Managing and Accessing Big Data for
Workforce Analytics
Finding and Understanding Data
With over 90% of the world’s data created in the last two years (Kleyman, 2012), this makes the challenge of understanding the value of data that much more difficult. What amount of these data are noise as opposed to data that are relevant for finding useful patterns that provide insights? Over 20% of the amount of available data today exists in traditional systems, whereas 80% of the world’s data is unstructured such as text, images, video, etc.
One of the most common questions that arise in workforce analytics is “What data do I have and is it useful?” As seen in the previous section, data are stored in many different locations and originate from execution of business processes, transactions, events, or as an outcome of the way in which we do work. However, not all data are considered relevant.
There are a number of issues that need to be considered when looking at the value of data:
1. Confidence in data—low quality data (so-called dirty data) lead to unreliable workforce analysis, which casts doubt on the insights produced.
2. Data freshness—although important for trend analysis, data that are captured in the past will yield less current or “point in time” insights than data captured in the present.
3. Data availability—access to data across lines of business within an organization varies to such a degree that, although data may exist, it may not always be possible to utilize based on company policies, authorization level, and even country, region, and industry security and privacy restrictions.
4. Completeness of data—data that are missing key elements such as those required for an employee profile typically compromise the ability to uncover relevant patterns.
data. If not addressed at the source, it typically costs 10 to 100 times as much to fix upstream. Research has shown that data quality degrades at a predictable rate of about 2% per month. This can have a substantial impact on outcomes from predictive workforce modeling.
Governing Data Access and Security
The cost and ramifications of using unsecure data for workforce analysis, typical of non-production environments such as a sandbox or test environment, can be significant. Over 70% of organizations use live customer data in non-production environments (Feravich, 2011). Upwards of 50% of organizations have no way of knowing if data used in analysis was compromised (Ponemon, 2007), which can result in an average cost of $194 per record due to a data breach (Mckendrick, 2012).
As workforce analysis increases in complexity requiring additional data sources, the issues surrounding information governance needs to be considered more carefully. Key questions to assess include:
1. Are there regulatory compliance requirements for data access and data sharing within the country and/or region that need to be adhered to?
2. Are there operational and business rules in place that guide data sharing across business units?
3. Are there restrictions within the organization governing who can access certain data sources based on their role or need to know?
4. Are there ethical use considerations in place to govern using employee data deemed personal data that are created for one purpose but used for another? Are there practices in place to gain employee consent for use such that transparency with employees is maintained on the intent of use for these data?
security and privacy management.
There are two schools of thought on the use of big data in analytics projects as it relates to governance: some believe that data need to be maintained in their original raw form and that any modifications to data through governance processes reduce the resulting insights. The other school of thought is that, given the cost of compliance and increased security risks, big data must be governed. In reality, both points of view can be achieved today with advances in both big data technologies to manage data in their raw form and governance processes applied to big data platforms.
Provisioning Trusted Data for Workforce Analytics
Workforce analytics that use a single data source are rare, if not non-existent, today given the advances and application of behavioral science analytical processes. The diversity of data that are used today originating from on-premises systems, cloud applications, web services, etc. results in a number of challenges that I-O researchers have to face including:
Location of data
Protocols for accessing data Format of data
Authorization and security requirements Availability and timeliness of data
Integration methodology to use all required data sources.
Another factor that comes into play even after all of these requirements are addressed is provisioning data for multiple analysts who all have different studies underway. This can become a job in itself and, in fact, is multiple jobs requiring skills found in an information architect, database administrator (DBA), ETL (extract, transform, and load) developer, and data analyst to manage the data supply chain requirements.
Costs Associated with Managing Big Data
of big data that were described earlier in terms of volume, variety, velocity, and veracity put new challenges on traditional systems particularly as they relate to cost.
Operational and storage costs are the biggest cost factors typically measured as operational expenses (OPEX) and capital expenses (CAPEX). Along with workload performance requirements, these have both driven development of new approaches to manage data to reduce these cost factors. This is relevant to workforce analytics processes as it impacts the overall costs that need to be considered associated with deriving insights and results.
Big Data Platform Core Capabilities
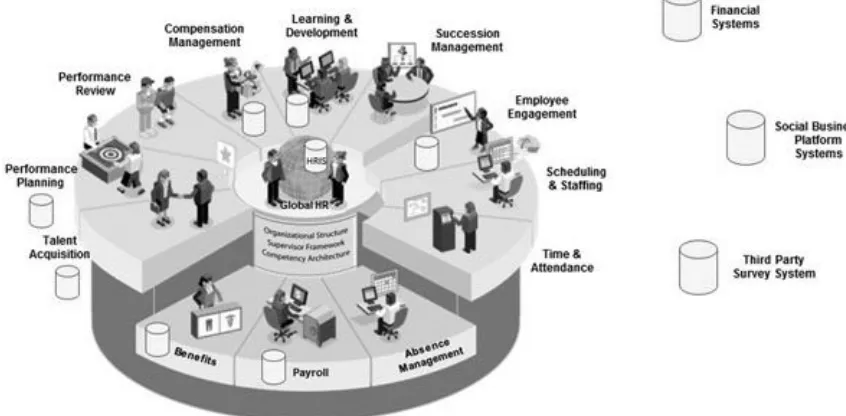
Let’s take an example of a typical globally integrated business. In this example, survey data reside external to the organization, managed by a third party survey vendor. Employee demographic data reside in an HRIS system managed by HR operations. Historical employee performance data reside in a performance management system managed by HR talent management. Employee salary and compensation data reside in yet additional systems managed by the compensation group within HR. Social interaction data are managed within the enterprise’s social business platform managed by IT. Business results data are located in financial systems managed within finance. Figure 2.3 illustrates the numerous systems where all these data would reside across the organization.
In this example, each I-O researcher would need to independently manage interactions with each organization for data set extracts and manage their own local copies of data. This proliferation of data does nothing to help with data security or data quality as different versions of the truth for data begin to surface causing analytic outcomes to be challenging if not impossible to defend or trace. The I-O researcher is also left to manage the integration of all required data sets and any subsequent updates that would be needed (daily, weekly, monthly, quarterly, etc.) as data change due to the normal course of business.
Employee data represented in silo systems across the organization
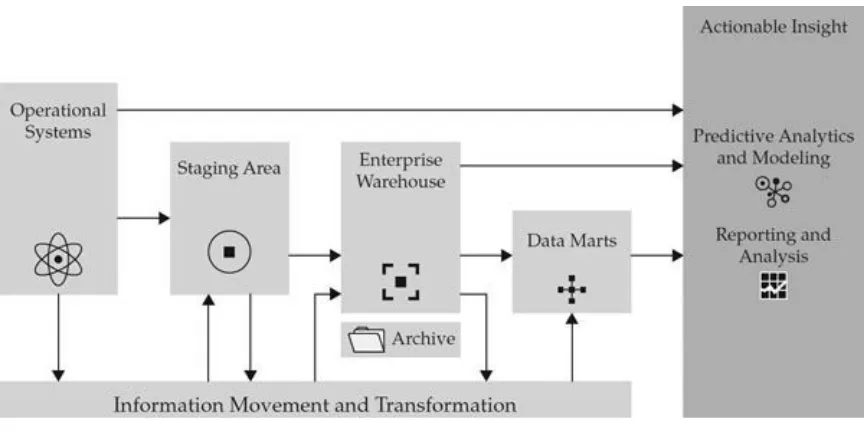
In those cases where an I-O researcher has sourced data from centralized IT resources either by an HRIT group or the enterprise’s IT group, a traditional approach would typically entail an enterprise data management architecture (Zikopoulos, deRoos, Bienko, Buglio, & Andrews, 2015) such as shown in figure 2.4.
Figure 2.4
A traditional approach to enterprise data management
To get around this, I-O researchers and workforce data scientists have taken the route of sourcing workforce data from the EDW and operational systems, storing this data on their local systems. This approach compounds the issues of multiple versions of the truth for data and data security and governance.
Big data platform services address these challenges with the end goal of creating a reliable and trusted information supply chain that manages, integrates, and governs data for workforce analysis enabling:
Big data to be responsibly combined for new uses
Discovering and exploring data with visualizations that are intuitive
Supporting multiple analytical techniques (e.g., cognitive, predictive, statistics, operational BI)
Optimizing multiple analytical processes Minimizing IT costs
Managing, governing, and securing information.
To enable these capabilities, a big data platform performs several core functions:
a. Cleanse, manage, and monitor the state of data quality over time and integrate with other data sources
b. Manage and maintain a comprehensive view of the employee that can be virtually referenced across multiple workforce analytics projects c. Secure monitoring of data access and data usage based on roles and
access authority
d. Manage data throughout its lifecycle—from creation to retirement of analytics processes—to ensure regulatory and business process compliance.
2. Manage big data in a cost effective manner that provide the following services:
a. Reliably manage massive amounts of data—both structured and unstructured
b. Reduce operational costs by augmenting data warehouses that may currently be in place
c. Support data exploration to determine which data is the most valuable and extract that data in a cost-effective manner for further workforce analysis
d. Provision governed data to workforce analytics projects that is transparent to users.
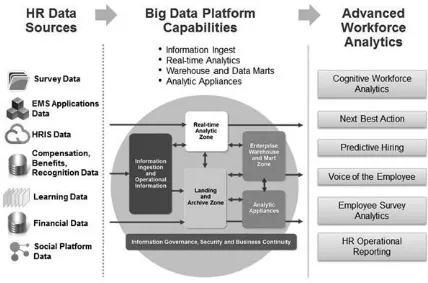
These services are delivered through zones (Chessell & Smith, 2013) that set up an information supply chain, as illustrated with the workforce analytics example in
figure 2.5.
Zones represent separate areas for storing, processing, and accessing data based on the data characteristics and type of workforce analytics processing being deployed. Let’s look at each zone within the big data platform.
Landing Zone
cost with dramatic performance gains. In short, Hadoop makes big data easier to manage. By distributing the processing of large data sets across clusters of commodity servers, Hadoop is designed to scale to thousands of systems. Hadoop also provides high fault tolerance, which means that the system can continue to function correctly even during failures of individual components. One of the many advantages of Hadoop is cost savings in data storage since commodity systems, including storage devices, are used. Another advantage is faster processing time over large data sets. The time to read 1TB from a single disk is about six hours at 50MB/second. As data sets get big, traditional approaches no longer work, which is why distributed systems are used.
Figure 2.5
An information supply chain delivers trusted and governed data for workforce analytics.
this is possible due to the economics and processing capabilities of Hadoop.
Information Ingestion Zone
The information ingestion zone integrates information across all workforce and business data sources for validation, correlation, cleansing, and transformation. Data are received in the landing zone, which has minimal verification and reformatting modifications. Using our previous example, data integration tools are used to connect to the systems across HR, finance, and IT to access data according to security and access permissions defined by each system. Data continue to be managed by the original group from which the data are sourced.
Enterprise Warehouse and Data Mart Zone
The enterprise warehouse and data mart zone is where traditional workforce reporting and applications, such as operational workforce planning applications, are typically run. Data for these types of analysis are highly governed to ensure compliance, auditability, and defensibility. Historical data are usually consolidated, summarized, and bounded within a specified timeframe within a data warehouse. This zone is typically where organizations begin to manage their employee data across the business. As will be discussed further in the chapter, this is also the zone where more and more services are becoming commercially available and provisioned through cloud software as a service (SaaS) form factors to address the skills and costs associated with managing data warehouses.
Real Time Analytics Zone
Complex event processing engines have traditionally been used for performing real time analytics processing; however, their costs, complexity, and limitations make it more difficult to adopt. New technologies have emerged around stream processing that operate over all types of data (structured, semi-structured, and unstructured data) providing nearly instantaneous and reliable delivery of extremely large volumes of data. Data such as click stream data can be processed as it’s generated and trends and patterns can be identified at the point in time the event is occurring instead of analyzing after all data has been copied or landed.
Analytic Appliances Zone
Workforce analytics workloads that contain complex models, more advanced analytics, and/or require processing multiple models in parallel require the functionality of a relational database management system (RDBMS), but with consideration around minimizing the impact to existing workforce reporting and performance management applications. The analytic appliances zone supports these types of workloads by using dedicated appliances that manage high volume and highly complex data co-located with the analytics processes. Analytics appliances have unique approaches to optimize analytical workloads such as no indexing. Data are stored in a manner that is more suitable for parallel processing. Analytical functions are embedded into the core of the processing engines to improve processing performance. Quite often hardware accelerators are used to further improve analytics workload processing performance.
Together, these zones enable a whole paradigm shift in the approach to workforce analytics. We’ll look at five examples that compare traditional workforce analytics approaches to new approaches that are possible with big data platform services.
Use More of the Available Employee and Business Data
approach, all employee information can be analyzed without imposed sample size restrictions. Additional data about employees can also be pulled in to model without the costs of data management outweighing the benefits of increased model precision.
Make It Easier to Use Data
Let Data Lead the Way
Traditional approaches start with a hypothesis and test against selected data to prove or disprove a hypothesis. This requires the I-O researcher to know ahead of time what questions to ask to support or fail to support the hypothesis. There is a potential for key insights to be missed if questions are missed. An alternate approach is to start with the data. Using a big data approach, all data are explored to identify and discover initial correlations and patterns to determine if they are worth analyzing further.
Use Data as They Are Captured
stored, typically in a data warehouse and/or data mart. This effectively causes a delay in getting at insights that may need to be acted on sooner rather than later. Using a big data approach, data are analyzed as they are created to get insights in real time as an event is occurring. This can be incredibly valuable to respond to events as they are occurring, such as identifying employee fraud through transactional system data analysis, guided instructional opportunities at the point of interaction, or trending issues discovered through employee interaction on social business platforms.
Combine Analysis from Data in Motion and Data at Rest for
Stronger Signals
Cloud Big Data Platform Services
Cloud technology, combined with the advent of cognitive computing, creates a whole new opportunity to simplify workforce analytics. Cloud computing is the delivery of on-demand computing resources covering anything from applications to entire data centers. Resources are provided over the internet on a pay-for-use basis. Cognitive systems are the next generation of computing systems that combine cloud services, data services, analytics, and natural language processing to quickly discover new patterns and insights from all data. Cognitive systems learn from interactions over time, becoming more knowledgeable as the language and terminology of a domain, such as human resources, is acquired. Skills, lack of time, and costs are examples of the typical obstacles preventing business users from adopting analytics. Cognitive systems address all three of these issues by enabling HR professionals and I-O researchers to pose questions in natural language with statistical and predictive analysis automatically managed through cloud services. Insights are returned through visualizations that are based on the question, which helps simplify storytelling. IBM Watson is an example of commercially available cognitive system offered as a cloud service.
Entire components of the big data platform described in the previous section can be provided as a service. The advantage is that costs and complexity associated with buying and managing the underlying hardware, software, provisioning, and hosting are all provided as a service. This allows the I-O researcher to more focus on workforce analysis rather than managing the underlying information supply chain.
Public cloud services are owned and managed by companies that provide access to computing resources. There’s no need to purchase hardware, software, or supporting infrastructure, as the cloud provider manages all of these. Resources are shared through a multi-tenant environment.
dedicated environment that is not multi-tenant in nature.
Hybrid cloud services use a private cloud foundation and provisions services using the public cloud approach. Sensitive data are managed in a traditional data center environment or private cloud while applications are provisioned in a multi-tenant approach.
Summary
Big data provide a tremendous opportunity to identify a comprehensive view of employees and expand the impact and outcomes from workforce analytics. Big data in the workforce can include employee demographic data, performance data, compensation data, behavioral data, and social interaction data. Workforce big data have characteristics relating to the variety, velocity, volume, and veracity of data that pose new challenges for I-O researchers. Technologies and best practices from other fields of study can be directly applied to human resources to help address these challenges to gain access to organizational datasets, govern data access and security, manage and provision trusted data, and minimize costs associates with workforce big data.
In addition to addressing the challenges of managing workforce big data, a big data platform creates a whole new paradigm shift in the approach to workforce analytics. All employee information can be used in analysis instead of only a subset of data. The effort required to use data is reduced. Insights discovered from examining data first can guide the amount of additional workforce analysis that may or may not be required. Real time analysis is made possible, enabling insights to be surfaced at the time of an event such as detecting employment branding issues through social media sources. In addition, stronger signals can be identified by running multiple workforce analytical workloads in parallel.
Technologies such as Not only SQL (NoSQL) databases, Hadoop, and RDBMS support information management zones. Zones provide fit-for-purpose services that are used depending on the specific data and workforce analytics processing that are being performed by an I-O researcher or workforce data scientist. The landing zone, information ingestion zone, enterprise data warehouse and data mart zone, real time analytics zone, and analytic appliance zone all together enable an effective and trusted information supply chain.
References
Chessell, M., & Smith H. (2013). Patterns of information management. Retrieved from http://www.redbooks.ibm.com/Redbooks.nsf/ibmpressisbn/9780133155501
Feravich, S. (2011, December 21). Ensuring protection for sensitive test data. Retrieved from
Kleyman, B. (2012, September 12). The big data battleground: Analyzing the big picture. Retrieved from http://www.datacenterknowledge.com/archives/2012/09/12/a-look-into-the-big-data-battleground-analyzing-the-market/
Manyika, J., Chui, M., Brown, B., Bughin, J., Dobbs, R., Roxburgh, C., & Byers, A. H. (2011). Big data: The next frontier for innovation, competition, and productivity. Retrieved from http://www.mckinsey.com/insights/business_technology/big_data_the_next_frontier_for_innovation Mckendrick, J. (2012, March 20). Cost of a data breach: $194 per record. Retrieved from
http://www.smartplanet.com/blog/business-brains/cost-of-a-data-breach-194-per-record/
Ponemon, L. (2007, November 27). The insecurity of test data: The unseen crisis. Retrieved from http://download.101com.com/pub/esj/files/TestDataReport.pdf
Schroeck, M., Shockley, R., Smart, J., Romero-Morales, D., & Tufano, P. (2012). Analytics: The real-world use of big data. Retrieved from http://www.ibm.com/systems/hu/resources/the_real_word_use_of_big_data.pdf
Society for Human Resource Management. (2008, November 1). Salaries as a percentage of operating expense.
Retrieved from
http://www.shrm.org/research/articles/articles/pages/metricofthemonthsalariesaspercentageofoperatingexpense.aspx Society for Human Resource Management. (2012, December 5). Managing and leveraging workplace use of
social media. Retrieved from
http://www.shrm.org/templatestools/toolkits/pages/managingsocialmedia.aspx
Zikopoulos, P., deRoos, D., Bienko, C., Buglio, R., & Andrews, M. (2015). Big data beyond the hype. Retrieved from http://www.ibmbluhub.com/big-data-ebook/
Zikopoulos, P., Deutsch, T., Deroos, D., Corrigan, D., Parasuraman, K., & Giles, J. (2013). Harness the power of big data, the IBM big data platform. Retrieved from
A Scenic Tour
Frederick L. Oswald and Dan J. Putka
Moving Beyond Small Data
Organizational psychology—like most of psychology—has been beset with a history of small data, or samples with data that may not generalize to other settings and samples. This has led to the strident complaint that research in psychology has been statistically underpowered for decades (see Cohen, 1992; Maxwell, 2004; Sedlmeier & Gigerenzer, 1989), meaning that practically significant effects in the world often get overlooked (creating type II errors) and potentially not published. Or sometimes when such underpowered effects get published, they are overstated because the magnitude of the observed effect has to be biased upward enough to become statistically significant (creating publication bias).