Meat Quality Classification Based on Color Intensity
Measurement Method
Titin Yulianti1,a, Afri Yudamson1,b, Hery Dian Septama1,c, Sri Ratna Sulistiyanti 1,d, F.X.Arinto
Setiawan1,e
1Department of Electrical Engineering, University of Lampung, Bandar Lampung, Indonesia
b[email protected], c[email protected], d[email protected], e[email protected],
Mareli Telaumbanua2,f
2Department of Agriculture Engineering, University of Lampung, Bandar Lampung, Indonesia
Abstract— The fresh and defective beef identification by consumers is subjectively through visual observation. However, identifying beef quality manually has disadvantage, there is human visual limitations, differences in human perception in assessing the quality of an object, and ability of each individual knowledge are different. Therefore, we need a technological device that can be applied to identify the quality of beef that can be used by people. The aim of this research is measuring the percentage of color intensity average from R, G, and B channel. The fresh and defective beef is identified using feature of the beef image. That feature is percentages of intensity average value from R (red), G (green), and B (blue) channel. The optimal feature is gotten based on the percentage values. The feature is gotten by using image processing method. The percentage of R channel intensity average value is defined, which can be used to classify the fresh and defective beef. The percentage of R channel intensity is consecutively decrease on every 4 hours. It is shown on each beef sample. The R channel of the fresh image has higher percentage of intensity average value than the defective beef. The fresh beef has 56.38% to 66.33% of the R channel intensity average. whereas the defective beef has 37.76% to 51.71% of the R channel intensity.
Keywords—percentage of intensity average, beef quality classification, image pocessing.
I. INTRODUCTION
Data from National Survey of Social Economic in Indonesia (SUSENAS) year 2014 showed that Indonesian consumption of beef is only 2.08 kg / capita / year. This number is lower than beef consumption in other developed countries. In general, the Indonesian people consume beef mostly at celebrations and religious holidays [1].
The potential of cattle breeding development for meat demand in Indonesia is very large. The availability of land, labour, and the capacity of natural resources is abundant. Moreover, the government support, making cattle breeding sector in Indonesia become potential.
However, Indonesia still not be able to fulfill beef stock for nationaldemand. Therefore, Indonesia is depending on import to overcome the situation.
The location of cattle farm in Indonesia is also not evenly distributed in each province. This resulted in a lack of availability meat and an increase price of meat in an area with a great level of meat consumption. The cattle production centers in Indonesia are in East Java province that is equal to 21.09% of beef production throughout Indonesia, while the province of Lampung produce only 2.44% of national beef production.
Based on Information System for Agriculture in 2015, the development of beef prices at the consumer level from 1983 to 2015 has fluctuated and tended to increase. During these periods, the price of beef at the consumer level rose by 13.21% per year. Beef prices last five-year period (2011-2015) tend to increase Rp.69.641 to Rp.104.326 [1].
The high price of beef cause to a few unfair traders take action to mix the fresh beef with defective beef to obtain greater profits. Thus, the problem of defective beef sales in the market are still happening. The inspection and investigation conducted by government has not been able to guarantee that traders did not sells defective beef. Therefore, consumers need the ability to identify beef quality, before buying it.
Until now, fresh and defective beef identification method by consumers is subjectively through visual observation [2]. However, identifying beef manually has disadvantage, there is human visual limitations, differences of human perception on assessing the quality of an object, and ability of each individual knowledge are different [2-4]. Therefore, we need a technological device that can be applied to identify the quality of beef that can be used by people. The first step in research that starts from develop of a method for identifying fresh beef and defective ones. The method is used based on image processing, because the image of meat are able to represent its quality [2].
using computational algorithms, the meat quality information can be obtained.
This work is focused on identify of beef quality and clasify it as fresh and defective. The aim of this study is measuring the percentage of color intensity average from R, G, and B channel. The optimal feature is gotten based on the percentage values.
II. RELATED WORKS
The fresh and defective meat identification can be performed by laboratory tests. However, the access is limited only by food quality associated institutions. Guzek et al [5] studied the appropriate way to analyze and develop method to identify meat quality outside the laboratory. The results of this study is a method of meat identification using infrared spectroscopy near distance and computer-based image analysis. The research related to the identification of meat has been conducted by several researchers. Nai chian et al [2] classified the meat freshness degree using texture and the change of color space and histogram. Red Green Blue (RGB) and Hue Sturation Intensity (HSI) color space were used in the research. Mean value and mean interval value of color space were used in classification. The other research investigated that the color change in foal meat can vary after thawing out in relation to slaughtering age of the horses and to the post thawing time [6]. The color and multispectral image texture features were used on beef tenderness prediction [7].
Yuristiawan [8] developed an aplication for local beef freshness level detection using feature extraction of color statistical approach.
III. MATERIAL AND METHOD
A. Data Preparation
The tenderloin beef that commonly used for steak is used as the sample. Furthermore, the beef is sliced crosswise as five pieces and placed on the plate. The smartphone’s camera with resolution of 5MP is used to capture the beef images. Since the resolution is commonly used on smartphone and as the minimum resolution of smartphone’s camera today. We assume when using camera with resolution of 5MP can identify the beef quality, it is mean with higher resolution the beef quality can be identified easier. The images are taken every 4 hours consecutively in 24 hours. Since there are 5 samples of beef, the number of data are 30 images.
B. Approach
In this research , fresh and defective beef is identified using feature of the beef image. That feature is percentages of intensity average value from R (red), G (green), and B (blue) channel. The feature is gotten by using image processing method. The steps of the image processing is shown in Fig.1.
Fig. 1 Flowchart of approach image processing
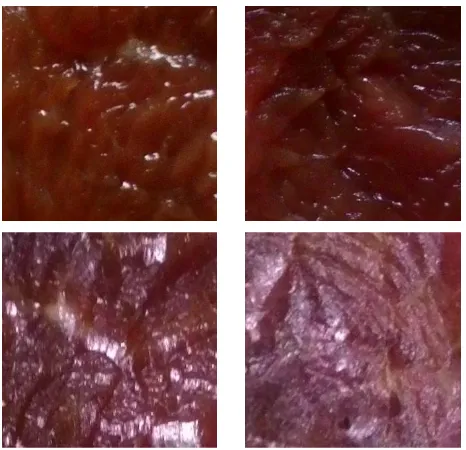
The first step is image preprocessing by cropping the image to get the RoI (Region of Interest) and eliminating the image label and the background. In this research the RoI of image is the beef as the object. The example of the cropped image is shown in Fig 2.
Fig. 2 Example of beef images after 4 hours (first row) and beef images after 16 hours (second row) that have been cropped
R, G, and B channel extracting
Measuring percentage of R, G, and B channel
Percentage of intensity average value
End
Measuring Intensity average value of R, G, and B channel
Start
Since the image is in RGB color, the channels can be extracted. The measurement of the separate color intensity average is done in each channel by using the equations below.
1 1
Then the percentage of the separate color intensity average of each channel is measured by using equation (4), (5), and (6).
%R R therefore the optimal feature is obtained.
IV. RESULT AND DISCUSSION
During beef observation by taken image of beef consecutively every 4 hours, the beef its self has decomposed. The decomposed process can be observed visually based on the beef color of image. However, the color change is subjective and has not been measurable yet. It means that identifying of beef freshness is depend on observer experience. The freshness level of beef can be identified by using image processing method conducted in this research.
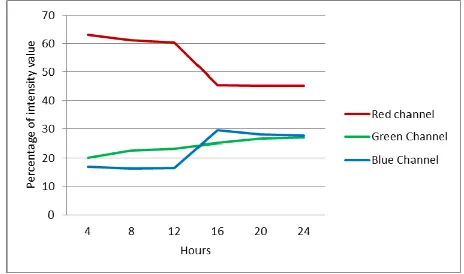
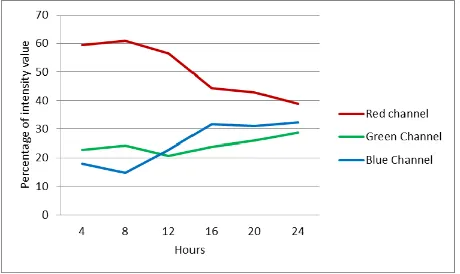
The result of this research is shown in graph. Fig.3- Fig.7 show the alteration percentages of intensity value of R, G, and B channel consecutively every 4 hours on each beef sample.
Fig. 3 The alteration of percentages of intensity value consecutively every 4 hours on beef sample 1
Fig. 4 The alteration of percentages of intensity value consecutively every 4 hours on beef sample 2
Fig. 5 The alteration of percentages of intensity valueconsecutively every 4 hours on beef sample 3
Fig. 7 The alteration of percentages of intensity value consecutively every 4 hours on beef sample 5
The results show that the RGB channel intensity has a common pattern. The percentage of R channel intensity value are consecutively decrease every 4 hours and more significantly decrease among 12 and 16 hours. Whereas the percentage of B channel intensity value mostly increase every 4 hours and more significantly increase among 12 and 16 hours. However, the percentage of G channel intensity value did not show alteration significantly. Therefore we assumed that we can clasify the meat quality by using the color intensity measurements. The results show that first 12 hours may clasified as fresh meat and after 12 hours as defective meat.
The minimum, maximum, and average value of the percentages of intensity average are tabulated in Table 1.
TABLE I. THE COMPARISON OF PERCENTAGES OF INTENSITY AVERAGE percentages of B channel intensity average value on the fresh beef is mostly lower than the defective beef. However, the percentages of G channel intensity average value on the fresh and defective beef are fluctuating.
The minimum value of the percentage on R channel of fresh beef is 56.38%, therefore the maximum value of percentage on R channel of defective beef is 51.71%. It is mean that it is can be used as the feature to identify the fresh and defective beef. The fresh beef has percentage of R channel intensity average value range from 56.38% to 66.33%, whereas
the percentage value range for defective beef is 37.76% to 51.71%.
On the B channel, the minimum percentage value of fresh beef is 18.05% while the maximum value of the defective beef is 22.96%. The two values are closely intersect, thus it can’t be used as the feature.
Then, the maximum value of the percentage on G channel of fresh beef and the minimum value of percentage on G channel of defective beef have same value, 22.85%.
It means that the proposed method is successfully obtain the optimal feature. The percentage of R channel intensity average value is defined, which can be used to separate the fresh and defective beef.
V. CONCLUSION
The measurements of the color intensity average on the R, G, and B channel of the beef image is presented in this paper. The percentage of R channel intensity is consecutively decrease on every 4 hours and more significantly decrease among 12 and 16 hours.. It is shown on each beef sample. The percentage of color intensity average of each channel is also measured. The R channel of the fresh image has higher percentage of intensity average value than the defective beef. The fresh beef has 56.38% to 66.33% of the R channel intensity average. whereas the defective beef has 37.76% to 51.71% of the R channel intensity. Therefore, the percentage of the color intensity average of the Red channel on beef image can be used as the feature to identify the fresh and defective beef.
VI. FUTURE WORKS
The R, G, and B channel pattern in this paper for beef quality classification may be used to classified another meat that have closely characteristics with beef i.e red color. The others should observed as future works to find the R, G, and B channel pattern.
ACKNOWLEDGMENT
The authors would like to thank Integrated Control System (ICS) Riset Group of Electrical Engineering, University of Lampung and also thank to LPPM for providing financial support through DIPA PNBP Faculty of Engineering.
REFERENCES
[1] R. Suryani, "Agricultural Commodities Outlook: beef livestock subsector (in bahasa : Outlook komoditas pertanian subsektor peternakan daging sapi)." Sekretariat Jenderal, Kementerian Pertanian, Indonesia2015.
[2] V. N. Chian, F. S. A. Saad, M.F.Ibrahim, S. Sudin, A. Zakaria, and A. Y. M. Shakaff, "Meat Color Recognition and Classification Based on Color using NIR/VIS Camera," presented at the 8 th MUCET, Melaka, Malaysia, 2014.
[4] T. Yulianti, "No-reference Retinal Image Quality Assessment Method Development Based on Feature Extraction (in bahasa: Pengembangan Metode Penilaian Kualitas Citra Retina Tanpa Menggunakan Citra Referensi Berbasis Ekstraksi Fitur)," Electrical Engineering, Universitas Gadjah Mada, Yogyakarta, Indonesia, 2015.
[5] D. Guzek, D. Glabska, E. Pogorzelska, G. Pogorzelski, and A. Wierzbicka, "Instrumental Texture Measurement of Meat in A Laboratory Research and on A Production Line," Advances in
Sience and Technology Journal, vol. 7, September 2013.
[6] P. D. Palo, A. Maggiolino, P. Centoducati, and A. Tateo, "Colour Changes in Meat of Foals as Affected by Slaughtering Age and Post-thawing Time," Asian-Aust. J. Anim. Sci., vol. 25, pp. 1775-1779, December 2012.
[7] X. Sun, K. J. Chen, K. R. Maddock-Carlin, V. L. Anderson, A. N. Lepper, C. A. Schwartz, et al., "Predicting beef tenderness using color and multispectral image texture feature," Meat
Science Journal, vol. 92, pp. 386-393, December 2012.