75
J Trop Soils, Vol. 17, No. 1, 2012: 75-84Carbon Storage and Carbon Dioxide Emission as Influenced
by Long-term Conservation Tillage and Nitrogen Fertilization
in Corn-Soybean Rotation
Muhajir Utomo, Henrie Buchari, Irwan Sukri Banuwa, Lanang Koko Fernando and Rahmat Saleh
Agro-technology Department, Faculty of Agriculture, University of Lampung, Jl. Sumantri Brojonegoro No. 1, Bandar Lampung 35145, Indonesia.
Tel/fax: +62-721-781822, e-mail: [email protected] Received 9 November 2011 / accepted 4 January 2012
ABSTRACT
Although agriculture is a victim of environmental risk due to global warming, but ironically it also contributes to global greenhouse gas (GHG) emission. The objective of this experiment was to determine the influence of long-term conservation tillage and N fertilization on soil carbon storage and CO2 emission in corn-soybean rotation system. A factorial experiment was arranged in a randomized completely block design with four replications. The first factor was tillage systems namely intensive tillage (IT), minimum tillage (MT) and no-tillage (NT). While the second factor was N fertilization with rate of 0, 100 and 200 kg N ha-1 applied for corn, and 0, 25, and 50 kg N ha-1 for soybean
production. Samples of soil organic carbon (SOC) after 23 year of cropping were taken at depths of 0-5 cm, 5-10 cm and 10-20 cm, while CO2 emission measurements were taken in corn season (2009) and soybean season (2010). Analysis of variance and means test (HSD 0.05) were analyzed using the Statistical Analysis System package. At 0-5 cm depth, SOC under NT combined with 200 kg N ha-1 fertilization was 46.1% higher than that of NT with no N
fertilization, while at depth of 5-10 cm SOC under MT was 26.2% higher than NT and 13.9% higher than IT. Throughout the corn and soybean seasons, CO2-C emissions from IT were higher than those of MT and NT, while CO2-C emissions from 200 kg N ha-1 rate were higher than those of 0 kg N ha-1 and 100 kg N ha-1 rates. With any N
rate treatments, MT and NT could reduce CO2-C emission to 65.2 %-67.6% and to 75.4%-87.6% as much of IT, respectively. While in soybean season, MT and NT could reduce CO2-C emission to 17.6%-46.7% and 42.0%-74.3% as much of IT, respectively. Prior to generative soybean growth, N fertilization with rate of 50 kg N ha-1
could reduce CO2-C emission to 32.2%-37.2% as much of 0 and 25 kg N ha-1 rates.
J Trop Soils, Vol. 17, No. 1, 2012: 75-84 ISSN 0852-257X
INTRODUCTION
http://journal.unila.ac.id/index.php/tropicalsoil DOI: 10.5400/jts.2012.17.1.75
Keywords: Conservation tillage, carbon storage, CO2-C emission, N fertilization
In recent decade, global warming due to greenhouse gas (GHG) emission is receiving great attention (Rastogi et al. 2002; Lal 2007). Among the greenhouse gases, CO2 is the most important gas, accounting for 60% of global warming (Rastogi et al. 2002). Agricultural systems are estimated to contribute up to 20% of the global anthropogenic CO2 emissions (IPCC 2006; Haile-Mariam et al. 2008). In contrast to agriculture in developed countries that only contributes less CO2 emissions, Indonesia agriculture along with land use change and forest contributes to CO2 emission as much as 53% (Boer 2010). Intensive agriculture contributes to CO2 emission throughdirect use of fossil fuels
from food production, indirect use of embodied energy in inputs, and cultivation of soils that cause the loss of carbon through decomposition and erosion (Pretty and Ball 2001). As business as usual practice in agriculture, intensive tillage (IT) produces favorable soil microenvironment that can accelerate microbial decomposition of plant residues. Tillage breaks down soil aggregates, helps in mixing soil and organic particles, and enhances gas diffusivity and air-filled porosity resulted in a higher CO2 production (Rastogi et al. 2002). The higher CO2 emission in intensive tillage therefore, should be reduced, other wise it will decrease C storage in the soil and end up with the decrease of soil quality and soil productivity (Paustian et al. 2004).
2
reducing agriculture’s potential on global warming (Pretty and Ball 2001; Rastogi et al. 2002; Six et al. 2004; Lal 2007; Smith 2010). In fact, in the Kyoto Climate Protocol and IPCC Guidelines for National Greenhouse Gas Inventories, conservation tillage is listed as an option for carbon sequestration (Sedjo et al. 1998; Egglestone et al. 2006). By implementing CT therefore, Indonesia has an opportunity to reduce national GHG emission as much as 26% in 2020. This is because in upland agriculture, CT has been rapidly expanded since about 1990, particularly in the region with lack of labors, such as in Sumatra, Borneo and Celebes. Yet in 1998, CT has been explicitly stated in national land preparation policy (Utomo et al. 2004).
Plant residue which used as mulch in CT is important, because it serves as substrate that is converted to microbial biomass and soil organic matter, and has the potential to enhance carbon sequestration in agricultural soils (Wright and Hons 2004; Smith and Collins 2007). Previous studies in temperate regions showed that long-term CT using plant residues could increased soil organic C in the upper layer of soil, but it did not store soil organic carbon more than IT for the whole soil profile (Wright and Hons 2004; Al-Kaisi and Yin 2005; Blanco-Canqui and Lal 2008).
The higher of soil C storage with respect to CT is related to the lower of CO2 emission from CT than IT. In general, CO2 emission from soil can be attributed to biological and chemical process within the soil that may include CO2 from soil organic matter and crop residue decomposition, and from root respiration (Rastogi et al. 2002; Al-Kaisi et al. 2008). In biological process, soil micro flora contributes 99% of the CO2 from decomposition of organic matter, while the contribution of soil fauna is much less. Root respiration, however, contributes 50% of the total soil respiration (Rastogi et al. 2002). Research conducted in temperate regions showed that CO2 emission from CT was consistently lower than IT (Reicosky 2001; Al-Kaisi and Yin 2005; La Scala et al. 2005; Brye et al. 2006; Bono et al. 2008). As that of CT, N fertilization as part of integrated nutrient management can influence both soil C sequestration and CO2 emission. The influence of N fertilization on CO2 emission however, is not well understood. Increasing N fertilizer application rate was site specific and had inconsistent effect on depressing CO2 emission (Al-Kaisi et al. 2008). This inconsistent effect creates challenge to carry out further study to understand the effect of N fertilization and its interaction with CT on soil storage and CO2 emission.
The long-term experiments of CT and N application on C storage and CO2 emissions have been conducted mostly in temperate regions, but very few conducted in tropical region such as in Indonesia. The objective of this experiment was to determine the influence of long-term (22 and 23 years) conservation tillage and N fertilization on soil carbon storage and CO2-C emission in corn-soybean rotation system.
MATERIALS AND METHODS
Site Characteristics and Plot History
The long-term conservation tillage and N fertilization experiment was established in February 1987 at the experiment farm of Politeknik Negeri Lampung, Sumatra, Indonesia (Utomo et al. 1989; Utomo et al. 2010). Cropping pattern of this long-term experiment was cereal (corn or upland rice)-legume (soybean, mungbean or cowpea)-fallow (weed or bare soil) rotation. The long-term experiment is located at 105o
13’45.5"-105o13’48.0"E, 05o21’19.6"-05o21’19.7"S, with
elevation of 122 m from sea level. The land prior to long-term experiment initiation was a ladang (a rain-fed farming with period of fallow), which was abandoned for more than four years and covered by alang-alang (Imperata cylindrica) grass with average dry matter 12.2 Mg ha-1. The soil is a Typic
Fragiudult with slope ranging from 6 to 9%. Soil particle sizes composition in the soil surface layer sampled in 1987 was 160, 320 and 520 g kg-1 of
sand, silt and clay, respectively. Initial bulk density at 0-20 cm depth was 0.90 Mg m-3, total porosity
65.7%, pH H2O 6.8, pH KCl 5.8, soil organic-C 16.0 g kg-1 and soil organic-N 2.0 g kg-1 (Utomo et al.
1989). Due to the upper layer soil compaction, all plots of conservation tillage were plowed in 1997 and 2002. In 2003, due to the soil became acid, so that all plots were limed with 4 Mg ha-1 of CaCO
3
(Utomo 2004; Utomo et al. 2010). Method and Analysis
The experiment was arranged in a factorial, randomized completely block design, with four replications. Plot size was four by six meters. The first factor was tillage systems; those were intensive tillage (IT) and conservation tillage (no-tillage, NT and minimum tillage, MT). While the second factor was nitrogen treatment with rates of 0, 100 and 200 kg N ha-1 applied for corn; and 0, 25, and 50 kg N
ha-1 for soybean production. Nitrogen source for the
J Trop Soils, Vol. 17, No. 1, 2012: 75-84
week after planting and two third of N rates were applied prior to generative period taken place. Hybrid corn (Zea mays L.) variety Pioneer 21 was planted at 3-5 cm depth at spacing of 75 × 25 cm on September 9, 2009; while soybean [Soya max (L.) Merr.] variety Tanggamus was planted at spacing 20 × 25 cm on May 10, 2010.
In 2008, land was covered with mixture of broadleaf weeds and Imperata cylindrica which left as fallow for a year. The dry matter weed weight was 13.3 Mg ha-1 with C/N 31.9. Weeds prior to
corn crop were sprayed with glyphosate of 4.8 L a.i. ha-1 and mixed with Rhodiamine 1.0 L ha-1 on
August 20, 2009; while weeds prior to soybean season which also dominated by mixture of weeds were sprayed on April 13, 2010 with the same herbicide. The deadly weeds and previous corn stalk residues were used for mulch covering the soil surface of CT, while in IT all deadly above-ground weeds and corn stalk residues were removed. Different from NT in which the soil was not being plowed at all, soil surface of MT was slightly plowed at 0-5 cm depth; while in IT treatment plots were plowed twice at 0-20 cm depth.
Soil C storages in this experiment which measured as soil organic carbon (SOC) were taken on May 10, 2010 (after 23 years of cropping). As reported by Wright and Hons (2004); Blanco-Canqui and Lal (2008); Utomo et al. (2010) that SOC in conservation tillage is mostly observed in the upper layer of soil, therefore, samples in this experiment were taken at depths of 0-5 cm, 5-10 cm and 10-20 cm. Soil organic carbon in all depths were determined with Walkey and Black method (Nelson and Sommers 1984).
In corn season, CO2 measurements were taken throughout the season from 28 August to 10 December 2009. Those measurements were taken before plowing, one day after plowing (1 DAP), 2 DAP, 3 DAP, 20 DAP, 40 DAP, 60 DAP and 80 DAP. In soybean season however, due to technical problem in the field, measurement of CO2 emission in the first 3 days after plowing were not measured. Measurements of CO2 were taken from 11 June to 6 September 2010, those included 20 DAP, 40 DAP, 60 DAP, 80 DAP and 120 DAP. To determine the effect of long-term no-tillage and N fertilization on CO2 emissions in situ, upside down jars with diameters of 12 cm were inserted into plots at 2 cm depth, and small vials with containing 10 mL KOH 0.1N were placed in the jars. Evolved CO2 was corrected for amounts found in the blank jar along with sample measurement. After two hours field measurement which taken at 9 to 11 in the morning and at 3 to 5 in the afternoon, the KOH trap was
titrated with HCl 0.1 N to determine the CO2-C equivalent (Anderson 1984; Anas (1989). To calculate the amount of CO2 evolved from soil trapped by KOH, formula modified by Anas (1989) was used. The data in this paper were expressed as kg CO2-C ha-1 day-1.
Statistical Analysis
Analysis of variance and means test with Honest Significance Different (HSD 0.05) were analyzed using the Statistical Analysis System package (SAS Institute 2003).
RESULTS AND DISCUSSION
Soil Organic Carbon
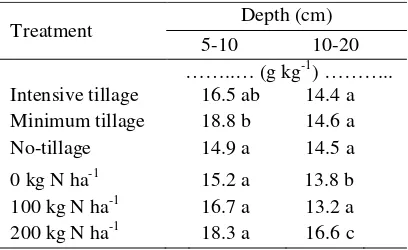
Soil organic carbon (SOC) plays a significant role in agro-ecosystem, due to it is directly related to productivity (Lal 2007; Smith and Collins 2007). After 23 years of cropping, SOC at depth of 0-5 cm was significantly (p < 0.05) affected by tillage, N fertilization and interaction of tillage with N fertilization. Within this upper layer of soil, soil organic C under NT with 200 kg N ha-1 fertilization
was 46.1% higher than NT with no N fertilization, but there were no different than other treatment combinations (Table 1). This finding indicates that NT has ability to increase SOC within the upper layer of soil only if combined with optimum N fertilization. This was attributed to the strong influence both tillage treatment and N fertilization on plant residue decomposition. Every season, previous plant residues in conservation tillage (CT) were used as mulch covering the soil surface. The weight of dry matter weed prior to experiment was 13.3 Mg ha-1 with C-N ratio 31.9. Additions of
2
Plant residues used in CT combined with N fertilization in CT, therefore are important in agriculture, due to could enhance carbon sequestration in agricultural soils.
At a deeper layer however, there was no interaction effect (p<0.05) of tillage and N fertilization on SOC. At depth of 5-10 cm, SOC was only affected by tillage (p<0.05), while at depth of 10-20 cm was only affected by N fertilization (p < 0.05). Regardless of N fertilization, SOC under MT at 5-10 cm depth was 26.2% higher than NT, but only 13.9% higher than IT (Table 2). Because of slightly tilled, the previous plant residues on MT were slightly mixed and caused more contact with soil particles, resulted in more plant residue decomposition rate with respect to MT. On the other hand, because of undisturbed soil surface, the plant residues in NT after one season had not totally decomposed yet. Unpublished data shown that residue decomposition rates for IT, MT, NT were 75%, 67% and 65%, respectively. At a deeper layer, the strong response of SOC to N fertilization was
occurred. Soil organic carbon from 200 kg N ha-1
rate at 10-20 cm depth was 20.9% and 25.8% higher than those of 0 and 100 kg N ha-1 rates, respectively
(Table 3). This obvious response was mainly attributed to the fact that in this depth, the plant residues and soil N content were limited.
Similar study which carried out in Texas also showed that after 20 years of cropping, SOC under NT for all cropping sequence at 0-5 cm depth was 64% greater than IT, but at 5-15 cm depth, it was only 28% greater than IT (Wright and Hons 2004). The higher SOC in the upper soil layer in long-term CT particularly if combined with optimum N rate is in agreement with those reported by researchers in subtropics ecosystem (Zibilske et al. 2002; Al-Kaisi and Yin 2005; Blanco-Canqui and Lal 2008).
Carbon Dioxide Emission
Corn season, 2009. Measurements of CO2 in corn season were taken before plowing (treatment) and after plowing throughout the season from 28 August to 10 December 2009. As those reported by Rastogi et al. (2002) and Al-Kaisi et al. (2008), CO2-C emission in this paper is referred to CO2 regardless of the source of soil CO2.
Prior to experiment, CO2-C emission was not significantly (p<0.05) affected by any treatments. After plowing (treatment), however, CO2-C emissions throughout the corn season were significantly (p<0.05) affected either by tillage or by N fertilization, while at 1 DAP, 40 DAP, 60 DAP and 80 DAP were significantly (p<0.05) affected by interaction of tillage and N fertilization as well. Regardless of N fertilization, average of CO2-C emission from tillage treatment measured before plowing was 3.3 kg CO2-C day-1 ha-1. It appears
that just one day after plowing (1 DAP), CO2-C emission from IT increased sharply to reach maximum magnitude to 14.6 kg CO2-C day-1 ha-1.
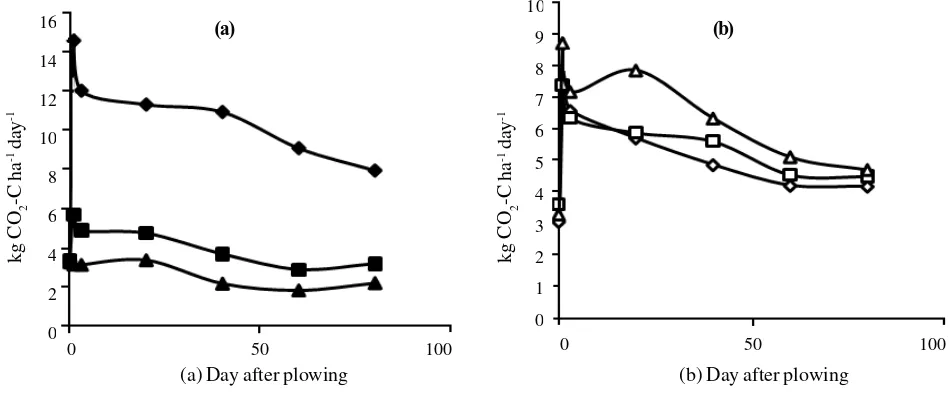
Compared to before plowing, CO2-C emissions from IT and MT were 342% and 67.1% higher, while from NT was only 3.7% lower. Thereafter, CO2-C emission from IT was dropped sharply at 3 DAP and then gradually declining, while from CT was relatively leveled off up to the end of the season (Figure 1a). It turned out that CO2-C emission from IT throughout the season was consistently highest among tillage treatments, while from MT was the intermediate and from NT was the least (Tables 3 and 4). The CO2-C emission averages from IT, MT and NT for one season basis were 11.0, 4.2 and 2.6 kg CO2-C day-1 ha-1, respectively;
with ratios of IT to MT was 2.6 and IT to NT was 4.1.
Table 2. Effect of conservation tillage and N fertilization on soil organic carbon after 23 years of crop season at 5-10 cm and 10-20 cm depth.
Treatment Depth (cm)
5-10 10-20
Values within a column followed by the same letter are not significantly different at 0.05 level by HSD test. Tabel 1. Interaction effect of conservation tillage
and N fertilization on soil organic carbon after 23 years of crop season at 0-5 cm depth.
Tillage treatment N fertilization (kg N ha
-1
J Trop Soils, Vol. 17, No. 1, 2012: 75-84
The higher CO2-C emission with respect to IT was mainly because tillage broke and inverted the soil to allow rapid CO2 loss and O2 entry; and mixed the residues and organic particles that could enhance microbial attack (Reicosky 2001; Rastogi et al. 2002; Smith and Collins 2007). On the other hand, less tillage reduced gas diffusivity and air-filled porosity, and kept soil organic C unexposed (Rastogi et al. 2002). These findings are in agreement with those reported by Reicosky (2001); Desjardins, et al. (2002); La Scala et al. (2005); Brye et al. (2006) that CO2-C emission from IT was significantly higher than CT.
Although not as strong as tillage treatment, N treatment significantly (p<0.05) affected CO2-C emissions. It turned out that CO2-C emissions from 200 kg N ha-1 rate were consistently higher than
Table 3. Effect of long-term conservation tillage and N fertilization on CO2-C emission in corn crop, 2009.
Values within a column followed by the same letter are not significantly different at 0.05 level by HSD test.
Treatment combination
Day after plowing (DAP)
2 3 20
... (kg CO2-C day-1 ha-1) ...
Intensive tillage 14.33 c 11.97 c 11.25 c
Minimum tillage 5.41 b 4.86 b 4.72 b
No-tillage 2.79 a 3.13 a 3.37 a
0 kg N ha-1 7.19 a 6.53 ab 5.68 a
100 kg N ha-1 7.27 a 6.29 a 5.84 a
200 kg N ha-1 8.07 b 7.14 b 7.83 b
Figure 1. Pattern of CO2-C emission in corn season as affected by (a) conservation tillage and (b) N fertilization; = intensive tillage, = minimum tillage, = no-tillage, = 0 kg N ha-1, = 100 kg N ha-1 , and = 200 kg N ha-1.
those of 0 kg N ha-1 and 100 kg N ha-1 rates (Tables
3 and 4). There were two peaks of CO2-C emissions occurred in this emission pattern (Figure 1b). The first peak of CO2–C emission was reached at 1 DAP and the second peak was at 20 DAP. After the second peak, CO2–C emissions from N treatment were gradually declining and ended up with very close magnitude. The averages of CO2-C emission from N0, N1 and N2 treatment for one season basis were 5.4, 5.6 and 6.4 kg CO2-C day-1 ha-1,
respectively; with CO2-C emission ratios of N0 to N1 was 1.0 and N0 to N2 was 0.8.
The significant effect of N fertilization on CO2 -C emissions at the first three days after plowing was associated with residual effect of long-term N fertilization. Residual N has induced microbial activity in the soil that resulted in more CO2-C emission. It can be noted that in this long-term experiment, N treatment has been applied since 1987 (24 years of application). At 20 DAP and the rest of sampling dates, however, higher of CO2-C emissions from higher N rates were attributed to the direct effect of N fertilization on CO2 production. According to Rastogi et al. (2002), and Smith and Collins (2007) application of nitrogenous fertilizer affects CO2-C emission directly by providing nitrogen to crop and microbe for their growths, and indirectly by influencing soil pH. Nitrogen fertilization provided more available N to both crops and microbes that could accelerate root respiration and microbial decomposition of organic matter (Rastogi et al. 2002; Luo and Zhou 2006; Smith and Collins 2007). In fact, root respiration is important contributor to in situ soil respiration; it
16
14
12
10
8
6
4
2
0
10
9
8
7
6
5
4
3
2
1
0
kg CO
2
-C ha
-1 day
-1
kg CO
2
-C ha
-1 day
-1
0 50 100 0 50 100
(a) Day after plowing (b) Day after plowing
2
contributes approximately 50% of the total soil respiration (Rastogi et al. 2002; Luo and Zhou 2006). Previous research carried out by Utomo et al. (2010) showed that N fertilization had increased (p<0.05) microbial biomass C both in rhizosphere and in non-rhizosphere. However, the significant effect of N fertilization on CO2-C emission in corn crop is not in agreement with those reported by Brye et al. (2006) and Al-Kaisi et al. (2008).
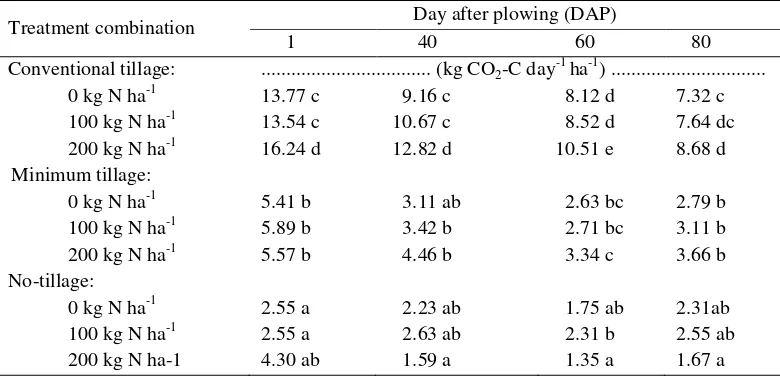
Table 4 shows interaction effect of tillage and N fertilization on CO2-C emissions along the corn season. With residual 200 kg N ha-1, CO
2-C
emission from IT treatment at 1 DAP was the highest (p<0.05) among treatment combinations, while MT with any N rate fertilizations was the second and NT was the lowest CO2-C emission. With any residual N rate treatments, NT and MT respectively reduced CO2-C emission to 84.3% and 66.7% as much of IT. Although the magnitudes were decreasing as a function of after plowing time, CO2 -C emission from combination of IT and N fertilization were still consistently highest among treatment combination at 40, 60 and 80 DAP. With any N rate treatments, NT could reduce CO2-C emission to 75.4%-87.6% as much of IT, while MT could reduce to 65.2 %-67.6% (Table 4). The higher CO2 -C emission with respect to combination of IT and higher N rate was associated with the synergetic effect of tillage and N fertilization treatments. Combination of IT and optimum N rate created a better soil micro climate and available N that could produce more soil CO2 emission. High N content is generally associated with high growth rates, leading to high growth respiration (Luo and Zhou 2006).
Treatment combination Day after plowing (DAP)
1 40 60 80
Conventional tillage: ... (kg CO2-C day-1 ha-1) ...
0 kg N ha-1 13.77 c 9.16 c 8.12 d 7.32 c
100 kg N ha-1 13.54 c 10.67 c 8.52 d 7.64 dc
200 kg N ha-1 16.24 d 12.82 d 10.51 e 8.68 d
Minimum tillage:
0 kg N ha-1 5.41 b 3.11 ab 2.63 bc 2.79 b
100 kg N ha-1 5.89 b 3.42 b 2.71 bc 3.11 b
200 kg N ha-1 5.57 b 4.46 b 3.34 c 3.66 b
No-tillage:
0 kg N ha-1 2.55 a 2.23 ab 1.75 ab 2.31ab
100 kg N ha-1 2.55 a 2.63 ab 2.31 b 2.55 ab
200 kg N ha-1 4.30 ab 1.59 a 1.35 a 1.67 a
Tabel 4. Interaction effect of long-term conservation tillage and N fertilization on CO2-C emission in corn crop, 2009.
Values within a column followed by the same letter are not significantly different at 0.05 level by HSD test.
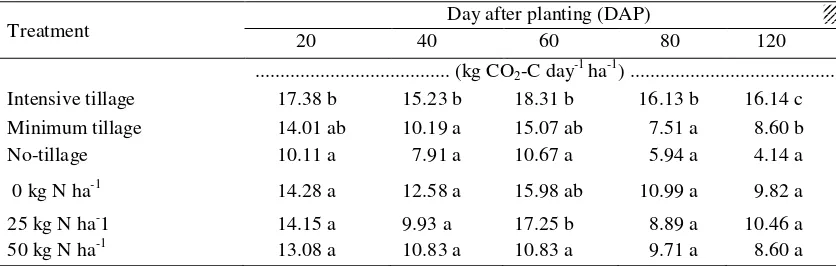
Soybean season, 2010. Measurements of CO2 in situ in soybean season were taken after plowing throughout the season from 11 June to 6 September 2010 at 20 DAP, 40 DAP, 60 DAP, 80 DAP and 120 DAP. Throughout the soybean season, CO2-C emissions were affected (p<0.05) by tillage, but not affected by interaction effects of tillage and N fertilization. While at 60 DAP, CO2-C emission was only affected (p<0.05) by N fertilization.
It was obvious that CO2-C emision from IT throughout the soybean season was consistently higher (P<0.05) than CT (Table 5). At 20 DAP through 120 DAP, NT could reduce 42.0%-74.3% as much CO2-C emission as IT, while MT could reduce only 7.0%-46.7% from IT. In contrast to corn season, however, the effect of N fertilization on CO2–C emission throughout the soybean season was inconsistent as those reported by Brye et al. (2006) and Al-Kaisi et al. (2008). In fact that at 60 DAP, CO2 emision from 50 kg N ha-1 was lowest (p<0.05)
than other treatments, while CO2-C emision from 25 kg N ha-1 was similar to that of without N
fertilization. It turned out that 50 kg N ha-1 could
reduce CO2 to 32.2%-37.2% as much of 0 and 25 kg N ha-1 treatments. The lack response of N
fertilization of N fertilization on CO2-C emission in soybean season was reflected to no interaction effect of tillage and N fertilization treatments on CO2-C emission.
J Trop Soils, Vol. 17, No. 1, 2012: 75-84
occurred. This was due to luxury consumption of N by soil microbes in fact could suppress CO2-C pro-duction (Abro et al. 2011). In nitrogen-sufficient such as in soybean crop season, N fertilization could exacerbate conditions of “nitrogen saturation”, resulting in less soil respiration. Nitrogen fertilization could also decrease phenol oxidase activity by 40% in soil and increase it by 63% in litter. Therefore, condensations of nitrogen rich compounds with phenolics could make soil organic matter more recalcitrant, resulting in decreases of microbial respiration (Luo and Zhou 2006). In contrast to corn season, less response of CO2 gas emission to N fertilization in soybean season was also related to cropping pattern history of this long-term experiment which included soybean into cereal-legume rotation (Utomo et al. 1989). Unpublished data of this experiment supported this finding that there was no significant effect of long-term N fertilization on soybean growth and yield.
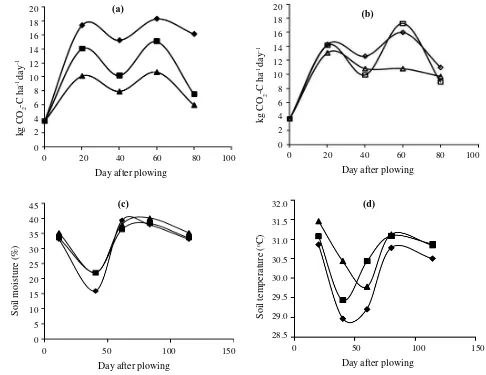
This finding was supported by result from incubation study carried out by Abro et al. (2011) that CO2-C emission was significantly increased at optimum N rate, but declined at higher N rate. The response of CO2-C emissions to tillage and N fertilization are shown in Figure 2a and 2b. The peaks of CO2-C emission due to tillage and N fertilization were occurred at 20 DAP and 60 DAP, while the least of CO2-C emissions occurred at 40 DAP and 80 DAP. These unique responses were related to soil moisture and soil temperature fluctuation along the season (Figures 2c and 2d).
In fact, the fluctuation of CO2-C emissions throughout the season were highly correlated to soil moisture (r = 0.50** to 0.73**) and soil temperature (r = 0.64** to 0.81**). Soil moisture ranges at 2.5 cm depth throughout the season were 15 to 40%
Table 5. Effect of long-term conservation tillage and N fertilization on CO2-C emission in soybean crop, 2010. Values within a column followed by the same letter are not significantly different at 0.05 level by HSD test.
(w/w), and soil temperature ranges were 29.0 to 31.5o C. Such favorable micro climate enhanced
microbial growth, resulted in higher CO2-C emissions.
Although the magnitude was fluctuating, CO2 -C emission from IT in soybean season was consistently higher than that of CT along the season. The CO2-C emission averages from IT, MT and NT for one season basis were 16.8, 11.7 and 8.7 kg CO2-C day-1 ha-1, respectively; with IT to MT ratio
1.4 and IT to NT ratio 1.9. Different to corn season, however, CO2-C emission in soybean was reduced by higher N rate. Carbon dioxide-C emissions average of N0, N1 and N2 treatment were 13.5, 12.6 and 11.1 CO2-C day-1 ha-1, respectively; with N0 to
N1 ratio 1.1 and N0 to N2 ratio 1.2.
CONCLUSIONS
After 23 years of cropping, SOC under NT combined with 200 kg N ha-1 fertilization at depth
of 0-5 cm was 46.1% higher than NT with no N fertilization, while at depth of 5-10 cm, SOC under MT was 26.2% higher than NT and 13.9% higher than IT. At depth of 10-20 cm, soil organic C in 200 kg N ha-1 treatment was 20.3% and 25.8%
higher than those of 0 and 100 kg N ha-1 treatments,
respectively.
Throughout the corn and soybean seasons, CO2-C emissions from IT were consistently higher than CT. In corn season, MT and NT combined with any N rate treatments could reduce CO2-C emission to 65.2 %-67.6% and to 75.4%-87.6% as much of IT, respectively. While throughout the soybean season, MT and NT could reduce CO2-C emission to 17.6%-46.7% and 42.0%-74.3% as much of IT, respectively. Prior to generative soybean growth, 50 kg N ha-1 rate could reduce CO
2
32.2%-37.2% as much of 0 and 25 kg N ha-1 N
rates.
The results suggest that conservation tillage as one of best practices in upland agriculture can strongly contribute to substantial reduction of national GHG emission.
ACKNOWLEDGEMENT
The research was financially supported by Directorate General of Higher Education, Ministry of National Education Republic of Indonesia through Hibah Kompetitif Penelitian sesuai Prioritas Nasional in 2009-2011. Institutional supports from Faculty of Agriculture and Research Institute of Lampung University are also highly acknowledged.
REFERENCES
Abro SA, XH Tian, DH You and XD Wang. 2011. Emission of carbon dioxide influenced by nitrogen and water levels from soil incubated straw. Plant Soil Environ 57 (6): 295-300.
Al-Kaisi and X Yin. 2005. Tillage and crop residue effects on soil carbon dioxide emission in corn-soybean rotation. J Environ Qual 34 (2): 437-445.
Al-Kaisi MM, ML Kruse and JE Sawyer. 2008. Effect of nitrogen fertilizer application on growing season soil carbon dioxide emission in a corn–soybean rotation. J. Environ Qual 37: 325-332.
Anas I. 1989. Biologi tanah dalam praktek. Departemen Pendidikan dan Kebudayaan Direktorat Jenderal Pendidikan Tinggi Pusat antar Universitas Bioteknologi. Institut Pertanian Bogor. 161p (in Indonesian).
Figure 2. Pattern of CO2-C emission in soybean season as affected by conservation tillage (a), N fertilization (b), pattern of soil moisture (c), and soil temperature (d) as affected by conservation tillage; = intensive tillage, = Minimum tillage, = no-tillage, = 0 kg N ha-1, = 25
kg N ha-1 , and = 50 kg N ha-1.
Soil moisture (%)
20 18
16 14
12
10 8
6 4
2
0
0 20 40 60 80 100
Day after plowing
20
18
16 14
12 10
8 6
4 2
0
kg CO
2
-C ha
-1 day
-1
0 20 40 60 80 100
Day after plowing
(a)
(b)
kg CO
2
-C ha
-1 day
-1
Soil temperature (
oC) 45
40
35
30
25
20
15
10
5
0
32.0
31.5
31.0
30.5
30.0
29.5
29.0
28.5
0 50 100 150 0 50 100 150
Day after plowing Day after plowing
J Trop Soils, Vol. 17, No. 1, 2012: 75-84
Anderson JPE. 1984. Soil respiration. Methods of Soil Analysis. Part 2. In: AL Page, RH Miller and DR Keeney (eds). Chemical and Microbial Properties. Second Edition. ASA, SSSA Publisher. Madison, Wisconsin, USA, pp. 831-872.
Blanco-Canqui H and R Lal. 2008. No-till and soil-profile carbon sequestration: an on farm assetment.
Soil Sci Soc Am J 72: 693-701.
Blevins RL, MS Smith and GW Thomas. 1984. Changes in soil properties under no-tillage. In: RE Phillips and SH Phillips (eds). No-tillage Agriculture: Principles and Practices. Van Nostrand Reinold, pp. 190-230.
Boer R. 2010. Strategi Mitigasi Emisi GRK dari Lahan Gambut. Centre for Climate Risk and Opportunity Management in South East Asia and Pacific (CCROM SEAP), Bogor Agriculture University (in Indonesian).
Bono A, R Alvarez, DE Buschiazzo and RJC Cantet. 2008. Tillage effects on soil carbon balance in a semiarid agroecosystem. Soil Sci Soc Am J 72: 1140-1149.
Brito-Vega H, D Espinosa-Victoria, C Fragoso, D Mendoza, NDC Landaro and AA Chavez. 2009. Soil organic particle and presence of earthworm under different tillage systems. J Biol Sci 9: 180-183.
Brye KR, DE Longer and EE Gbur. 2006. Impact of tillage and residue burning on carbon dioxide flux in a wheat-soybean production system. Soil Sci Soc Am J 70: 1145-1154.
Desjardins RL, W Smith, B Grant, C Campbell, H Janzen and R Riznek. 2002. Management Strategies to Sequester Carbon in Agricultural Soils and to Mitigate Greenhouse Gas Emissions. International Workshop on Reducing Vulnerability of Agriculture and Forestry to Climate Variability and Climate Change. Ljubljanu, Slovenia, October 7th – 9th, 2002
Eggleston S, L Buendia, K Miwa, T Ngara and K Tanabe. 2006. IPCC guidelines for national greenhouse gas inventories. Technical Report. IPCC.
Haile-Mariam S, HP Collins and SS Higgins. 2008. Greenhouse gas fluxes from an irrigated sweet corn (Zea mays L.)–potato (Solanum tuberosum L.) rotation. J Environ Qual 37: 759-771.
IPCC [Intergovernmental Panel on Climate Change]. 2006. Guidelines for national greenhouse gas inventories. IPCC/IGES, Hayama, Kanagawa, Japan.
La Scala, ND Bolonhezi and GT Pereira. 2005. Short-term soil CO2-C emission after conventional and reduced tillage of a no-till sugar cane area in southern Brazil. Soil Till Res 91 (1-2): 244-248. Lal R. 2007. Soil carbon sequestration to mitigate climate
change and advance food security. Soil Sci 32 (12): 943-956.
Lavelle P. 1984. The soil system in the humid tropics. Biology International IUBS, pp. 1-17.
Lou Y and X Zhou. 2006. Soil Respiration and the Environment. Academic Press. Burlington, MA, USA/Elsevier, Inc. 316p
Nelson DW and LE Sommers. 1984. Total carbon, organic carbon, and organic matter. Methods of Soil Analysis. Part 2. In: AL Page, RH Miller and DR Keeney (eds). Chemical and Microbial Properties. Second Edition. ASA, SSSA Publisher. Madison, Wisconsin, USA, pp.539-580.
Paustian K, CV Cole, D Sauerbeck and N Sampson. 2004. Agricultural mitigation of greenhouse gases: science and policy options. Council on Agricultural Science and Technology (CAST) Report, R141 2004, ISBN 1-887383-26-3, 120p
Pretty JN and AS Ball. 2001. Agricultural influences on carbon emission and sequestration: a review of evidence and emerging trading options. Centre for Environment and Society Occasional Paper 2001-03. University of Essex, 30p.
Rastogi M, S Singh and H Pathak. 2002. Emission of carbon dioxide from soil. Current Science 82 (5): 510-517.
Reicosky DC. 2001. Effects of conservation tillage on soil organic carbon dynamics: field experiment in the U.S. Corn Belt. In: DE Scott, RH Mohtar and GC Steinhart (eds). Sustaining the Global Farm. Purdue University and the USDA-ARS National Soil Erosion Research Laboratory, pp. 481-485.
SAS [Statistical Analysis System] Institute. 2003. The SAS system for windows. Release 9.1. SAS Inst.Inc., Cary, NC.
Sedjo R, B Sohngen and P Jagger. 1998. Carbon sinks in post-Kyoto world. Internet Edition.Resources for the Future. Washington DC.
Six J, SM Ogle, FJ Breidt, RT Conant, AR Mosier and K Paustian. 2004. The Potential to mitigate global warming with no-tillage management is only realized when practised in the long term. Global Change Biology. 10p.
Smith JL and HP Collins. 2007. Management of organisms and their processes in soils. In: EA Paul (ed). Soil Microbiology, Ecology and Biochemistry.
Third Edition. Academic Press, Burlington, USA, 532 p.
Smith KE. 2010. Effect of elevated CO2 and agricultural management on flux of greenhouse gases from soil.
Soil Sci 175 (7): 349-356.
Unger PW. 1991. Organic matter, nutrient and pH distribution in no- and conventional tillage semiarid soils. Agron J 83: 186-189.
2
Utomo M. 2004. Olah tanah konservasi untuk budidaya jagung berkelanjutan. Prosiding Seminar Nasional IX Budidaya Pertanian Olah Tanah Konservasi. Gorontalo, 6-7 Oktober, 2004, pp.18-35 (in Indonesian).
Utomo M, A Niswati, Dermiyati, MR Wati, AF Raguan and S Syarif. 2010. Earthworm and soil carbon sequestration after twenty one years of continuous no-tillage corn-legume rotation in Indonesia. JIFS
7: 51-58.
Wright AL and FM Hons. 2004. Soil aggregation and carbon and nitrogen storage under soybean cropping sequences. Soil Sci Soc Am J 68: 507-513. Zibilske LM, JM Bradford and JR Smart. 2002.
Conservation tillage induced change in organic carbon, total nitrogen and available phosphorus in a semi-arid alkaline subtropical soil. Soil Till Res