Surveying In-service Teachers about
Knowledge-Based Teacher, Engagement, and Expectation in
Teacher Profession Education Program in
Indonesia: Integrating Factor Analysis with Rasch
Modeling
Patuan Raja1, Abdurrahman Abdurrahman2*, and Ag. Bambang Setiyadi1 1English Education Study Program, Faculty of Teacher Training and Education,
University of Lampung, Jl. Sumantri Brojonegoro No. 1, Lampung 35144, Indonesia
2Science Education Graduate Program, Faculty of Teacher Training and Education,
University of Lampung, Jl. Sumantri Brojonegoro No. 1, Lampung 35144, Indonesia
Abstract. This paper reported the use of several quantitative analytic methods, including Rasch analysis, to examine teacher responses to questionnaire items probing opinions related to knowledge-based teacher, engagement, and expectation in Teacher Profession Education Program in Indonesia. While many reports have presented the impact of training-based teacher professional development program in Indonesia, the present paper improved on these outcomes by utilising Rasch analysis to identify items with orderly sequences of scores across response categories, and to subject these to fresh exploratory and confirmatory factor analysis. The resulting 3-factors (teacher knowledge, teacher engagement, teacher expectation) scale proved acceptable in terms of confirmatory factor analysis as well as in terms of Rasch item analysis. Furthermore, the paper briefly discussed the implications of these outcomes in relation to the refined instrument’s capacity to gather information about how teachers view and expectation about the Indonesian Teacher Profession Program, including gender disparity analysis.
1. Introduction
Over the past decade, there has been a dramatic increase in research on teacher professional development (TPD) program. Even today it has become a global agreement that teacher effectiveness has become the top of the education policy agenda criteria, because many countries have become convinced that teaching is one of the most important factors related to school especially in student achievement [1, 2]. In addition, teacher preparation and development are the key to developing effective teachers across the world [3]. For example, the State of Finland has strengthened a high quality education system that is equitable by establishing a quality teaching profession where all teachers hold at least a 2-year master's degree which includes mastery of strong subject matter content and mature pedagogical preparation, and is integrated in research and successful practice. The impact is that teaching has become the most sought after profession, and many teachers continue their studies to pursue PhD degrees and then remain teachers. In one generation, Finland jumped from relatively low-educated countries to the current literacy rate of 96%, with high graduation and college levels and top scores in all fields of PISA assessment [3,4,5]. Likewise with other great countries such as the United States, Britain, Australia, Canada, Singapura, and others, they already have a very massive teacher development professional development system and model [6,7,8,3].
the impact of teacher certification in developing countries on student performance is very rarely found in literature. One of the research result about quality teacher in Indonesia revealed that the teacher certification program in Indonesia has not seriously impacted the improvement of student learning outcomes, so TPD models are needed that are more effective in equipping teachers to be competent in all their professional duties [12]. In the context of preparing professional teachers in Indonesia, currently the teacher professional education program (PPG) has been implemented in the form of professional teacher learning to improve teacher knowledge and skills in supporting increasingly complex skills that students need to learn in preparation for further education and work in the 21st century. Sophisticated forms of teaching are needed to develop student competencies such as deep mastery of challenging content, critical thinking, complex problem solving, effective communication and collaboration, and self-direction. Thus, an effective teacher professional development model is needed to help teachers learn and refine the pedagogical knowledge and skills needed to teach these skills [13]. However, many studies show that the TPD initiative model that emerges is not effective in supporting changes in teacher learning practices and student learning outcomes. The causes are very diverse why the TPD implementation process is not successful including the implementation of TPD has not been based on an analysis of teacher needs, initial knowledge, the involvement of teachers in the previous TPD, and the teacher's expectations in developing himself as a professional teacher. While the entire domain of professional knowledge, professional practice and professional involvement, as well as the teacher's expectations about professional development greatly determine the success of the implementation of the teacher professional education program [14, 3, 15]. In addition, it is very important to understand the teacher's perspective on their teacher preparation program so that the TPD works well [16,17]. While [18] found a relationship between teacher perceptions of teacher preparation programs and their effectiveness as professional teachers. Furthermore, [18] notes that although a teacher's feelings for their preparation may not reflect their actual classroom practice, their preparation is highly correlated with teacher self-efficacy, which is also highly correlated with student achievement. The definition of results in teacher education programs and the ability to measure these correlations is very important to assist in the process of reform and policy making in teacher education [19]. This stage is even more important for the current education administration system that seeks to support their current teachers, beginning with understanding their preparation to play an active role in the overall professional development of teachers [20].
This study examines the general set structure of the 30 items that we have developed. This survey involved 234 respondents as participants in the teacher professional education program at one of the state universities in the province of Lampung, Indonesia. This survey aims to examine whether the general items for the teacher preparation perception survey in this position function in an equivalent manner. This analysis provides an exploration of the constructs we made and ways to verify whether this construct is the same across groups of teacher categories such as age, length of teaching, gender, and teacher school graduates. But an exploratory in-depth analysis using Rasch models focuses on differences in gender views about the adequacy of teacher knowledge (content and pedagogy), teacher involvement in professional development, and teacher expectations for teacher development programs.
.
2. Method
Participants
Table 1. Description of the Samples
Variable Participants
Sex n %
Male 49 20.94
Female 184 79.16
Age
Mean 42.98 SD 11.12 Graduation
Public Teacher Education 154 Private Teacher Education 80 Length of Teaching
Mean 20.07 SD 11.10
Instrument and Procedure
The survey, as described above, was created via literature review and a comprehensive analysis of sources of standards for teacher preparation, to define three competency areas [21], with one additional area suggested by an advisory panel. Items were written by project personnel and vetted through teacher education program coordinator and a peer advisory professor. After modifications based on a series of cognitive interviews, the survey was approved by a panel of deans of colleges of education in the college. The body of the survey for teacher candidates was split into three sections, with each section eliciting views about an area of teaching competency, engagement in TPD, and expectation about TPD. In total, the survey of in-service teacher profession education contained 30 perceive items which reflected overall satisfaction with the program. The survey sent to in-service teacher students of TPD in Lampung University was divided into the same three competency areas. Then, participants response the survey through a google form online link.
Analysis
Rasch reliability index, along with Rasch estimates of item difficulties and people's abilities, is based on linear size rather than raw or ordinal data and is more suitable for subsequent parametric
calculations of mean and standard deviation [28]. Finally, Differential Item Functional Analysis (DIFF) was used to conduct the analysis of the differences of each item response toward the differences of gender.
3. Result and Discussion
Based on the results of research conducted, the data obtained were analyzed using the Rasch Model using the Winstep 3.73 application. Winstepor checks the average score per item and response category [29]. The research instrument was tested on 234 PPG students. The research instrument is a scaled data that measures three aspects, namely the teacher's perception of his ability, activities to improve professionalism, and expectations for professional development. The instrument tested was 30 items, each aspect had 10 question items.
A research instrument that can be used correctly has good validity and reliability, the instrument can be accessed with indicators that will be achieved. The results of the analysis obtained that 30 reliable questions with Cronbach alpha value of 0.95 were included in the category of questions with very good reliability. Cronbach's alpha value to measure reliability is the interaction between the same person and item in Table 2 and Table 3.
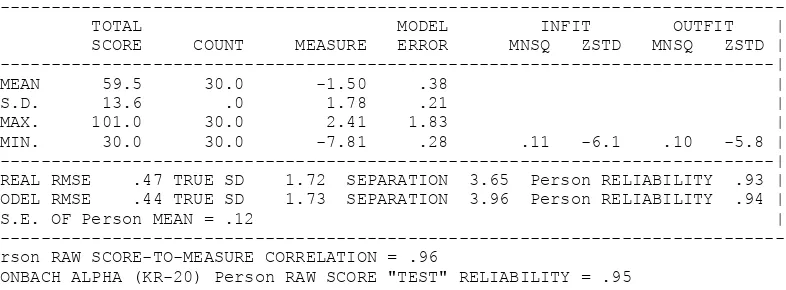
Table 2. People's Reliability
---| TOTAL MODEL INFIT OUTFIT ---| | SCORE COUNT MEASURE ERROR MNSQ ZSTD MNSQ ZSTD | |---| | MEAN 59.5 30.0 -1.50 .38 | | S.D. 13.6 .0 1.78 .21 | | MAX. 101.0 30.0 2.41 1.83 | | MIN. 30.0 30.0 -7.81 .28 .11 -6.1 .10 -5.8 | |---| | REAL RMSE .47 TRUE SD 1.72 SEPARATION 3.65 Person RELIABILITY .93 | |MODEL RMSE .44 TRUE SD 1.73 SEPARATION 3.96 Person RELIABILITY .94 | | S.E. OF Person MEAN = .12 | ---Person RAW SCORE-TO-MEASURE CORRELATION = .96
CRONBACH ALPHA (KR-20) Person RAW SCORE "TEST" RELIABILITY = .95
Table 1 shows that the research instrument has a value of person reliability of 0.93 (Sumintono & Widhiarso, 2015), meaning that the instrument is in a very good category. This shows that the respondent answered the whole item earnestly and not carelessly.
Table 3. Reliability items
--- ---| TOTAL MODEL INFIT OUTFIT ---| | SCORE COUNT MEASURE ERROR MNSQ ZSTD MNSQ ZSTD | |---| | MEAN 463.9 234.0 .00 .12 .99 -.2 1.00 -.1 | | S.D. 42.3 .0 .63 .01 .27 2.6 .28 2.4 | | MAX. 559.0 234.0 1.05 .13 1.58 5.2 1.68 6.0 | | MIN. 398.0 234.0 -1.34 .11 .62 -4.2 .62 -3.8 | |---| | REAL RMSE .13 TRUE SD .62 SEPARATION 4.75 Item RELIABILITY .96 | |MODEL RMSE .12 TRUE SD .62 SEPARATION 4.99 Item RELIABILITY .96 | | S.E. OF Item MEAN = .12 |
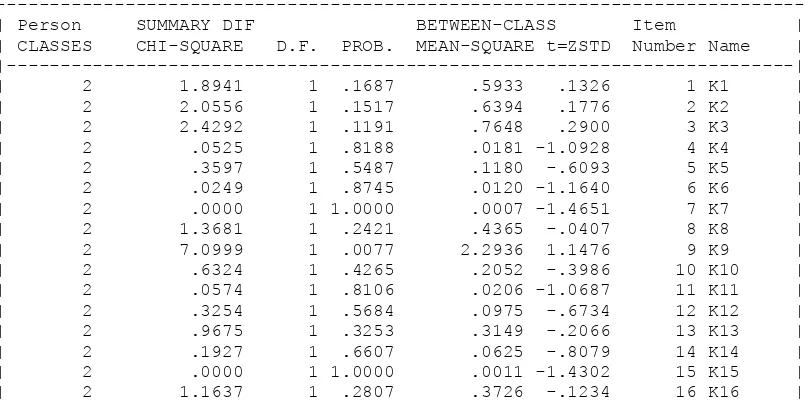
In addition, good instruments are instruments that do not contain bias. The instrument is said to be biased when there is one individual with certain characteristics more advantageous than an individual with other characteristics. For example, instruments are more easily answered by male students than females, this indicates the existence of gender-biased items. Detection of the overall bias items can be seen in Table 4 and Figure 1.
Table 4. Differential Item Function (DIF)
---| Person SUMMARY DIF BETWEEN-CLASS Item ---| | CLASSES CHI-SQUARE D.F. PROB. MEAN-SQUARE t=ZSTD Number Name | |---| | 2 1.8941 1 .1687 .5933 .1326 1 K1 | | 2 2.0556 1 .1517 .6394 .1776 2 K2 | | 2 2.4292 1 .1191 .7648 .2900 3 K3 | | 2 .0525 1 .8188 .0181 -1.0928 4 K4 | | 2 .3597 1 .5487 .1180 -.6093 5 K5 | | 2 .0249 1 .8745 .0120 -1.1640 6 K6 | | 2 .0000 1 1.0000 .0007 -1.4651 7 K7 | | 2 1.3681 1 .2421 .4365 -.0407 8 K8 | | 2 7.0999 1 .0077 2.2936 1.1476 9 K9 | | 2 .6324 1 .4265 .2052 -.3986 10 K10 | | 2 .0574 1 .8106 .0206 -1.0687 11 K11 | | 2 .3254 1 .5684 .0975 -.6734 12 K12 | | 2 .9675 1 .3253 .3149 -.2066 13 K13 | | 2 .1927 1 .6607 .0625 -.8079 14 K14 | | 2 .0000 1 1.0000 .0011 -1.4302 15 K15 | | 2 1.1637 1 .2807 .3726 -.1234 16 K16 |
---| Person SUMMARY DIF BETWEEN-CLASS Item ---| | CLASSES CHI-SQUARE D.F. PROB. MEAN-SQUARE t=ZSTD Number Name | |---| | 2 .0383 1 .8448 .0172 -1.1028 17 K17 | | 2 .3178 1 .5729 .1034 -.6543 18 K17 | | 2 .5996 1 .4387 .1902 -.4300 19 K19 | | 2 .1478 1 .7007 .0475 -.8816 20 K20 | | 2 .5754 1 .4481 .1901 -.4302 21 K21 | | 2 .1443 1 .7041 .0422 -.9114 22 K22 | | 2 .2432 1 .6219 .0724 -.7659 23 K23 | | 2 .0401 1 .8413 .0125 -1.1575 24 K24 | | 2 .2254 1 .6350 .0667 -.7895 25 K25 | | 2 .3725 1 .5417 .1121 -.6270 26 K26 | | 2 2.7494 1 .0973 .8821 .3846 27 K27 | | 2 2.9040 1 .0884 .9308 .4213 28 K28 | | 2 .1096 1 .7406 .0365 -.9461 29 K29 | | 2 1.5756 1 .2094 .5259 .0623 30 K30 |
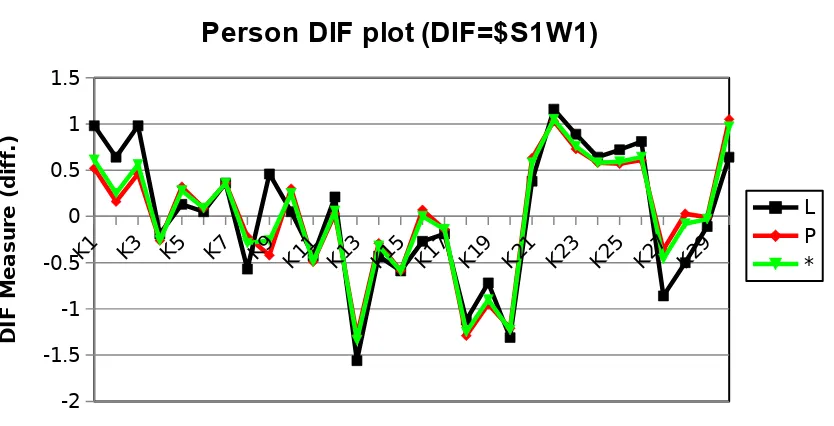
K1 K3 K5 K7 K9 K11 K13 K15 K17 K19 K21 K23 K25 K27 K29
-2 -1.5 -1 -0.5 0 0.5 1 1.5
Person DIF plot (DIF=$S1W1)
L P *
Item
D
IF
M
e
a
s
u
re
(
d
if
f.
)
Figure 1. Person DIF Plot
Figure 1 shows there are three curves based on the sex of the student, namely L (male), P (female), and * (star) indicates the average value. From the graphic above, it can be seen in the K9 instrument that the ability of men to make learning media (including ICT-based) so that students can learn well, the knowledge L (Male) gained while studying was higher than that of P (Female). To find out specifically about the existence and absence of item bias in each aspect, namely the teacher's perception of their abilities, activities to improve professionalism, and expectations for professional development can be seen in Table 5, Table 6, and Table 7.
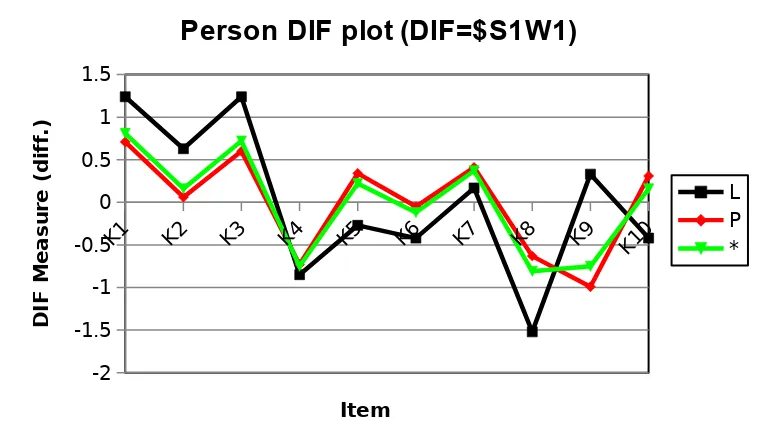
Table 5. DIF Teachers' Perceptions of Their Capabilities
---| Person SUMMARY DIF BETWEEN-CLASS Item ---| | CLASSES CHI-SQUARE D.F. PROB. MEAN-SQUARE t=ZSTD Number Name | |---| | 2 1.4788 1 .2240 .4643 -.0073 1 K1 | | 2 1.7186 1 .1899 .5336 .0707 2 K2 | | 2 2.1485 1 .1427 .6781 .2138 3 K3 | | 2 .0799 1 .7774 .0261 -1.0206 4 K4 | | 2 2.0099 1 .1563 .6469 .1847 5 K5 | | 2 .7432 1 .3886 .2375 -.3362 6 K6 | | 2 .3029 1 .5821 .0995 -.6671 7 K7 | | 2 4.7052 1 .0301 1.5060 .7816 8 K8 | | 2 8.7709 1 .0031 2.8505 1.3579 9 K9 | | 2 2.8058 1 .0939 .9039 .4011 10 K10 |
K1 K2 K3 K4 K5 K6 K7 K8 K9 K10
Figure 2. Person DIF Plot of Teacher's Perception of Their Cavability
Rasch Model analysis to measure aspects of teacher perceptions of their abilities, activities to improve professionalism, and expectations of professional development are used Mean Square values of Infit and Oufit as presented in Figure 4, Figure 5, and Figure 6.
1 2 3 4 5
Figure 4. Chart of Infit and Outfit measure per item Teacher's Perception of Their Capabilities
Figure 4, shows that the mean square fit values for infit and outfit per item all occupy a range of values from 0.5-1.7 where the item is not too difficult and not too easy [31,32]. The response category is based on the teacher's perception of his ability, there is no 100% who respond strongly or disagree. Based on the results of the study using Rasch Model analysis, in this study using confirmatory factor analysis that will optimize the results of the solution factors. Of the 10 items used to measure teacher perceptions of their abilities, it was found that all items had a high level of suitability based on the Rasch Model analysis.
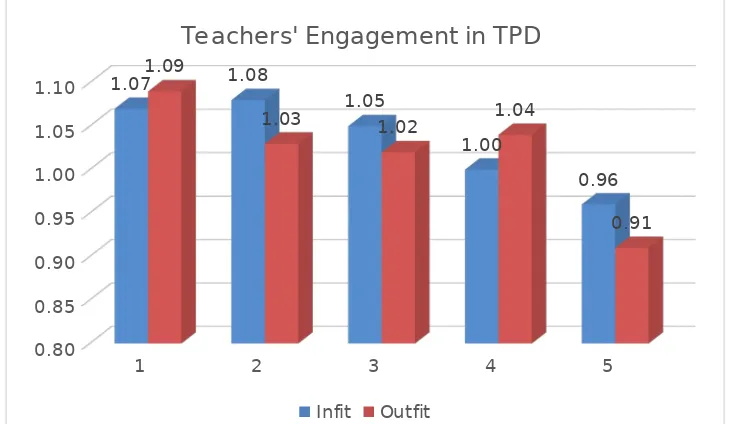
Figure 5. Chart of Infit and Outfit measure per Activity Item to Improve Professionalism
are based on activities to improve professionalism, there are no 100% who respond strongly or disagree. The results of the study using Rasch Model analysis, where in this study using confirmatory factor analysis that will optimize the results of the solution factor. Of the 10 items used to measure activities to improve professionalism, it was found that all items had a high level of suitability based on the Rasch Model analysis.
1 2 3 4 5
0.00 0.20 0.40 0.60 0.80 1.00 1.20 1.40 1.60 1.80
1.51
1.19 1.22 1.18
0.86 1.64
1.27 1.22
1.15
0.87
Teachers' Expectation toward TPD
Infit Outfit
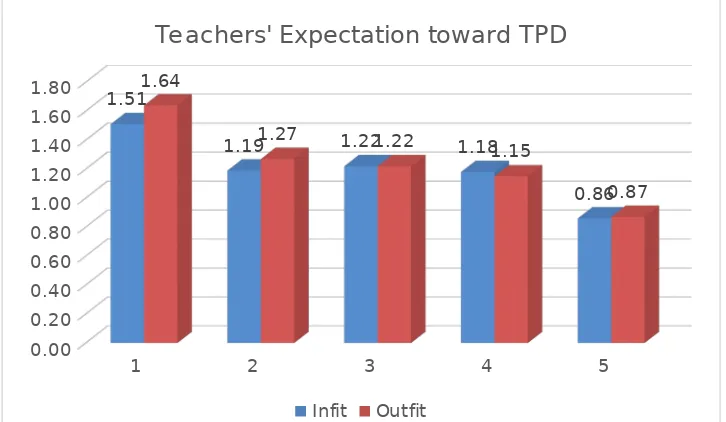
Figure 6. Chart of Infit and Outfit measure per item of Expectation for Professional Development
Figure 6, shows that the mean square fit values for infit and outfit per item all occupy a value range from 0.5-1.7 where the item is not too difficult and not too easy [31,32]. Response categories are based on expectations for developing professionalism, there is no 100% who respond strongly or disagree. Based on the results of the study using Rasch Model analysis, in this study using confirmatory factor analysis that will optimize the results of the solution factors. Of the 10 items used to measure expectations for developing professionalism, it was found that all items had a high level of suitability based on Rasch Model analysis.
Based on the research that has been done it is found that the data that has been analyzed using Rasch and confirmatory factor analysis has produced an instrument with a statistically and conceptually elegant factor structure, and can be used for teacher surveys. This is consistent with research conducted by [33] which states that the resulting factors proved acceptable in terms of exploratory factor analysis and confirmation and in terms of analysis of Rasch items so that teachers see the reporting system numerical Queensland.
4.
Conclusiondeveloping ICT-based learning. PCK aspects of items. Furthermore, the analysis of gender differences using Differential Item Functioning (DIFF) shows that male teachers are better prepared for ICT than female teachers, but female teachers are superior in motivation to be actively involved in each TDP program. However, there was almost no significant difference between male teachers and female teachers about their perspectives on expectations in the TDP, all respondents wanted a more intensive and effective professional coaching process so that they achieved adequate competency.
5.
AcknowledgmentsWe gratefully acknowledge valuable assistance from the members of the PPG Management Faculty of Teacher Training and Education University of Lampung that were involved in our study. Besides, this work is supported by the grant research from Faculty of Teacher Training and Education, University of Lampung 2018.
6. References
[1] OECD (Organization for Economic Cooperation and Development) 2016. Education at a Glance 2016. OECD Indicators (Paris: OECD Publishing)
[2] Holtsch D, Hartig J and Shavelson, R 2018 Vocations and Learning1 (24)
[3] Darling-Hammond L 2017 European Journal of Teacher Education40:3 pp 291-309 [4] Jenset I. S, Klette K, and Hammerness K 2018 Journal of Teacher Education69(2) pp 184-197
5] Nissinen K, Ólafsson RF, Rautopuro J and Vettenranta J 2018. Northern Lights on TIMSS and PISA 2018, p183
[6] Gitomer D 2007 Teacher Quality in a Changing Policy Landscape: Improvements in the Teacher Pool (Princeton: Educational Testing Service)
[7] Campbell C L, K Zeichner, A L Leiberman, P A Osmond-Johnson, J Hollar, S Pisani and J S Oh 2017 Empowered Educators in Canada: How High-performing Systems Shape Teaching Quality. (San Francisco: Jossey-Bass)
[8] Darling-Hammond L, S P Newton, and R C Wei 2013 Educational Assessment, Evaluation and Accountability25(3) pp 179–204
[9] Harris DN and Sass T R 2009 The Journal of the Association for Public Policy Analysis and Management 28(1) pp 55-80
[10] Darling-Hammond L, Berry B and Thoreson A 2001Educational Evaluation and Policy Analysis 23(1) pp.57-77
[11] Jepsen C and Rivkin S 2009 Journal of human resources 44(1) pp 223-250
[12] Rahman B, Abdurrahman A, Kadaryanto B and Rusminto NE 2015 Australian Journal of Teacher Education 40(11) n11
[13] Darling-Hammond L, Hyler, M E and Gardner M 2017 Effective teacher professional development (Palo Alto: Learning Policy Institute)
[14] OECD (Organization for Economic Cooperation and Development) 2011 Building a Teaching Profession: Lessons from around the World (Paris: OECD Publishing)
[15] Kiemer K, Gröschner A, Kunter M, and Seidel T 2018 European Journal of Psychology of Education 33(2) pp 377-402
[16] Donovan C, Green KE, and Seidel K 2017 Leadership and Research in Education 4(1) pp 27-54 [17] van der Lans RM, van de Grift W J, and Van Veen K 2018 The journal of experimental
education 86(2) pp 247-264
[18] Darling-Hammond L 2006 Educational Researcher 35(7) pp 13–24.
[19] Perryman J, Ball SJ, Braun A, and Maguire M 2017 Journal of Education Policy 32(6) pp 745-756
[21] Chval K, Abell S, Pareja E, Musikul K, and Ritzka G 2008) Eurasia Journal of Mathematics, Science & Technology Education 4(1)
[22] Rasch G 1980 Probabilistic models for some intelligence and attainment tests (Expanded ed.). (Chicago: University of Chicago Press)
[23] Bond T G, and Fox C M 2007 Applying the Rasch model (2nd Ed) (Mahwah: Lawrence Erlbaum Associates)
[24] Wright BD and Stone MH 2004 Best test design (Chicago: MESA Press) [25] Wright BD and Masters G 1982 Rating scale analysi (Chicago: MESA Press) [26] Linacre JM 2010. A user’s guide to winsteps ministep 3.70.0: Rasch-model
computer programs (Chicago: Winsteps)
[27] Smith E V Jr 2001 Journal of Applied Measurement2 pp 281–311.
[28] Merbitz C, Morris J, and Grip J C Archives of Physical Medicine and Rehabilitation70(4) 308 [29] Linacre JM 2004 WINSTEPS Rasch measurement computer program (Version 3.53) [Computer
software] (Chicago: Winsteps.com)
[30] Suminton B and Widhiarso W 2015 Rasch Modeling Application on Educational Assessment. (Cimahi: Trimkomunikata)
[31] Smith R M Schumacker RE and Bush M 1998 Journal of Outcome Measurement 2 pp 66-78 [32] Wright B D and Linacre J M 1994 RaschMeasurement Transactions 6205.