NUTRITION AND HEALTH STATUS AND COGNITIVE PERFORMANCE OF
SCHOOL CHILDREN IN JAKARTA AND TANGERANG RECEIVING
WORLD FOOD PROGRAM – NUTRITION REHABILITATION
PROGRAMME (WFP-NRP)
*Siti Muslimatun1; Umi Fahmida1; Dadi Hidayat Maskar1; Maria Chatarina Phan Ju Lan2 dan Keiko Izushi2
1SEAMEO TROPMED Regional Centre for Community Nutrition, University of Indonesia, Jakarta 2WFP Indonesia, Jakarta
*The study was funded by the World Food Programme Indonesia
ABSTRAK
UN World Food Programme (WFP) melalui Nutrition Rehabilitation Programme (NRP) melakukan inisiasi pemberian makanan tambahan pada anak sekolah tahun 2004 dengan mendistribusikan biskuit yang difortikasi 9 vitamin dan 4 mineral di sekolah dasar di lingkungan penduduk miskin di Jakarta dan Tangerang. Untuk menilai dampak dari program ini dilakukan evaluasi perubahan status gizi dan kesehatan dan juga pengaruhnya pada asupan gizi serta kognitif dari anak setelah satu tahun pelaksanaan program. Data dari 691 anak (335 laki-laki, 356 perempuan) diperoleh dari Jakarta Barat (N=243), Kota Tangerang (N=81) dan Kabupaten Tangerang (N=367). Sebagian anak merasakan lapar pada waktu sekolah dan lebih dari 80% sangat senang untuk mendapat biscuit setiap hari. Ditemukan 70% anak dapat menghabiskan 1 pak, 20% anak menghabiskan ½-1 pak, 10% <½ pack pak biskuit dengan asupan zat besi, zink, kalsium dan vitamin yang lebih tinggi dari biasanya. Dibanding dengan data dasar, terlihat terjadi penurunan prevalensi anemia dari 23,9% menjadi 10% dan cadangan besi yang rendah dari 25,7% menjadi 19,6%, serta untuk anak-anak di kabupaten Tangerang berkurangnya keluhan sakit. Nilai rata-rata kognitif anak yang dinilai berdasarkan % nilai maksimum membaik untuk semua aspek (seperti: kemampuan berbahasa, kemampuan memberikan alasan, penglihatan, konsentrasi, menghafal dan mengingat) untuk anak di kabupaten Tangerang, demikian juga di Jakarta Barat dan Kota Tangerang kecuali untuk kemampuan memberikan alasan dan mengingat. Dari studi ini dievaluasi bahwa prevalensi gizi kurang tidak berubah (21.8% Jakarta Barat, 23.5% Kota Tangerang, 39.0% kabupaten Tangerang). Hasil temuan lainnya adalah pengetahuan anak untuk kesehatan dan gizi masih belum baik dan prevalensi kecacingan yang masih 30% di kabupaten Tangerang. Direkomendasikan agar partisipasi institusi terkait perlu dioptimalkan untuk meningkatkan pendidikan atau pengetahuan tentang kesehatan dan gizi kepada guru sekolah, penjaja makanan di sekolah dan juga sosialisasi untuk orang tua murid. Keberadaan materi penyuluhan atau pendidikan tentang pentingnya fasilitas sanitasi serta program kecacingan juga akan dapat meningkatkan keefektifan program.
Keywords:
INTRODUCTION
Four of the eight Millennium Development Goals endorsed in year 2000 are linked tightly with access to basic education, particularly for girls; i.e. improve maternal health, reduce child mortality, promotion of gender equity and women
services within school health program. The framework identifies four core components to be made available in all schools: policy, school environment, education and services (Bundy, 2005). The Food for Education initiated by the World Food Programme is one initiative for achieving ‘Education for All’ of the MDGs.
School feeding program is a common strategy for improving the nutritional status of school children as well as for improving school attendance, performance and learning capability. The food provided may be in the form of main meal (breakfast or lunch), snacks, milk or biscuits.
With the objective to improving the nutritional status of school children, the World Food Programme (WFP) initiate the WFP Nutrition Rehabilitation Program (NRP) through Primary Schools in October 2004 by distributing fortified biscuits to primary school children in selected poor communities of Jakarta and Tangerang. The biscuit is fortified with 9 vitamins (vitamin A, B1, B2, B6, B12, D, E, niacin and folic acid) and 5 minerals (iron, zinc, iodine, selenium and calcium). Provision of fortified biscuits will increase energy, protein and micronutrient intake of school children. Nutrition and health education is intended to be included as an integral part of the fortified biscuits provision.
A baseline study on the nutritional and health status of the children had been conducted prior to the implementation of the NRP in 14 schools in West Jakarta, East Jakarta, Tangerang city and Tangerang district in September – December 2004. The results indicated that the nutrition and health status of the children was low. The prevalence of underweight (29.6%), stunting (30.8%) and anaemia (16.4%) were high. Cognitive performance was low particularly in relation to short term memory and concentration. The food intake of the children was inadequate both qualitatively and quantitatively; around 40% of the children could not meet the 100% RDA (Recommended Dietary Allowance) for energy and protein and more than 80% for almost all micronutrients. Poor nutritional status was associated with sex, worm
infestation and socio economic condition of the parents. Tangerang district was in the availability of basic school activity (SEAMEO TROPMED, 2005).
A formative evaluation survey was conducted to evaluate the nutritional status, health status and cognitive performance of the children after 1 year program implementation.
MATERIALS AND METHODS
Study design and population under study
A repeated cross sectional study (one-group pretest-posttest design study) was carried out to assess the effect of the program on the nutritional status, iron status, cognitive performance, nutrition knowledge and dietary intake of the target beneficiaries. The use of a repeated cross sectional study (one-group pretest-posttest design study), instead of intervention study with control group, was justified considering that (1) the purpose of the study was to assess the development of process indicators of an intervention and (2) budget constraint.
assessment, schools received fortified biscuit.
Sample size
The prevalence of anaemia was used as the basis of sample size calculation to measure the effect of consumption of fortified biscuit. To estimate the prevalence of anaemia 16.4% and underweight 29.6%, with degree of error 5%, confidence interval 5% and 10% allowance, the number of children required in the study was 352. Cognitive performance was measured among children in grade 5 and 6 (who were previously in grade 4 and 5), which means one third of the total sample.
All children participated in the baseline study who were in the school were included in the study. In addition, the number of sample size in each school was maintained to be similar to the baseline study: i.e. 40 children in each school. Therefore, a random selection from the remaining children in each grade was employed to maintain the number of subjects in each grade between 6 and 7.
Sampling procedure
Sampling procedure used school as the basis. The schools and school children included in the study were the same as school children from baseline study. Children from grade 6 had graduated and therefore were replaced, and the new students from grade 1 were included. The selection of children was random from each grade. Data collection was carried out at the schools.
Feature of intervention
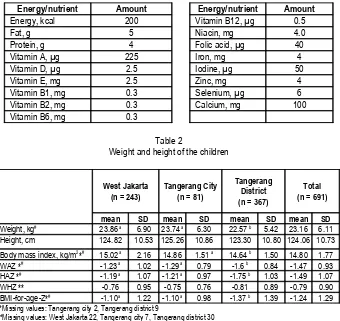
Each morning before school hour, every child should receive one portion of biscuit amounting to 50 gram (6 pieces). The nutrient content of the biscuit is presented in
Table 1. In the period of 8 – 12 months intervention, the biscuit was procured from three different manufacturers. Despite the slight differences in appearance, texture and taste, the nutrient composition of the biscuit remains the same.
Procedure of data collection
Interview
A structured, pre-tested questionnaire was used to obtain data on the general characteristics of the respondent, parental socio economic condition, occurrence of infectious diseases, dietary intake, street food consumption, school attendance and short term hunger. Interview was carried out by trained interviewers at the school.
A small number of mothers/parents of the school children were interviewed to ascertain the answers from the children as well as for observation on the housing and environmental condition.
Written test on health and nutrition knowledge
The observation and results from baseline study showed that school children had difficulties in answering the health and nutrition knowledge through interview. A pilot testing to small number of students revealed that a written test in the form of children used to have in school is a more suitable method. As many as 10 questions were administered to the children to assess their health and nutrition knowledge.
Anthropometry assessment
Anthropometry assessment included weight and height measurement of primary school children using standardized methods and equipments. Body weight was measured using SECA weighing scale, height using microtoise. Assessment was done by trained enumerator at the schools. The birth date of each child was obtained from school register or their parents.
Biochemical assessment
external standard (Hemotrol) with low, medium and high concentrations were used to check the reliability of the equipment every day prior to data collection in addition to the calibration cuvette provided by the manufacturer.
Blood for serum ferritin was transported in cool box and separated in the laboratory by centrifugation upon arrival in the laboratory. Serum was kept at -79°C until analysis. Serum ferritin was determined using ELISA method at the laboratory of SEAMEO TROPMED RCCN, Jakarta.
Dietary assessment
Dietary intake was assessed on children at grade 5-6 using a single 24-hr recall by trained enumerator. This method is adequate to assess the energy and macro/ micronutrient intake of a group population (not individual). Street food consumption was assessed through interview.
Cognitive performance assessment
Cognitive assessment to test concentration, attention span and verbal and non-verbal comprehensions was conducted for primary school children in grades 5 - 6. The tests were designed for use in this particular age group and were not culturally biased. The psychologists carried out the assessment individually for each child in a room separated from the place for other assessments. The room for psychological test was arranged in such a way that the disturbances and noise were minimized. The assessment took 30 - 45 minutes for each child.
Physical examination
The general health of the children was assessed by physician. The examination was carried out individually for each child and it took about 10 minutes for each child. Worm infestation assessment
Kato-Katz test was conducted to assess the prevalence of worm infestation among primary school children. Stool samples were preserved, filtered and prepared for microscopic examination and identification of
helminth eggs, particularly for Ascaris lumbricoides, Trichuris trichiura, and hookworm. The result of the assessment was semi quantitative. Each school was visited for three days in arrow to allow for higher coverage of stool sample selection.
Acceptability and consumption of fortified biscuit
The acceptability and consumption of fortified biscuits was assessed through interview with the children, the teachers and with sub set of mothers/parents.
Statistical analysis
Data on weight, height, sex and age were entered using NutriSurvey for SMART (Emergency Nutrition Assessment) for Z-score calculation based on NCHS/WHO references. Dietary intake data was analysed using Nutrisurvey program to obtain energy and nutrient intake calculated on the basis of Indonesian Food Composition Table. In addition, the dietary intake data was also analysed using WorldFood2 program to obtain the amount of the food consumed. All data was entered and transferred into SPSS for Windows for further analysis.
The normality of data distribution was checked using the Kolmogorov-Smirnov test. Categorical data was presented in numbers and percentages. Normally distributed data was reported as mean and SD, whereas non-normally distributed data was presented as median and 25th – 75th or minimum – maximum. The differences between groups were tested using independent t-test for continuous data or χ2 test for categorical data.
Ethical approval
The study received ethical clearance from the Ethical Committee of the Faculty of Medicine, University of Indonesia. Local government and school principals gave permit to conduct the study. Subjects or care taker of subjects were assessed only after they gave their informed consent. The participation of the subjects in the study was voluntary. All data is treated confidentially and be used only for the study purposes.
RESULTS
General characteristics of the subjects
In the evaluation study, as many as 706 children were assessed however only 691 children were reported. Fifteen children - all from Tangerang district - were excluded due to missing data on general characteristic (9 children) and anthropometry (3) and the children aged <5 years old (3). Of those 691 children, 171 (70.4%) from West Jakarta, 57 (70.4%) from Tangerang city and 242 (65.9%) from Tangerang district were participated in baseline study.
The proportion of gender ( boys 48.5% and girls 51.5%) and grade of the subjects were proportionally distributed. School children in Tangerang district were tended to be older than in Tangerang city and West Jakarta (9.3 ± 2.0 vs. 9.1 ± 1.9 and 8.9 ± 1.8 yr, P = 0.059, ANOVA).
As many as 11 (1%) children had their fathers and 4 (0.6%) their mothers passed away. Majority of the parents worked as daily labourer and had elementary school Jakarta, majority of the children had fathers working as private employee. Majority of the mothers were housewives, particularly in West Jakarta. More mothers in Tangerang district worked.
A high proportion of children (67%) could not specify the level of education their parents had. The schools did not have the list of the educational level of parents. Among those who could mention the education of their parents, majority of the parents had elementary education (43.6%).
Three fifth of the children had younger siblings at home and the proportion was relatively the same across areas. The number of family members the children lived was in average 6 ± 2 persons. Children in West Jakarta had significantly (P < 0.05) lower number of family member (5.6 ± 1.9 persons) than children in Tangerang city (6 ± 2.0 persons) and Tangerang district (6.2 ± 2.2 persons).
Nutritional status of the children
The prevalence of thinness (BMI-for-age Z-score <-2.00 SD) was 20.3%, 19.8%, and 24.9% in West Jakarta, Tangerang City and Tangerang district respectively. Tangerang district had the prevalence of underweight and stunting almost double than the other two areas indicating the most vulnerable area and that both chronic and acute undernutrition were present simultaneously. Compared to baseline study, the prevalence of undernutrition as well as mean Z-scores did not significantly differ among areas (Figure 1 and 2).
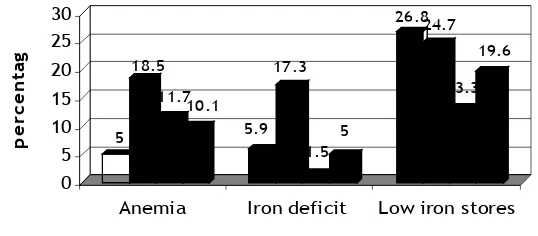
was lowest in West Jakarta and Tangerang city was the highest (P < 0.05, Chi-square). Similar figure was also obtained for the prevalence of iron deficiency. However, the prevalence of iron deficiency was the lowest in Tangerang district (Figure 3).
The haemoglobin concentration increased significantly compared to baseline in West Jakarta and Tangerang district. Therefore, the prevalence of anaemia significantly decreased in West Jakarta and Tangerang district. In particular in Tangerang district, the decrease of prevalence of anaemia and low iron stores was the highest (Figure 4). Similar trend was also observed among subjects who participated in both baseline and evaluation studies. Overall, haemoglobin increased by 0.65 g/dL (95% CI: 0.57 to 0.73 g/dL) and serum ferritin by 7.70 µg/L (95% CI: -4.11 to 11.30 µg/L).
Health status of the children
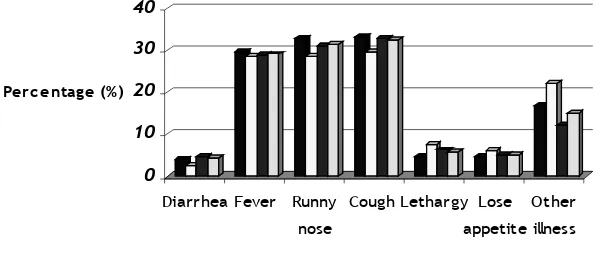
Among girls, only 10 (2.8%) had menarche already. They were in grade 5 and 6, aged between 10 – 12 years old. One third of the children experienced fever, runny nose and cough indicating upper respiratory infection two weeks prior to the survey (Figure 5). The prevalence of diarrhoea was small, <5%. It is interesting to note that the prevalence of diarrhoea dropped significantly compared to baseline (25%). The decreased prevalence of illness symptoms experienced by the children was high in West Jakarta and Tangerang city.
On the other hand, only one third of the children were diagnosed healthy based on the physical examination. In general, more children in Tangerang city were healthy than those from West Jakarta and Tangerang district. Majority of illness suffered by the children were chronic tonsillitis and common cold. Chronic tonsillitis was a common illness among children and this would lead that children were susceptible to infection, such as acute respiratory infection (Table 3). Some children suffered from two or more illnesses at the same time. Other illnesses suffered by the children were skin infection (2.9%) and acute respiratory infection (1.5%).
At baseline, a quite high proportion of children in Tangerang district suffered from skin infection (8%) and chronic otitis media supurative (8%); the corresponding values at evaluation were 3.3% and 0.3% respectively. There was no significant different on the prevalence of children diagnosed as healthy between baseline and evaluation.
Only half of the children submitted stool samples for examination. The compliance for stool samples was lower compared to baseline. About one third of children in Tangerang district were positively infected with worm. The common worm infestations were Arcaris lumbricoides and Trichuris trichiura. Hookworm and other worms were not found in the samples.
Only 124 (17.9%) of the children claimed that they took deworming drug in the previous 6 months; the highest was in Tangerang city (23 children or 28.4% from SDN Kampung Baru 2) and the lowest in West Jakarta (26 children or 10.7%). Except in SDN Bojong, approximately 20% of children in Tangerang district consumed deworming drugs. Those who took deworming drugs mainly came from grade 1 and 2.
Cognitive Performance
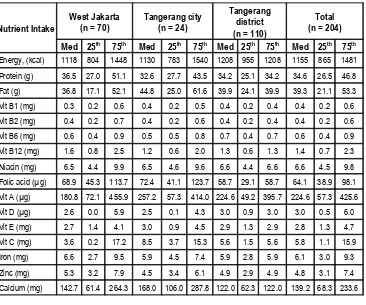
The cognitive performance of the subjects in general was lower compared to the optimum score a child could achieve. Except for verbal reasoning, the median values of the cognitive score were below 50% of the maximum score. It is worth to note that none of the children could achieve their maximum score, except four children (3 from West Jakarta and 1 Tangerang district) who could achieve maximum score for verbal reasoning (Table 4).
More children in Tangerang districts (19.3%) have ever repeating class than in West Jakarta (8.6%) or Tangerang city (7.4%). Majority of them repeated class in grade 1 (42.9%). The reason mentioned by the teachers was that because the children could not yet read and write.
Nutritional knowledge
The questions to assess the knowledge of children on health and nutrition were designed following the curriculum as well as information in the education materials provided. Knowledge on the importance of breakfast, general examples of nutritious meals, the content of biscuits and good times for washing hands were relatively good. However, knowledge on the general function of nutrients, as well as about anaemia was poor. Only one third of the children could give 6 correct answers out of 10 questions (Table 6).
Food intake of the children
Majority of children consumed meals two or three times daily and had breakfast on the day of the survey. More children in West Jakarta (70.4%) had three or more times meals per day than children in other areas. Almost all of the children did not bring food to school. One quarter of the children brought drink to school, the highest was in West Jakarta (40.7%) and the lowest in Tangerang district (14.2%).
Half of the children claimed to have hunger feeling during school hours. For those who had hunger feeling, the times of feeling hungry were during lesson hour (39.5%) and morning break (36.8%). More children in grade 4, 5 and 6 felt hungry during class hour than their younger counterparts.
A single 24-hr recall was administered to obtain the general picture on the amount energy and nutrient intake of the children. The meal on the previous day was a usual meal for 59.7% of the children (69.1% in Tangerang district, 50% in Tangerang city and 48.6% in West Jakarta). The energy and nutrient intake of the children was compared to the Indonesian RDA (Recommended
Dietary Allowance) to know the dietary adequacy of the children. The weight and height of the study population were lower compared to the reference weight and height as stated in the Indonesian RDA. This condition explains why the proportion of undernutrition was high and a high proportion of children could not fulfil the RDA. For all children aged 7 – 9 years old, the weight and height (mean ± SD) were 21.6 ± 4.4 kg and 121.2 ± 7.8 cm. The corresponding values for boys aged 10 – 12 years old were 26.5 ± 5.2 kg and 132 ± 6.8 cm and for girls aged 10 – 12 years old were 28.5 ± 6.8 kg and 134.3 ± 7.8 cm respectively.
In general, the energy intake of the children was only half of the RDA, whereas the figure was higher for protein. There was no significant different intake of nutrient among areas. Almost all children (>80%) could not meet their energy and nutrient intake, particularly for micronutrients (>95%). The most limiting nutrients were calcium, vitamin C, folic acid, vitamin A, iron and zinc (Table 7 and Figure 6).
All but one child ate rice on the previous day. Almost one quarter of the children consumed biscuit and one third noodle. More children in Tangerang district consumed fish than children in the other two areas. More than three quarters of the children consumed vegetables and oil/fats on the previous day. The oil/fats consumption mostly came from fried snack and/or fried side dish. Only very few (<10%) children consumed milk.
energy contribution from oil would then be 216 kcal (±10% of energy requirements).
In general, except in Tangerang district, the biscuit/bread consumption did not differ between baseline and evaluation with respect to the frequency and amount (Table 8). However it is warrant further verification that only 65% of the children consumed biscuit on the previous day. Further examination showed that 20% of the children had interview on Monday and 43% of these children did not consumed biscuit on the and those who bought food only for one type. However, the type of food bought varied more than in the other areas. On the other hand, children in Tangerang bought food more often. The mst frequently bought food were ice, chiki/chips and bread/cake. Energy and protein-rich foods such as rice, noodle, or meatball were only bought by smaller proportion of the children.
Most of the children bought food at food sellers in school and the proportion was the same across area. More children in West Jakarta bought food in school canteens. The price of the food were mostly between Rp 200 and Rp 500 (US$ 0.02 – 0.05) per portion/item. Buying food in school was related with the pocket money the children brought to school. As many as 17 (2.5%) children did not bring pocket money.
Biscuit consumption
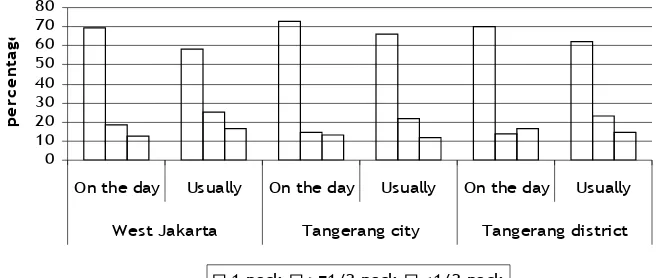
On the time of interview, half of the children had not received their biscuits. Almost all children received biscuits one package daily during school days, either 6 (for those who received ‘BISKUIT’) or 11 (for those who received ‘BISKIZ SUSU’) pieces. Very few children claimed to receive two or three packages. Most of the children consumed biscuits one package daily. Grade of the students was not found to be significantly associated with the amount of biscuits consumption (Figure 7).
It is interesting to note that half of children in West Jakarta and Tangerang city shared the biscuits with other members of the households when they did not finish the biscuit in school. On the other hand, 54.6% children in Tangerang district ate the biscuit for themselves. The children were happy to get biscuit every day and the biscuit was tasty. They also informed to their parents that they received biscuit everyday. It was fine to receive biscuit every day for more than half of children in Tangerang districts. The proportion was smaller for West Jakarta and Tangerang city. Some children (24%) suggested receiving food other than biscuit or biscuit with different taste and shape everyday. Only very few children (6.5%) suggested to get tastier biscuit (Figure 8).
Factors associated with biscuit consumption
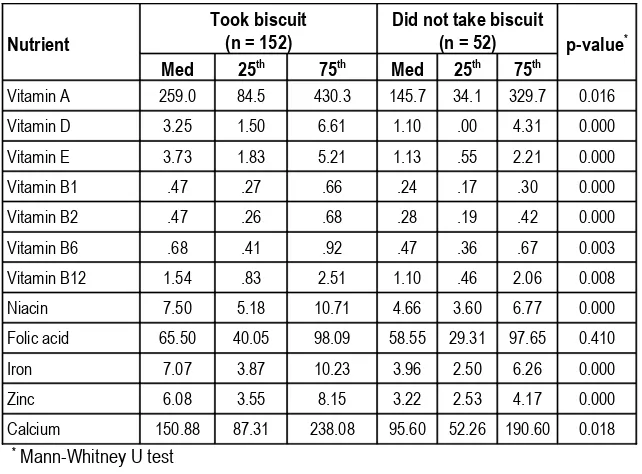
The usual portion of biscuit eaten did not positively associate with the nutritional status of the children as well as anaemia (P> 0.05; Chi-square). Also, cognitive performance was not associated with the biscuit consumption on the day of the survey. The effect of biscuit on cognitive performance might not be direct. However, the energy and nutrient intake differ significantly between children who consumed biscuit and those who did not consumed (Table 9).
Parents perception about the program
mentioned the disadvantage of biscuit distribution, which were boring (1.5%) and that the biscuit replaced lunch (1.5%).
Almost all parents knew that their children receive biscuit on every school day. In Tangerang city and Tangerang district, three quarters of the parents mentioned that their children finished the biscuit; higher than in West Jakarta. Their children liked the biscuit. However, more than half of the children brought the biscuit home for other siblings at home when they did not finish it.
DISCUSSION
prevalence of anaemia was in line with the decreased of iron deficiency. Overall, the prevalence of anaemia was in moderate public health problem (anaemia prevalence between 5 – 19.9%, UNICEF/UNU/WHO, 2001). The WFP – NRP through Primary Schools has also significantly improved, albeit small, all aspects of the cognitive performance, in particular in Tangerang district. Prevalence of undernutrition did not decrease significantly. However, among children participated in both baseline and evaluation studies, there was a small (< 0.1 SD) increment in their nutritional status indices as shown by an increase of the HAZ, WAZ and BMI-for-age Z-score. Overall, children liked the biscuit very much; 70% of them always finished one package of biscuits during school days.The advantages of biscuits as a vehicle of micronutrients for school feeding are that it has relatively long shelf-life, relatively easy in handling and distribution and most children liked it. The biscuit provided 9 vitamins and 5 minerals as well as energy and protein. The energy contribution was low, only 201 kcal or 9.8% of the daily requirements. On the other
hand, it provides 20% of iron requirements for 9 – 12 years old girls or 30% for 9 – 12 years old boys. The iron fortificant was in the form of ferrous fumarate (personal communication with biscuit manufacturer), which has bioavailability as good as ferrous sulphate (INACG, 1981). It also provides folic acid and vitamin B12 which play role in haemoglobin formation. In areas where anaemia due to iron deficiency is a problem, zinc deficiency might also be a problem as those two nutritional deficiencies share the same aetiology and foods rich in iron are also rich in zinc (Gibson, 1999). The biscuit provides 4 mg of zinc, fulfilling 32% requirements for 9 – 12 years old girls or 28% for 9 – 12 years old boys. Problem of interaction between iron and zinc in the biscuit has been circumvented by providing iron and zinc with ratio of 1:1. This study did not assess the magnitude of zinc deficiency. Small study in Tangerang district among anaemic school girls showed that the prevalence of zinc deficiency was 17% (Indriastuti, 2005).
The effect of school breakfast (or lunch) on school attainment is hypothesized through three pathways as described by improve a child’s ability to concentrate and learning. Although the positive effect of school meals on nutritional status requires longer time, providing good quality and quantity of meals long enough could improve the nutritional status of children. Improved nutritional status might lead to the improvement of cognition and alertness over time.
transient, therefore the association of hunger feeling and cognition might be missed.
We did not assess whether the biscuit replaces home meal or not. There was no appreciable improvement in the dietary pattern of the children. The proportion of children who had three or more main meals daily remained 65%. In fact, there was a decrease in energy and protein intake compared to baseline. However the biscuit consumption, with respect to frequency and amount, increased compared to baseline. It is also interesting to note that noodles consumption also increased.
Almost all children received pocket money from their parent everyday. Children had the habit to buy 1 – 2 types of food from food sellers in schools or at home. Ice or beverages was the most commonly bought. The price of food bought by the children was cheaper in Tangerang district than in the other two areas. With regards to the type of food, children in West Jakarta and Tangerang city (urban areas) bought high-energy food such as bread, meat ball, rice etc more often than in Tangerang district. Majority of the schools, particularly in Tangerang district did not have school canteen. The quality and safety of the food sold in the schools areas were not assessed in this study.
The improvement on the nutritional status of the children was not observed in this study. The biscuit only provides <10% of daily energy requirement of the children. Also, the improvement on growth usually requires longer time of intervention and this study only has one year time span. A meta analysis of the randomized – controlled trials on the effect of supplementary feeding program among young children (aged <5 years old) did not show the positive impact of supplementary feeding program on growth (Sguassero et al, 2005). Another study (van Stuijvenberg, 2005) found no effect on growth of the study population as a whole but observed positive effect on the changes in height and HAZ in the children with low iron stores at baseline. In our study, among children who had low iron stores (serum ferritin <30 µg/L) at baseline, the HAZ
improved by 0.14 (95% CI: 0.07-0.22, P<0.001) at evaluation.
While improvement in haemoglobin and iron status was significant, it is important to note that when the food supplementation was ceased, such as during long school break, the positive benefit i.e. improved micronutrient status may return to pre-intervention levels. This finding was found in South Africa where the status of vitamin A and iron return to pre-intervention levels after long summer school holiday. Iodine status was exception which may be attributed to mandatory iodization salt in the community (van Stuijvenberg, 2005). Therefore, other sources of micronutrient supplementation for the students besides the biscuits may also be considered.
The physical growth of schoolchildren is the result of environmental factors, such as poor food consumption patterns, illness, lack of sanitation, and poor health and hygiene practices (ACC/SCN, 2000). The environmental factors will also determine the onset of puberty, which also has the influence on growth. It is therefore very important to reach school children as there is a ‘second window opportunity’ for improving their growth to prepare them entering adulthood with better nutritional status, particularly for girls. Among adolescent girls in developing countries, the peak height velocity occurs at the average age of 11.7 years and menarche at 12.8 years (WHO, 1995). Majority of the children had not passed their puberty period as shown that only 10 girls were menarche (7.9% out of 127 girls aged ≥10 years old).
albeit small. However, it should be noted that
Findings in this study supported results of the fortified-biscuits distribution for South African school children (van Stuijvenberg, 2005) which found similar positive effect on cognitive outcome. The study also found significant treatment effect on verbal fluency task especially in those children with low iron stores, which was in line with positive correlation between haemoglobin and verbal fluency score found in this study (r=0.182, p=0.014).
Both baseline and evaluation assessments were done in the same month of the year (September 2004 and September 2005), therefore the decrease in the prevalence of diarrhoea was unlikely biased by the time of the assessment. It is possible that the children had improved their practices in hand-washing, as this item received correct answers for most children (70%) in the health and nutrition knowledge test. Unfortunately hand washing practice information was not obtained in this study. On the other hand, the proportion of children who were diagnosed as healthy by physical examination did not differ significantly from baseline. It is assumed that the children had better self appreciation about their health.
Tangerang district consistently showed poorer situation across most of the study indicators when compared with Tangerang City and West Jakarta. The high prevalence of stunting and anaemia in this area suggested socio-economic constraint, whereas high worm infestation implied poor hygiene and sanitation practices. Worm infestation may be one of the contributing factors to anaemia in this area.
Several limitations of this study warrant careful interpretation of the study results. The study used a pre- and post-design test without control group. Also, true compliance
was not known as the daily biscuit consumption was not assessed.
The parents welcome biscuit distribution and they hoped that their children get smarter. However, parents were not adequately informed about the objectives and the benefits of the biscuits. When parents understand about the objectives and benefits of the program, it is expected to improve the compliance. Teachers understood their roles and responsibilities in distributing the biscuit and motivate the children to consume it. In general, aspects on nutrition and health education are not yet optimized, among teachers, school children, parents, food sellers in the schools and,
In conclusion, distribution of the fortified biscuits through Primary Schools has significantly decreased anaemia by half (from 23.9% to 10.1%) and iron deficiency (as iron deficient from 8.3% to 5% and low iron stores from 25.7% to 19.6%). Although nutritional status in terms of anthropometric measures did not change in overall study population, children with low iron status experience positive effect on their growth (weight, height). Prevalence of illnesses has also been shown to decrease compared to those found at baseline. Cognitive performance of the children has also significantly improved, albeit small, in particular in Tangerang district. However, despite improvement in the program outcome, there was no appreciable improvement in dietary pattern. Intake of micronutrients from the main meal was still below the requirements for calcium, iron, zinc, and some vitamins. Knowledge in health and nutrition among the children was also still inadequate.
its objective. Provision of printed educational materials to encourage the compliance of fortified biscuit consumption, the improvement of the overall diet of the children and application of food safety practices can be improved by inviting participation from food industries or other stakeholders. Nutrition and health education to teachers needs to be strengthened as they are the key channel of both biscuits distribution and health/nutrition education to the students. In addition, education to food sellers at schools for provision of safe and nutritious foods and socialization to parents and community in general, and good coordination with local education office to increase compliance and participation should make an integral part of the program.
For further expansion of the program, data from the “height measurement for new students (pengukuran TBABS)” activity for nutritional surveillance may also serve for targeting both areas and schools.
The implementation of WFP – NRP could be seen as an opportunity to revitalize the UKS program. Revitalization of UKS program will involve a wide range of stake holders from health sector, education sector, agriculture sector, national agency drugs and food control, local government, school committee, parents-teachers association, teacher organizations, youth organizations etc. In this respect, an innovative coordination and collaboration scheme have to be initiated and strengthened aimed at increasing the awareness and responsibilities of the stakeholders.
Acknowledgement
We would like to thank Ibu Liche Seniati of Psychology Faculty, University of Indonesia for the design on cognitive performance assessment; Ibu Inge Breuer and Ibu Siti Konio of WFP Indonesia for substantial input in the study; Duma Octavia and Suci Fitriyanti for their valuable contribution in data collection; and our enumerators, teachers, students and their parents for their enthusiasm.
REFERENCES
1. ACC/SCN. (2000) The Fourth report on the world nutrition situation. Nutrition throughout the life cycle. ACC/SCN in collaboration with IFPRI, Geneva. 2. Bundy D (2005). School health and
nutrition: policy and programs. Food Nutr Bull 26 ( Suppl 2): S186 – S192. 3. Cook J (1999). Defining optimal body
iron. Proc Nutr Soc 58: 489 – 495. 4. Departemen Kesehatan RI, Direktorat
Jenderal Bina Kesehatan Masyarakat (2003). Gizi dalam Angka. Departemen Kesehatan RI, Jakarta
5. Gibson RS and Ferguson EL (1999). An Interactive 24-hour recall for assessing the adequacy of iron and zinc intakes in developing countries. ILSI Press, USA,. p. 48-60, 120-125.
6. Gibson RS (1990) Principles of nutritional assessment. Oxford University Press, New York.
7.
Gibson RS (2005) Principles of nutritional assessment. 2nd Ed. Oxford University Press, New York.8. Gramtham-McGregor S (2005). Can the provision of breakfast benefit school performance? Food Ntr Bull 26 (2 Suppl): S144 – S158.
9. Gross R, Kielmann AA, Korte R, Schoeneberger H and Schultink W (1997) Guidelines for nutrition baseline survey in communities. SEAMEO TROPMED and Deutsche Gessellschaft fur Technische Zusammenarbeit (GTZ), Bangkok.
10. Indriastuti YA (2005). Effect of iron and zinc supplementation on iron, zinc and morbidity status of anemic adolescent school girls (10 – 12 years) in Tangerang district. Dissertation. Study Program in Nutrition, Postgraduate Program, Faculty of Medicine, University of Indonesia. Jakarta. 11. SEAMEO TROPMED (2005). Report
School. June 2005. SEAMEO TROPMED RCCN – UI. Jakarta.
12.
Sguassero Y, de Onis M, Carroli G(2005). Community-based
supplementary feeding for promoting the growth of young children in developing countries. The Cochrane Database of Systematic Reviews 2005, Issue 4. Art. No.: CD005039.pub2. DOI: 10.1002/14651858.CD005039.pub2. 13. Stoltzfus, Rebecca J, Michele L.
Dreyfuss. Guidelines for the Use of Iron Supplements to Prevent and Treat Iron Deficiency Anemia. ILSI Press USA. 1998
14. UNICEF/UNU/WHO. Iron Deficiency Anemia Assessment, Prevention and Control: A guide for programme managers. WHO, 2001.
15.
Van Stuijvenberg ME, Kvalsvig JD, Faber M, Kruger M, Kenoyer DG and Benadé AJS (1999). Effect of iron-, iodine- and β-carotene-fortified biscuits on the micronutrient status of primary school children: a randomized controlled trial. Am J Clin Nutr 69: 497-503.16.
Van Stuijvenberg ME (2005). Using theschool feeding system as a vehicle for micronutrient fortification: experience from South Africa. Food and Nutrition Bulletin 26(2): S213-9
17. WFP/UNESCO/WHO (1999). School Feeding Handbook. Rome.
Table 1
Energy and nutrient content of the biscuit (for every 50 gram biscuit or one serving size)
Energy/nutrient Amount Energy/nutrient Amount
Energy, kcal 200 Vitamin B12, µg 0.5
Fat, g 5 Niacin, mg 4.0
Protein, g 4 Folic acid, µg 40
Vitamin A, µg 225 Iron, mg 4
Vitamin D, µg 2.5 Iodine, µg 50
Vitamin E, mg 2.5 Zinc, mg 4
Vitamin B1, mg 0.3 Selenium, µg 6
Vitamin B2, mg 0.3 Calcium, mg 100
Vitamin B6, mg 0.3
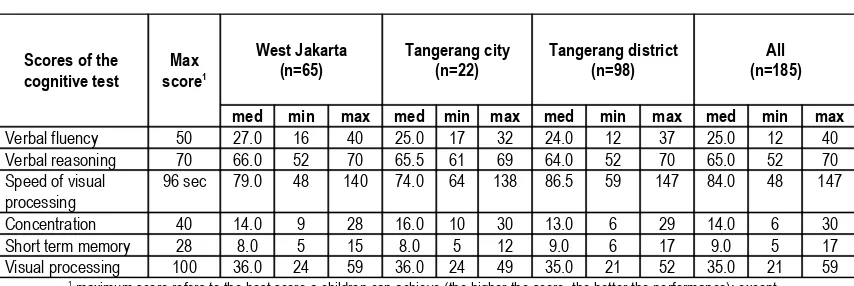
Table 2
Weight and height of the children
West Jakarta (n = 243)
Tangerang City (n = 81)
Tangerang District (n = 367)
Total (n = 691)
mean SD mean SD mean SD mean SD
Weight, kg# 23.86 a 6.90 23.74 a 6.30 22.57 b 5.42 23.16 6.11
Height, cm 124.82 10.53 125.26 10.86 123.30 10.80 124.06 10.73
Body mass index, kg/m2 *# 15.02 a 2.16 14.86 1.51 a 14.64 b 1.50 14.80 1.77
WAZ *# -1.23 a 1.02 -1.29 a 0.79 -1.6 b 0.84 -1.47 0.93
HAZ *# -1.19 a 1.07 -1.21 a 0.97 -1.75 b 1.03 -1.49 1.07
WHZ ** -0.76 0.95 -0.75 0.76 -0.81 0.89 -0.79 0.90
BMI-for-age-Z*# -1.10a 1.22 -1.10 a 0.98 -1.37 b 1.39 -1.24 1.29
*Missing values: Tangerang city 2, Tangerang district 9
**Missing values: West Jakarta 22, Tangerang city 7, Tangerang district 30 # Significant different at P < 0.05, ANOVA (different letters shows the difference).
Table 3
Health condition of children based on physical examination*
West Jakarta (n = 240)
Tangerang City (n = 81)
Tangerang District (n = 361)
Total (n = 682)
n % n % n % n %
Healthy 89 37.1 33 40.7 114 31.6 236 34.6
Chronic tonsillitis 40 16.7 16 19.8 60 16.6 116 17.0
Common cold 27 11.3 5 6.2 52 14.4 84 12.3
Chronic tonsillitis + common cold
19 7.9 5 6.2 24 6.6 48 7.0
Acute tonsillopharingitis 23 9.6 3 3.7 15 4.2 41 6.0
Other illness 42 17.4 19 23.4 96 26.6 157 23.1
Table 4
Cognitive performance of the children (raw score)
Scores of the cognitive test
Max score1
West Jakarta (n=65)
Tangerang city (n=22)
Tangerang district (n=98)
All (n=185)
med min max med min max med min max med min max
Verbal fluency 50 27.0 16 40 25.0 17 32 24.0 12 37 25.0 12 40
Verbal reasoning 70 66.0 52 70 65.5 61 69 64.0 52 70 65.0 52 70
Speed of visual processing
96 sec 79.0 48 140 74.0 64 138 86.5 59 147 84.0 48 147
Concentration 40 14.0 9 28 16.0 10 30 13.0 6 29 14.0 6 30
Short term memory 28 8.0 5 15 8.0 5 12 9.0 6 17 9.0 5 17
Visual processing 100 36.0 24 59 36.0 24 49 35.0 21 52 35.0 21 59
1 maximum score refers to the best score a children can achieve (the higher the score, the better the performance); except
for speed of visual processing (the lower/shorter period, the better the performance).
Table 5
Cognitive performance of the children (percentage to the maximum score)1
Scores of the cognitive test
West Jakarta (n=65)
Tangerang city (n=22)
Tangerang district (n=98)
All (n=185)
med min max med min max med min max med min max
Verbal fluency# 54.0 32.0 80.0 50.0 34.0 64.0 48.0 24.0 74.0 50.0 24.0 80.0
Verbal reasoning# 94.3 74.3 100.0 93.6 87.1 98.6 91.4 74.3 100.0 92.9 74.3 100.0
Concentration 35.0 22.5 70.0 40.0 25.0 75.0 32.5 15.0 72.5 35.0 15.0 75.0
Short term memory 28.6 17.9 53.6 28.6 17.9 42.9 32.1 21.4 60.7 32.1 17.9 60.7
Visual processing 36.0 24.0 59.0 36.0 24.0 49.0 35.0 21.0 52.0 35.0 21.0 59.0
1 data was calculated: (score achieved / maximum score) * 100
# significantly different among areas (Kruskal Wallis test)
Table 6
Proportion of children who could correctly answer the questions on general health and nutrition knowledge
West Jakarta (n = 114)
Tangerang City (n = 36)
Tangerang District (n = 168)
Total (n = 318)
n % n % n % n %
The importance of having breakfast 106 93.0 34 94.4 146 86.9 286 89.9
Example of nutritious foods 97 85.1 25 69.4 129 76.8 251 78.9
Content of the biscuit 93 81.6 30 83.3 120 71.4 243 76.4
Time to wash hand 83 72.8 25 69.4 115 68.5 223 70.1
Function of Oralit 65 57.0 18 50.0 83 49.4 166 52.2
Vitamin for growth 45 39.5 16 44.4 82 48.8 143 45.0
Function of calcium 20 17.5 5 13.9 23 13.7 48 15.1
Balance diet 18 15.8 3 8.3 25 14.9 46 14.5
Function of protein 16 14.0 2 5.6 15 8.9 33 10.4
Anaemia 10 8.8 7 19.4 12 7.1 29 9.1
Total correct answer
- <6 correct answer 84 73.7 27 75.0 127 75.6 238 74.8
Table 7
Energy and nutrient intake of the children
Nutrient Intake
West Jakarta (n = 70)
Tangerang city (n = 24)
Tangerang district (n = 110)
Total (n = 204)
Med 25th 75th
Med 25th
75th
Med 25th 75th
Med 25th 75th
Energy, (kcal) 1118 804 1448 1130 783 1540 1208 955 1208 1155 865 1481
Protein (g) 36.5 27.0 51.1 32.6 27.7 43.5 34.2 25.1 34.2 34.6 26.5 46.8
Fat (g) 36.8 17.1 52.1 44.8 25.0 61.6 39.9 24.1 39.9 39.3 21.1 53.3
Vit B1 (mg) 0.3 0.2 0.6 0.4 0.2 0.5 0.4 0.2 0.4 0.4 0.2 0.6
Vit B2 (mg) 0.4 0.2 0.7 0.4 0.2 0.6 0.4 0.2 0.4 0.4 0.2 0.6
Vit B6 (mg) 0.6 0.4 0.9 0.5 0.5 0.8 0.7 0.4 0.7 0.6 0.4 0.9
Vit B12 (mg) 1.6 0.8 2.5 1.2 0.6 2.0 1.3 0.6 1.3 1.4 0.7 2.3
Niacin (mg) 6.5 4.4 9.9 6.5 4.6 9.6 6.6 4.4 6.6 6.6 4.5 9.8
Folic acid (µg) 68.9 45.3 113.7 72.4 41.1 123.7 58.7 29.1 58.7 64.1 38.9 98.1
Vit A (µg) 180.8 72.1 455.9 257.2 57.3 414.0 224.6 49.2 395.7 224.6 57.3 425.6
Vit D (µg) 2.6 0.0 5.9 2.5 0.1 4.3 3.0 0.9 3.0 3.0 0.5 6.0
Vit E (mg) 2.7 1.4 4.1 3.0 0.9 4.5 2.9 1.3 2.9 2.8 1.3 4.7
Vit C (mg) 3.6 0.2 17.2 8.5 3.7 15.3 5.6 1.5 5.6 5.8 1.1 15.9
Iron (mg) 6.6 2.7 9.5 5.9 4.5 7.4 5.9 2.8 5.9 6.1 3.0 9.3
Zinc (mg) 5.3 3.2 7.9 4.5 3.4 6.1 4.9 2.9 4.9 4.8 3.1 7.4
Calcium (mg) 142.7 61.4 264.3 168.0 106.0 287.8 122.0 62.3 122.0 139.2 68.3 233.6
Table 8
Frequency and amount of biscuit/bread consumption between baseline and evaluation (from 24-hr recall)
Frequency of biscuit/bread
West Jakarta Tangerang city Tangerang district
Baseline (n = 60)
Evaluation (n= 70)
Baseline (n = 24)
Evaluation (n = 24)
Baseline (n = 61)
Evaluation (n = 110)
n % n % n % n % n % n %
Frequency of biscuit/bread consumption
19 79.2 46 65.7 42 70 17 70.8 16 66.7 89 80.9
mean SE mean SE mean SE mean SE Mean SE mean SE
Amount of biscuit/bread consumption (gram)
Table 9
Association between nutrient intake and biscuit consumption on the day of the survey
Nutrient
Took biscuit (n = 152)
Did not take biscuit
(n = 52) p-value*
Med 25th 75th Med 25th 75th
Vitamin A 259.0 84.5 430.3 145.7 34.1 329.7 0.016
Vitamin D 3.25 1.50 6.61 1.10 .00 4.31 0.000
Vitamin E 3.73 1.83 5.21 1.13 .55 2.21 0.000
Vitamin B1 .47 .27 .66 .24 .17 .30 0.000
Vitamin B2 .47 .26 .68 .28 .19 .42 0.000
Vitamin B6 .68 .41 .92 .47 .36 .67 0.003
Vitamin B12 1.54 .83 2.51 1.10 .46 2.06 0.008
Niacin 7.50 5.18 10.71 4.66 3.60 6.77 0.000
Folic acid 65.50 40.05 98.09 58.55 29.31 97.65 0.410
Iron 7.07 3.87 10.23 3.96 2.50 6.26 0.000
Zinc 6.08 3.55 8.15 3.22 2.53 4.17 0.000
Calcium 150.88 87.31 238.08 95.60 52.26 190.60 0.018
* Mann-Whitney U test
21.826.3
7.4 23.5
19.8
4.9
39.039.0
6.3
31.132.3
6.5
0 10 20 30 40
Perc entage (%)
West JakartaTangerang city Tangerang district
Total
Underweight Stunting Wasting
Figure 1
0 10 20 30 40 50
Baseline Ev aluation Baseline Evaluation Baseline Evaluation
W est Jakarta Tangerang city Tangerang district
%
c
h
il
d
r
e
n
Underw eight Stunting W asting Thinness
Figure 2
Changes on the prevalence of under nutrition between baseline and evaluation
5 18.5
11.710.1
5.9 17.3
1.5 5
26.824.7
13.3 19.6
0 5 10 15 20 25 30
p
e
r
c
e
n
ta
g
Anemia Iron deficit Low iron stores
West Jakarta Tangerang city Tangerang district Total
Figure 3
0 10 20 30 40 50 60
Baseline Evaluation Baseline Ev aluation Baseline Evaluation
W est Jakarta Tangerang city Tangerang district
%
c
h
il
d
re
n
Anemia Iron deficit Low iron stores
Figure 4
Changes in prevalence of anaemia and iron deficiency between baseline and evaluation
0 10 20 30 40
Perc entage (%)
Diarrhea Fever Runny
nose
Cough Lethargy Lose
appetite Other
illness
West Jakarta Tangerang c ity Tangerang distric t Total
Figure 5
0
West Jakarta Tangerang city Tangerang district Total
Figure 6
Median percent adequacy of energy and nutrient intake (compared to the Indonesian RDA)
0
On the day Usually On the day Usually On the day Usually
West Jakarta Tangerang city Tangerang district
p
1 pack >=1/2 pack <1/2 pack
0 10 20 30 40 50 60 70 80
Percentage (%)
To go to school To study better To avoid hunger To be active To be smart To be healthy
West Jakarta Tangerang c ity Tangerang distric t Total
Figure 8