6
USABILITY AND USER BENEFITS
Ramadiani1, Rodziah binti Atan2, Mohd. Hasan Selamat2, Noraini Che Pa2, and Rusli Abdullah2
1
Computer Science, Natural Resourches and Mathematic Faculty, Mulawarman University 2
Information System, Computer Science and Information Technology Faculty, Putra Malaysia University
Email: [email protected]
Abstract
E-learning does not function properly if the system is not in accordance with user needs. This study aims to establish an evaluation model for e-learning user interface according to user acceptance. The model is designed based on three categories: user learning style, usability and user benefits. Results of measurements of the three categories will determine the level of user acceptance of the e-learning interface. The data were taken using a questionnaire which was distributed to 125 ELS students from various countries. Then processed using SEM and Lisrel v8.80. This paper presents experimental set up for the general research and some results for technology acceptance theories.
Keywords:e-Learning, User Interface, User’s Style, Usability, User Benefit.
Abstrak
E-learning tidak akan berfungsi dengan baik jika sistem ini tidak sesuai dengan kebutuhan pengguna. Penelitian ini bertujuan untuk membangun sebuah model evaluasi untuk antarmuka pengguna e-learning sesuai dengan penerimaan pengguna. Model ini dirancang berdasarkan tiga kategori: gaya belajar pengguna, kegunaan, dan manfaat pengguna. Hasil pengukuran dari tiga kategori akan menentukan tingkat penerimaan pengguna antarmuka e-learning. Data diambil dengan menggunakan kuesioner yang dibagikan kepada 125 siswa ELS dari berbagai negara. Kemudian diolah dengan menggunakan SEM dan Lisrel v8.80. Paper ini menyajikan set up eksperimental untuk penelitian umum dan beberapa hasil untuk teori penerimaan teknologi.
Kata kunci:e-Learning, User Interface, Style Pengguna, Usability, Manfaat Pengguna.
1. Introduction
E-learning is a method of learning that is offered by many universities and educational institutions to support their learning process. Basically, the concept of e-learning is the provision of equal educational facilities to learn in a conventional school. The role of e-learning is expected to help the role of educational institutions an conventional training. E-learning process has different characteristic compared to common education. According to [1] E-learning has personalized for student, focused on student and is directly controlled by themselves, occurs only when required and has the strictly necessary duration, communicated by technology on the
basis student has gotten knowledge and need proactive roles.
2. Related Theories
2.1. User Interface Evaluation
The system interface is used to communicate with a user in an interactive system. The system interface can be divided into two sections; a front interface and back-end interface [1]. E-learning interface design is especially critical, as the learning effectiveness and interface design are substantially intertwined. To design an e-learning interface should be determined by how people learn and the tasks they need to perform in the program. There are some features in the user interface that are still less efficient [3]. Many theories that discuss the interface evaluation design, but the fact still weak and does not work in accordance with the e-learning user interface expected [4]. Table I shows the related works in e-learning user interface acceptance.
user explicit control, adaptability, error management, compatibility, guidance, consistency, user workload, significance of codes Quantitative
Evaluation, Olga, (2004)
Speed of user’s work, Complexity
user’s work, user’s mistakes,
Speed of studying, Subjective satisfaction
AHP Model. Yong et.al (2007)
Interaction Support, Function Support, User Support, Information Support, Device Capacity
HELAM ( Hexagonal e-learning Assessment Model), Ozkan (2009)
system quality, service quality, content quality, learner perspective, instructor attitudes, supportive issues.
Inherent Structure in e-learning, Sfenrianto et.al. (2011)
Learning style, Motivation, Knowledge-ability
"The often problem is that it is impossible to determine which user interface design variant is better" [5]. Empirical evaluation of subjective selection criteria cannot be the best interface. Therefore quantitative evaluation methods are needed user interface. Different interface designs can be evaluated with quantitative methods priority criteria. While [3] argues that interface design e-learning should be a goal, an integrated component of the overall e-learning products.
User interface becomes the major channel to convey information in e-learning context: a well-designed and friendly interface is thus the key element in helping users to get the best results quickly [6]. Interface settings will affect the quality of students learning that accommodates their needs in terms of personalizing the content, structure, and presentation.
2.2. User’s Learning Style
User’s Learning or Style User’s Style is student factors in learning such as, learning style, motivation, and knowledge ability. User learning style should be considered in the adaptive e-learning development in order to optimize learning process [7].
Learning Style refers to how a learner perceives, interacts with, and responds to the learning environment; it is a measure of individual differences [8]. According to [9] User Learning Style is developed from the individual’s physiological characteristic, will be influenced by: 1) Psychology development, social environment and education experience. 2) Learning time, study habits, learning approach, gender, ethnicity, learning time, the learning resource and the process of learn. 3) Record the learning information for each student: the individual learning style, preferred study habits, learning approach, his dynamic learning situation and even detail information.
Learning motivation is an individual’s characteristic and consistent approach to organizing and processing information. The students learning motivation is divided into five categories: effort, confidence, satisfaction, sensory interest and cognitive interest [7]. From these categories, effort is a fundamental indicator of a student’s motivation. The exertion of effort in learning can be as a positive parameter. The
student’s effort is the amount of time the learner
spends on learning and participation.
The student’s ability is also another factor
prepare inputs for, and interpret outputs of a system or component (IEEE Std.610.12-1990) [13].
Usability is important to determine whether something is useful. It matters that something is easy but it is not what you want [5][14][15]. Although there are many individual methods for evaluating usability; they are not well integrated into a single conceptual framework that facilitate their usage by developers. There are several standards or conceptual models for usability, and not all of this standards or models describe the same operational definitions and measures [16]. It needs a measurement model and a structural model for evaluating the e-learning user interface acceptance model [8] [17].
2.4. The Technology Acceptance Model (TAM) There are several models that are built to analyze and understand the variables that affect the user acceptance of information technology [18], among others; Theory of Reasoned Action (TRA), Theory of Planned Behaviour (TPB), and the Technology Acceptance Model (TAM). TAM models are developed from a psychological theory, which describes the behavior of computer users that are based on beliefs, attitudes, desires and relationships user behavior. These models aim to explain the main factors of user behavior on user acceptance of technology as refered in Figure.1. This model places the attitudinal factors of individual user behavior with variables: ease of use (ease of use), utility (usefulness), use (Attitude Toward Using), behavior to keep using (Behavioral Intention To Use), the real conditions of use of the system (Actual System Usage).
System Design Features
Perceived Usefulness
Perceived Easy of
Use
Actual System
Use Attitude
Toward Using
External Stimulus
Cognitive Response
Affective Response
Behavioral Response
Fig 1. TAM Evaluation Theory
3. Research Design
3.1. Research Hypothesis Model
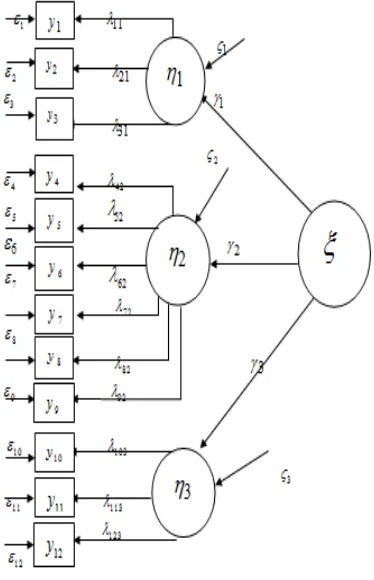
User Interface Acceptance in this interface evaluation focuses on 12 indicator variables [Figure. 2]:
User Interface Acceptance;
1
User’s Style; 2
Usability; 3User Benefit y1Knowledge ability; y2Motivation;
y
3
Learning Style;
4
y Knowability; y5Operability;
6
y Efficiency; y7 Robustness; y8Safety;
9
y Subjective Satisfaction; y10Media elements; y11Communicativeness; y12User Expectation. The complete description about this research hypotheses as shown in Figure 3.
Fig 2. Research Hypotheses
The model of User Interface Acceptance in this study is a model 2ndCFA. For each of the research hypotheses will be defined in a statistical hypothesis testing is necessary as a means of hypothesis. Testing multiple statistical hypotheses through estimation of the parameters
and
contained in the research and LISREL models. In statistical hypothesis H0if the correspondingFig 3. Research Hypotheses
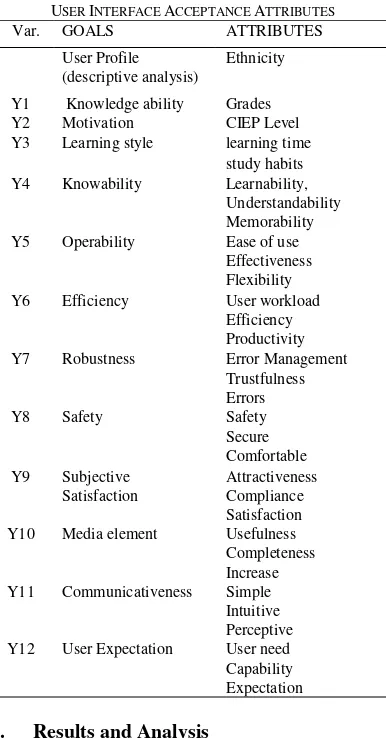
We can see the User Interface Acceptance Model attributes as shown in tables II.
TABLE II
USER INTERFACE ACCEPTANCE ATTRIBUTES
Var. GOALS ATTRIBUTES
User Profile (descriptive analysis)
Ethnicity
Y1 Knowledge ability Grades Y2 Motivation CIEP Level Y3 Learning style learning time
study habits Y4 Knowability Learnability,
Understandability Memorability Y5 Operability Ease of use
Effectiveness Flexibility Y6 Efficiency User workload
Efficiency Productivity Y7 Robustness Error Management
Trustfulness Errors
Y8 Safety Safety
Secure Comfortable Y9 Subjective
Satisfaction
Attractiveness Compliance Satisfaction Y10 Media element Usefulness
Completeness Increase Y11 Communicativeness Simple
Intuitive Perceptive Y12 User Expectation User need
Capability Expectation
4. Results and Analysis
The questionnaires was distributed to 125 ELS language Center students in Malaysia who
come from 13 countries (Figure 4). The minimum sample size recommended [19] for the sample in this study, depending on the number of variables to be studied. The formula is as follows: k (k+1) / 2, where k is the number of variables. it needs at least samples to calculate the minimum model of in this research is 12 (12 +1) / 2 = 78 samples.
Fig 4. Research Respondents
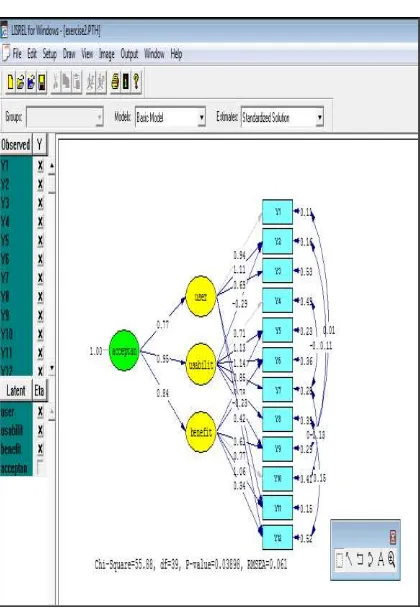
Fig. 5 Model I Initial Measurement
Fig 6. Model II Suggestion Measurement
TABLE III
RESEARCH HYPOTHESIS RESULTS
Name Lambda
Gamma t value
0
H
Hypothesis ResearchKnowledge ability
2.90 *
Motivation 1.18 5.41 rejected H21 accepted Learning style 0.66 7.20 rejected H31 accepted Know-ability 1.21 6.98 rejected H42 accepted Operability 0.84 6.12 rejected H52 accepted Efficiency 0.66 6.89 rejected H62 accepted Robustness 1.36 6.18 rejected H72 accepted Safety 0.84 6.32 rejected H82 accepted Subjective
Satisfaction
1.74 6.47 rejected H92 accepted
Media element 0.93 5.58 rejected H103 accepted Communicative 0.97 3.80 rejected H113 accepted User expectation 5.54 6.66 rejected H123 accepted
User style 0.73 8.09 rejected H134 accepted Usability 0.96 7.42 rejected H144 accepted User Benefit 0.80 7.04 rejected H154 accepted
TABLE IV VARIANCE EXTRACTED AND CONSTRUCT RELIABILITY OF MODEL Variables Construct Reliability
(>0.70)
Variance Extracted (>0.50)
User style 0.88 0.71
Usability 0.90 0.61
User Benefit 0.82 0.60
Acceptance 0.73 0.69
Based on the statistical data, the model of e-learning user interface, has a highly significant correlation values and strong construction between variables, which is evidenced by the size of the construct reliability values above 0.70 and the value of its variance extracted 0.50. T value exceeds the critical value also has a significant level of 1.96 to 0.05 which means that the relevant variables significantly related to the concept of design-related. The high load factor (0.70) of each variable also proves the strength of the relationship between variables with its constructs (table III and table IV).
Research generates model was estimated before we tested the Goodness of fits of the user interface acceptance model by using LISREL v8.80. The result of GOF measurement in this study also described information about the guidelines and limits the admissibility of GOF levels as shown in Table V.
covariance matrix. Chi-square is a measure of the the model has a negative value of GFI is the worst model of all existing models [10]. The model has a GFI values > 0.90 indicate a good model fit.
TABLE V
GOFSTATISTICS FOR E-LEARNING INTERFACE ACCEPTANCE MODEL. NCP Smaller grades is better 146.76 16.88 SNCP Smaller grades is better 1.82 0.51
GFI GFI
0.90 0.78 0.93RMSR RMSR
0.05 0.80 0.31 RMSEA RMSEA < 0.08 0.158 0.061 ECVI Smaller grades is better 2.19 1.16Incremental Fit Measures
TLI or NNFI NNFI
0.90 0.90 0.98Parsimonious Fit Measures
PGFI Higher grades is better 0.51 0.46 Normed X2 Minimun grades: 1.0
Maximum grades: 3.0
4.10 1.50
PNFI Higher grades is better 0.69 0.57 AIC Smaller grades (positive) is
better
251.76 133.88
CAIC Smaller grades (positive) is better
353.10 280.27
Adjusted Goodness of Fit Index (AGFI) is the same as GFI, but had to adjust the influence of degrees of freedom in a model. Fit model is one that has the value of AGFI = 0.90. RMSEA is an indicator of model fit most informative. RMSEA measures the deviation of the parameter values in a model with population covariance matrix. RMSEA values> 0.05 identifies the model fit and RMSEA values ranging between 0.08 states that the model has a forecast error rasionable. RMSEA values ranged from 0.08 to 0.1 indicates that the model had sufficient fit, but if the value of RMSEA> 0.1 states that the value of a model fit very ugly.
Expected cross validation index (ECVI) was used to assess the trend that the model, in a single sample, can be cross-validated on the sample size
and the same population. ECVI measures the deviation between the fitted (model) covariance matrix of the sample being analyzed and the covariance matrix that would be obtained in other samples but has the same sample size. ECVI value models ECVI lower than that obtained in the model saturated and independence models, indicating that the model is fit. AICand CAIC are used to assess the issue of parsimony in the assessment of model fit. AIC and CAIC are used in the comparison of two or more models, where the value of AIC and CAIC smaller than the AIC model of saturated and independence means having a better model fit.
Normed Fit Index (NFI) and the normed Fit Index (NNFI), is used to overcome the problems arising from the complexity of the model. Similarly, Incremental Fit Index (IFI) is used to overcome the problem of parsimony and sample size associated with NFI. While Relative Fit Index (RFI) is used to measure the fit where values between 0 and 1.
5. Conclusions and Recommendations
5.1. Conclusion
This paper presents how to develop the construct model among user’s style, usability and user benefit as indicator variables to measure the latent variable of user e-learning interface acceptance. According to research questioners analysis and Goodness of Fit measurement, it is shown that the high reliability in this study indicates that an indicator variable has a consistently high in measuring latent constructs. Test reliability by using two types of measurements that measure construct composite reliability and variance extracted measure. According to t-value, loading factors, and the relative suitability value of each structural equation model, we can conclude that the interface User Acceptance Model for E-learning in this study can be accepted.
5.2. Recommendations
References
[1] Virginio C., Massimo C., Marco P., Perspectives and Challenges in E-learning: towards Natural Interaction Paradigms, Journal of Visual Languages and Computing 15 (2004) 333–345
[2] Graham, C. Blended learning systems. Definitions, current trends and future directions. In C. Bonk & C. Graham, The handbook of blended learning: Global perspectives, local designs. 2006 San Francisco: John Wiley and Sons.
[3] Guralnick, D. “How to Design Effective,
Motivating User Interfaces.” American Society for Training & Development TechKnowledge Conference, 2006. Denver, CO.
[4] A. Seffah, Moh. Donyaee, R.B. Kline, Harkirat K. Padda. Usability measurement and metrics, A consolidated model, Software Qual J, 14: 159–178. 2006
[5] B. Olga. A. The metrics for quantitative evaluation of user interface usability construction methodology. SPECOM: 9th Conference Speech and Computer St. Petersburg, September 20-22, 2004. Russia [6] Dedic-Marcovic, Influence of learning styles
on graphical user interface for e-learning. Modern Business School Belgrade, Serbia 2012.
[7] Sfenrianto, Hasibuan ZA, Suhartanto H., The Influence Factors of Inherent Structure in E-Learning Process. International Journal of Education, E-business, Management and e-learning. 2011.
[8] Dagez & Baba, Applying Neural Network Technology in Qualitative Research for Extracting Learning Style to Improve E-learning Environment, IEEE. 2008.
[9] Yang, Ping and Kong et.al. Study on personality learning in E-learning. International Conference on E-Learning, E-Business, Enterprise Information Systems,
and E-Government, 2009.
[10] Ma,Wang and Liang. The e-Learning System Model Based on Affective Computing, Seventh International Conference on Web-based Learning, 2008.
[11] Nielsen, J. Usability Engineering. CA: Academic Press, 1993. San Diego
[12] Park and Lim, A structured methodology for comparative evaluation of user interface designs using usability criteria and measures, International Journal of Industrial Ergonomics 23:379-389, 1999.
[13] D.Marghescu, Usability Evaluation of Information Systems: A Review of Five International Standards Information Systems Development: Challenges in Practice, Theory, and Education, Vol.1, 2009.
[14] A.Fernandez, E. Insfran, S. Abrahão. Towards a Usability Evaluation Process for Model-Driven Web Development, I-USED ’09, August 24, 2009, Upssala, Sweeden [15] Fernandez, Insfran, and Abrahão. Integrating
a Usability Model into Model-Driven Web Development Processes. Web Information Systems Engineering - WISE 2009.
[16] Ríos A, García A and Bonillo. Usability: A Critical Analysis and a Taxonomy. Intl journal of Human –Computer Interaction 26(1), 53–74, 2010
[17] K Marçal de Oliveira. New research challenges for user interface quality evaluation Interaction Homme-Machine ACM New York, 2010. USA Computer Society pp. 287–294 ISBN: 978-1-4503-0410-8 IEEE
[18] Shin H. Dong, Kim T & Jung S. Towards a Conceptualizing Social Presence in 3DTV. iConference 2011, February 8-11, 2011, Seattle, WA, USA