Journal of Economics and Policy http://journal.unnes.ac.id/nju/index.php/jejak
Measuring Export Competitiveness of Yarn Commodities and
Textile Industry of Central Java in World Market
Hertiana Ikasari1, Ngatindriatun2
1Faculty of Economics and Business, University of Dian Nuswantoro Semarang, Indonesia
2Doctor of Research in Management, University of Bina Nusantara
Permalink/DOI: http://dx.doi.org/10.15294/jejak.v9i2.7629
Received: Februari 2016; Accepted: March 2016; Published: September 2016
Abstract
Yarn commodities and textile industries are the main export commodities of Central Java. Nevertheless, there are still some problems to face. The purpose of this research is to analyze the market share and competitive advantages position of the yarn commodities and the textile industries of Central Java in the world market. The Acceleration Ratio (AR) and Trade Specialization Index (TSI) are used to analyze the export competitiveness of the yarn commodities and the textile industries. The results obtained indicates that AR of the export of yarn commodities and textile industries of Central Java is greater than 1 (AR> 1). TSI of yarn commodities and textile industries in Central Java is 0.45 and has positive value. These results indicates that Central Java has a strong market share and tends to be a regional exporter of yarn and textile commodities in the world market.
Keywords: Export competitiveness, yarn and textile commodities, acceleration ratio, trade specialization index
How to Cite: Ikasari, H., & Ngatindriatun, N. (2016). Measuring Export Competitiveness of Yarn Commodities and Textile Industry of Central Java in World Market. JEJAK: Jurnal Ekonomi Dan Kebijakan, 9(2), 262-278. doi:http://dx.doi.org/10.15294/jejak.v9i2.7629
© 2016 Semarang State University. All rights reserved
Corresponding author :
Address: Jl. Nakula I No. 5-11 Semarang, Indonesia E-mail: [email protected]
INTRODUCTION
The foreign trade plays an important role in actuating the economy because it is not only the foreign exchange earner but also the employment provider. Besides, the foreign trade also has a multiplier effect in other sectors besides the agriculture, mining, industry, service, and finance. Considering the importance of foreign trade in the economy, the foreign trade activities become one of the
backbone of the national economy
(Department of Commerce, 2005).
The economic growth of Central Java Province after 1999 always grows positively, which is determined by a variety of macro indicators, including non-oil and gas exports that tend to increase. The government policies to encourage the exports, especially non-oil and gas exports strongly support the health of the economy of Central Java. One effort to reduce the sensitivity level of Central Java’s economy on overseas economic turmoil is by
steering the government policy on
diversification of non-oil and gas exports (Rejekiningsih, 2012).
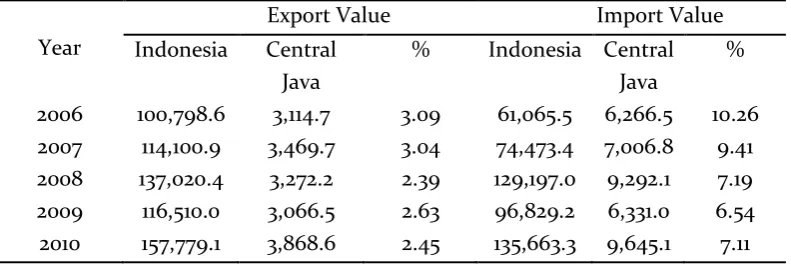
The foreign sector plays an important role in the economy of Central Java Province. In Table 1, it is seen that during 2006 to 2010 the value of exports and imports fluctuated. Similarly, the contribution of exports and
imports value on the total national of exports and imports also fluctuated. Although the value of exports and imports fluctuated, the economy of Central Java Province could be said to be an opened economy. Consequently, the changes or fluctuations in the world trade will affect economic activity in Central Java. The sensitivity of Central Java economy is still aggravated by the fact that the exports only consist of a group of goods, with the oil as the highest export earner (Rejekiningsih, 2012).
By sector, the export of industrial products is the biggest contributor of Central Java’s non-oil and gas export revenues, especially for the yarn commodities and the textile industries. In Table 2, it is seen that the value of exports commodities of Central Java mostly increased from 2009 to 2010, except for the mining and quarrying commodities that decreased. Commodities that had the largest contribution on the total exports of Central Java were the yarn commodities and the textile industries amounted 40.7% in 2010. It can be said that the yarn commodities and the textile industries are the export concentration of Central Java Province.
TPT industry is the industry which role cannot be ignored. There are about 98,000 units of small and medium enterprises (SME) that pursue this industry.
Table 1. The Percentage of Exports and Imports value in Central Java on Indonesian Total Exports and Imports in Year 2006-2010 (Million US $).
Year
Export Value Import Value
Indonesia Central
Java
% Indonesia Central
Java
%
2006 100,798.6 3,114.7 3.09 61,065.5 6,266.5 10.26
2007 114,100.9 3,469.7 3.04 74,473.4 7,006.8 9.41
2008 137,020.4 3,272.2 2.39 129,197.0 9,292.1 7.19
2009 116,510.0 3,066.5 2.63 96,829.2 6,331.0 6.54
2010 157,779.1 3,868.6 2.45 135,663.3 9,645.1 7.11
The data shows that SME-TPT is able to provide 490,000 employments with the production value of 14.7 billions and the exports of US$ 900 millions. The large-scale industry in this business is generally the labor intensive and relies on the cheap labors. The total employment of TPT industry is estimated to reach 3.2 millions. In short, TPT industry has an important role in absorbing the labors, creating the added value, and generating the foreign exchange. It is not exaggerating to mention TPT industry as the belle of non-oil and gas exports and the employment provider in Indonesia (Kuncoro, 2007).
In order to build a strong and high competitiveness yarn and textile industry, there are many challenges or problems that must be faced. The first problem, Central Java’s exports are concentrated on certain export markets, namely the United States that is vulnerable to the economic turmoil and the global financial. The second problem, the invasion of imports from China. Similar products from China set much lower price with the same quality. In the development of the past few years, the yarn and textile industries experience slower exports growth than the main competitor countries like China.
Table 2. The Value and Percentage of Export Commodities Group of Central Java in Year 2009-2010 (US $)
No Comodity 2009 2010 Changes
Value % Value % %
01 Husbandry 88.279.980 2,88 94.511.740 2,44 7,06
02 Farming and Forestry 101.779.406 3,32 108.298.282 2,80 6,40
03 Mining and Quarrying 33.980.469 1,11 8.662.674 0,22 -74,51
04 Food, beverage, and
tobacco industry
82.424.937 2,69 95.556.610 2,47 15,93
05 Yarn and textile industry 1.163.164.754 37,93 1.572.524.432 40,7 35,19
06 Wood, cork and straw 432.998.973 14,12 529.819.261 13,7 22,36
07 Paper industry 29.733.454 0,97 42.869.900 1,11 44,18
08 Leather and bark industry 11.635.234 0,38 14.633.909 0,38 25,77
09 Chemical, plastic and
rubber industry
142.230.482 4,64 184.659.747 4,77 29,83
11 Refined fuel oil 181.162.818 5,91 194.549.112 5,03 7,39
12 Private equipments 18.579.211 0,61 19.682.864 0,51 5,94
13 Mineral and rock industry 64.415.039 2,10 67.246.292 1,74 4,40
14 Metal industry 18.402.170 0,60 24.225.733 0,63 31,65
15 Machinery, electricity and electronic industry
103.689.304 3,38 132.634.988 3,43 27,92
16 Vehicle dan spare part 302.814 0,01 1.003.314 0,03 231,33
17 Other industry 593.680.487 19,36 777.712.683 20 31
TOTAL 3.066.459.532 100 3.868.591.541 100 26,16
The above shows that the yarn and textile industries of Indonesia in general and Central Java in particular should have higher competitiveness in order to be able to compete with similar industries from the competitor countries like China.
It is more difficult for the TPT products to enter the world market due to the declining competitiveness, especially with the emergence of the new competitor countries using the new technology, so that the value of Indonesian exports tends to be stagnant (about USD 7-8 MM/ year), while the market share of Indonesia is only about 2% of the world market share (BKPM, 2011).
The competitiveness of TPT industry can be seen from various aspects those are the competitiveness based on the price and the competitiveness based on the quality. In the price competitiveness, Indonesian's TPT is lost because of the increase in cost structure. The increase in cost structure faced by TPT industry, among others are, the increase in provincial minimum wage (UMP), the increase in fuel prices due to the policy of reducing subsidized fuel, the increase in electricity basic tariff. The UMP increase would be felt by TPT industry, especially the garment industry since it is the labor-intensive industries (BKPM, 2011).
Competitiveness is the ability of a commodity to enter the foreign market and the ability to survive in the market, in the sense that if a product has the competitiveness, the product is exactly what many consumers demanded (Tambunan, 2011). Based on Martin (Widodo, 1991 in Rejekiningsih, 2012), two indicators that can be used as a measurement of competitiveness are profit and market share. Great profit level indicates that the industry is capable of creating efficiency and effectiveness in the production process that is seen in the
increase of production capacity. High
production capacity can meet the demand of its market share, expand the market share, and increase the profits. With the condition of maximum benefit and comprehensive coverage of market share, the industry is able to outperform its competitors and demonstrate the ability of pretty good competitiveness.
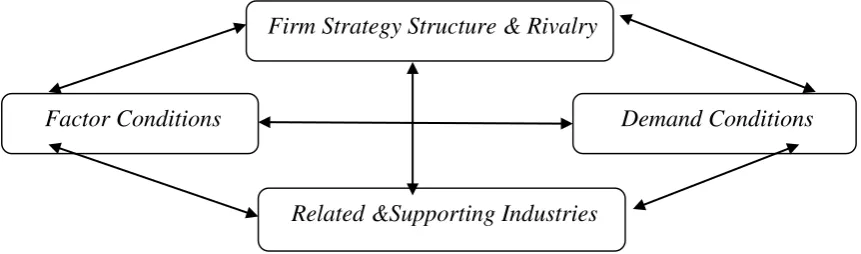
According to Michael Porter, in the era of global competition nowadays, a nation or a country that has competitive advantage of nation may compete in the international market when it has four determining factors, among others: endowment (supporting) factor or factor conditions, demand conditions, relating and supporting industries and firm strategy structure and rivalry (Ekananda, 2015). Endowment (supporting) factor is the condition of production factors such as skilled labors or infrastructure needs to compete in the industry. Porter distinguished between the basic factors (H-O theory) and advanced
factors (infrastructure of a country).
Disadvantages gift of nature have led the nations to invest in the creation of advanced factors, such as education, labor force, free port and advanced communication system, to allow their industries to compete globally (Ekananda, 2015).
Demand condition is the demand for the products and services in the country. Porter stressed that home demand plays a role in
improving the quality of competitive
advantage. The companies are most sensitive to the needs of their immediate customers. Porter argued that it is the national company’s competitive advantage if their domestic consumers are advance and demand, forcing the company to have high standard on the product quality and to produce innovative models (Ekananda, 2015).
competitive. The advantages of investing in the factors of advanced production by the related and supporting industries can pour out into an industry, thus helping them to achieve a strong and competitive position internationally (Ekananda, 2015).
Firm strategy structure and rivalry (strategy, structure and rivalry of companies). The governance conditions shape how the companies are created, organized, managed and understand the conditions of domestic competition. Porter also stipulated that the governance may influence each componen of the diamond (Ekananda, 2015). The Diamond-Porter scheme can be seen in Figure 1. (Ekananda, 2015).
Judging from the existence of the advantages in competitiveness, the advantages competitiveness of a commodity are classified into two kinds those are natural advantage / absolute advantage and developed advantage
(acquired advantage). At this time the natural
advantages or absolute advantages posessed by a country for one of its commodity do not directly cause these commodities dominate the world market share because the number of producers is not only one country, but there are
some countries that also produce these commodities with the same natural advantages conditions. To be able to compete in the world market, a commodity must have other advantages besides the natural advantages that is competitive advantage. The competitive advantage of a commodity is an advantage that can be developed, so this advantage should be created to be able to have it.
Comparative advantage is a central concept in the international trade theory, which states that a country or region should specialize in the production and export the goods and services that can be produced at the cost relatively more efficient than other goods and services; and import the goods and services that do not have comparative advantage.
This theory was first proposed by David Ricardo in 1817 as a basis for improving the economic welfare of the population through international trade. The theory of comparative advantage generally supports the specialization of production in a country based on the intensive utilization on the basis of production factors which is relatively dominant owned included the accumulation of physical capital and research (Salvatore, 2014).
Figure 1. Diamond-Porter Scheme. Source: Ekananda, 2015.
Firm Strategy Structure & Rivalry
Factor Conditions
Demand Conditions
According to David Ricardo (Hady, 2009), the trade can be done by the countries that do not have an absolute advantage in both commodities traded by conducting product specializationin which its absolute loss is smaller or having comparative advantages. This is known as the Law of Comparative Advantage. Comparative advantage is divided into cost comparative advantage (labor efficiency) and production comparative advantage (labor
productivity). According to the cost
comparative advantage (labor efficiency) theory, a country will get a benefit from the
international trade if conducting a
specialization in the production and exporting goods where the country can have more efficient production and importing goods where the country is relatively less productive or not efficient. Based on the production comparative advantage (labor productivity) analysis, it can be said that a country will get a benefit from the international trade if conducting a specialization in the production and exporting goods where the country produces more productively and importing goods where the country produces relatively little or not productive. In other words, the cost comparative advantage emphasizes that the comparative advantage will be achieved if a country produces a product that requires less amount of labor hours than other countries resulting in production efficiency. The production comparative advantage emphasizes that the comparative advantage will be achieved if a labor in one country can produce more goods / services compared to other countries so that does not require more labors. Thus trading profits are earned if a country conducting a specialization on goods that have cost comparative advantage and production advantage or by exporting goods that its comparative advantage is high and importing goods that its comparative advantage is low.
In the export of a country, either the always different from other countries. In some countries, the exports are very important, which covers a significant portion of the national income. But in some other countries, its role is relatively little (Sukirno, 2013).
A country can export its goods production to another country if the goods are needed by other countries and they cannot produce the goods or the production cannot meet the domestic needs. Another factor is the ability of the country to issue the goods that can compete in foreign markets. It means that the quality and price of the goods exported must be at least as good as those sold in the foreign markets. The taste of the people abroad on the goods exported abroad is very important for its role in determining a country's exports. In general, it can be said that the more types of goods that have such privileges produced by a country, the more exports that can be conducted (Sukirno, 2004).
batik export by using RCA and ISP. Turukay (2010) examined the export competitiveness of Indonesian copra in the world market by using RCA, AR, ISP and trend analysis. Lubis and Nuryanti (2011) examined the impact of CAFTA and cocoa trade policy in the domestic market and China. While Rejekiningsih (2012) discussed the export concentration of Central Java province by using the Revealed Comparative Advantage (RCA) Index, Constant Market Share (CMSA), and Net Export Share (NXS). Kellman and Shachumurove (2012) examined Montenegrian Trade specialization index by using Trade Spcialization Inex (TSI). Mirela (2013) conducted a research on Evaluation of the Romanian Agricultural Products Specialization In The Intra-Sectoral Foreign Trade by using RCA and TSI. Sarwono and Pratama (2014) examined the factors affecting the competitiveness of Indonesian soybean from 1983 to 2013 by using the Ordinary Least Square.
Based on the background and the formulation of the problem above, the objectives to be achieved in this research are to analyze the advantages of the market share and the competitiveness position of the yarn commodity and textile industry of Central Java in the world market.
RESEARCH METHODS
The data used in this research is secondary data obtained from the Central Bureau of Statistics of Central Java Province. The secondary data used are data of export and import values of yarn commodities and textile industry with Harmonized System (HS) code of Central Java Province in 2006-2011.
The classification of the textile industry and textile products (TPT) is based on the trading using The Harmonized Commodity
Description and Coding System abbreviated HS (Harmonized System) that is the result of the Custom Cooperation Council of all GATT members.
The analysis tools used are the
Acceleration Ratio (AR) and Trade
Specialization Index (TSI). The Acceleration Ratio (AR) indicates whether a country can seize the overseas markets (in the sense of being able to defeat the competitor countries) or its position in the export market or the domestic market is getting weak. The Acceleration Ratio is the ratio of acceleration or ratio of increasing speed. The use of acceleration ratio index or the ratio of increasing speed is to indicate whether a country can seize export market (in the sense of being able to defeat the competitor countries), or its position in the export market or in the domestic market is getting weak. Mathematically, AR index can be calculated as follows (Tambunan, 2004).
AR = ((trendXij) + 100) / ((trendMij) + 100) ... .. (1)
In which:
Xij: The commodity’s export value of i country / j region
Mij: The commodity’s import value of i country / j region
it can be formulated as follows: (Tambunan, yarns and textiles commodities are said to have strong competitiveness or Central Java tends to be the exporter of yarn and textile, on the other hand if the index value is negative (below 0 to -1), it means that the competitiveness of the yarns and textiles commodities of Central Java is low or Central Java tends to be the importer country.
The TSI index can also be used to identify the growth rate of a commodity in a trade which is divided into five stages, as follows:
1. Recognition stage (-1 <TSI <-0.5)
When an industry (forerunner) in a country (call it A) exports new products and industry of recent migrant (latecomer) in country B imports these products. 2. Import substitution stage (-0.5 <TSI <0)
At this stage, the industry in country B shows the very low competitiveness because the production level is not high enough to achieve its economic scale. The industry exports the products with less good quality and the domestic production is still smaller than domestic demand. In other words, for these commodities at this stage country B imports more than exports.
3. Export expansion (growth) stage (0 <TSI <+0.8)
Industry in country B conducts large-scale production and starts to increase its exports. In the domestic market, the
bidding for these commodities is greater than the demand.
4. Independence (maturity) stage (0.81 <TSI <1)
At this stage, the product is already at the stage of standardization regarding the technology contained. At this stage, country B is the net exporter.
5. Re-import (1> TSI <0)
At this stage, the industry in country B losses in competing in the domestic market with the industry of country A, and its production in the country is less than domestic demand.
RESULTS AND DISCUSSION
Broadly speaking, TPT industry includes three sections (a) the upstream sector, (b) the intermediate sector and (c) the downstream sector (BKPM, 2011):
a. Upstream Sector
Included in the fibers and yarns industries are:
o Natural fibers industry, which produces
the natural fibers such as cotton, silk, hemp, wool etc,
o Staple artificial fibers industry, which
processes PX, PTA, MEG and wood pulp into short fibers such as polyester, nylon, rayon etc,
o Filament yarn industry, which processes
PX, PTA, MEG and wood pulp into filament yarns such as polyester, nylon, rayon etc,
o Spinning industry, which produces the
yarns from the raw material such as o artificial fibers or natural fibers or the
mixture of both
o Yarn dyeing industry to give color effect on
the yarn.
machinery and the added value is the greatest. b. Intermediate industry
Included in the intermediate industry is an industry that produces cloth, among others are:
Weaving industry, which processes yarn into raw woven fabric (grey fabric),
Knitting industry, which processes the yarn into raw knit fabric (grey fabric),
Dyeing industry, which processes the raw
fabric into semi-finished cloth by giving the color pattern effect on the cloth,
Printing industry, which processes the raw fabric into semi-finished cloth by giving the color pattern effect on the cloth,
Refinement (finishing) industry, which processes semi-finished cloth into finished cloth (finish fabric),
Non-Moven industry, which processes the
fiber or yarn into cloth either by the process of weaving or knitting
The nature of the semi industry in capital, intermediate, and modern technology continues to grow and the number of their employees is greater than the upstream industry sectors. This segment is also solid capital but absorb more labors than the upstream sector. The printing segment emphasizes the aspect of creativity while dyeing segment management of waste management that requires large amount of cost is needed.
c. Downstream industry
Included in the downstream industry is an industry that produces finished textile goods of people consumption, among others are:
The apparel (garment) industry, which processes finished fabric into garments both knit and woven fabrics,
Embroideri industry, which gives motive or pattern effect on finished fabric or finished textile goods,
Other textile products industry, which processes finished fabric into other textile products other than garment
Apparel manufacturing industry
(garment) includes the process of cutting, sewing, washing, and finishing that produces the ready-mode garment. This sector absorbs the most labors so the nature of the industry is labor intensive.
Java remains the priority of TPT industry
development because of the support
infrastructure, the availability of energy and the availability of skilled labor. On Java island, TPT industry in fact has formed industrial clusters ranging from upstream, intermediate and downstream aglomerate in a particular area as seen in the South Bandung, Cimahi, Pekalongan, South Semarang, Solo Raya and Tangerang.
Banten, Central Java and East Java are prioritized for the development of supporting industries such as artificial fiber industry. To develop the artificial fiber industry needs sufficient water, quite extensive location, quite a lot of energy and waste disposal facilities.
The development of dyeing, printing and finishing (textiles intermediate) industries are directed to the area of Banten,
West Java, Central Java and Yogyakarta. For the development of this industry needs enough water, quite extensive location, supporting energy and waste disposal facilities.
Infrastructure in Central Java is still good
Local government policy. Investment
policies in Bandung, especially in TPT sector is considered not conducive since the industry is considered disturbing the surrounding community.
The awareness of the bureaucrats on the importance of investment services in the region help accelerate the realization of the investment.
The implementation of regional autonomy
in Central Java, especially in Sragen, Karanganyar and Sukoharjo which become the center of TPT industry is good enough in which the local government is very supportive for the new investment. For example, in Sragen, investment licenses only takes 3 days.
Surakarta government policy that supports
the development of TPT industry in Central Java:
1. Exemption levy permit for small,
medium, and large industries.
2. The use of domestic production,
especially for employees of the Government of Surakarta, three days in a week of working time.
The differences in provincial minimum
wage levels reaches about 30%. Because the level of industrialization in West Java is more advanced than in Central Java.
Problems of working culture: in West Java, the position of the labor union is so
dominant that often hamper the
effectiveness of the company. While the position of labor union in Central Java has not been so significant that is supported by more diligent character of the labors.
In terms of products, TPT industry in Central Java is more specialized in the segment of medium low in which their products are more simple that rely on the middle market
share. To anticipate the growing need for human resources ready to work for the garment industry in Central Java, the Government of Central Java Province in 2008 founded the Center for Human Resources Development and IKM Product based on Central Java Governor Regulation No. 37 year 2008 dated June 20, 2008. The center currently managed by the
Department of Industry and Trade
(Disperindag) of Central Java has already scored thousands of ready to work labors.
During this time the garment industry sector in Central Java has provided substantial contribution, which is about 14% of the local revenue (PAD). The garment industry in Central Java which conducts relocation or expansion businesses to Central Java requires ready to work human resources. Textile and apparel industries are priority of industrial sector in Central Java province. Data from Disperindag Central Java showed that in 2009 in textile industry sector there were 718 business units that were able to absorb 154,964 workers and produced an output of Rp 30.531 billions While the apparel sector in the same year there were 913 business units that absorb 95,236 workers and produced an output of Rp 9.35 billions.
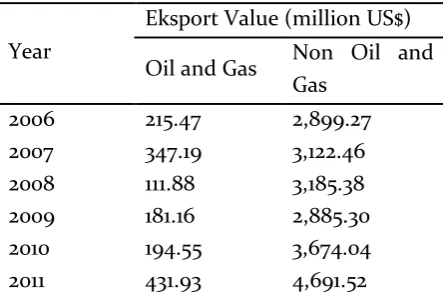
Table 3. Oil and Gas and Non-Oil and Gas Exports of Central Java 2006-2011 (million US$)
Year
Eksport Value (million US$)
Oil and Gas Non Oil and Source: Central Bureau of Statistics
While oil and gas exports increased 131.72 million USD, or increase 61.13%. The total value of Central Java exports in 2008 was recorded 3,297.25 million USD, consisted of non-oil and gas exports amounted to 3,185.38 million USD with the role of 96.61% to the total value of exports and the rest of 111.88 million USD from exports of oil and gas. When compared to the total export value of Central Java in 2007 reaching 3,469.65 million USD, reflecting the drop of 172.40 million USD or a decrease of 5.23%. In such circumstances, the export value of non oil and gas increased by about 62.91 million USD, or increase about 1.98%. While the oil and gas exports decreased to 235.31 million USD or decreased 210.33%.
The total export value of Central Java in 2009 was 3,066.46 million USD, consisted of non-oil and gas exports amounted to 2,885.30 million USD with the role of 94.09% to the total value of exports and the rest of 181.16 million USD from the exports of oil and gas. When compared to the total export value of Central Java in 2008 that reached 3,297.25 million USD, a decrease of 7.00% is seen. In such circumstances, the export value of non oil and gas increased by about 38.25%, while oil and gas exports decreased 10.40%.
The total exports value of Central Java in 2011 amounted to 4,691.52 million USD, consisted of non-oil and gas exports amounted to 4,259.59 million USD with the role of 90.79% to the total value of exports and the rest of 431.93 million USD from the exports of oil and gas. When compared to the total export value of Central Java in 2010 that reached 3,868.59 million USD, an increase of 21.27% is seen. In such circumstances, the export value of non oil and gas increased by about 15.94%, while oil and gas exports increased 122.02%.
The development of Central Java import both oil and gas and non-oil and gas can be seen in Table 4 below:
Table 4. The Imports of Oil and Gas and Non-Oil and Gas of Central Java 2006-2011 (million
US$).
Year
Ekspor Value (Million US$)
Oil and Gas Non Oil and Source: Central Bureau of Statistics
Based on Table 4, the value of Central
commodities increased respectively by 5.13% and 45.67% from the previous year.
31.87% from 2008. The value consists of oil and gas commodities amounted to 3,861.85 million USD and the remaining non-oil and gas amounted to 2,469.19 million USD. Oil and gas commodities decreased in the value of imports amounted to 43.53%, while non-oil and gas increased 0.64% from the previous year.
The imports value of Central Java in 2011 amounted to 13,027.06 million USD, increased 35.06% from 2010. The value consisted of oil and gas commodities amounted to 8,558.99 million USD and the remaining non-oil and gas amounted to 4,468.07 million USD. Oil and gas commodities increased the value of imports amounted to 53.57%, while non-oil and gas increased 9.74% from the previous year.
Here is the development of yarn and textile industry commodities exports of Central Java from year 2006 to 2011. Based on Table 5, it is seen that the exports value of yarn and textile industry commodities fluctuated. The highest export value was in 2011, which amounted to US$ 1.864.521.024.
Table 5. The Export Value and Percentage of Yarn and Textile Industry Commodities of
Central Java Year 2006-2011 (US $)
Year Value %
2006 1,193,905,055 38.33
2007 1,309,419,321 37.74
2008 1,211,182,599 36.74
2009 1,163,164,754 37.93
2010 1,572,524,432 40.65
2011 1,864,521,024 39.74
Source: Central Bureau of Statistics
While in 2009, the exports value of yarn and textile commodities decreased due to the global economic crisis that hit the United States and Europe. Similarly, the contribution of yarn and textile industry commodities exports to total exports fluctuated. The highest contribution of exports was in 2010, amounted to 40.65%.
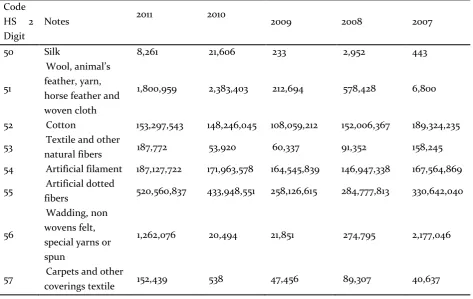
Table 6. Central Java Export According to Code HS 2 Digit 2007-2011 (USD) Code
HS 2 Digit
Notes 2011 2010 2009 2008 2007
50 Silk 8,261 21,606 233 2,952 443
51
Wool, animal’s
feather, yarn, horse feather and woven cloth
1,800,959 2,383,403 212,694 578,428 6,800
52 Cotton 153,297,543 148,246,045 108,059,212 152,006,367 189,324,235
53 Textile and other
natural fibers 187,772 53,920 60,337 91,352 158,245
54 Artificial filament 187,127,722 171,963,578 164,545,839 146,947,338 167,564,869
55 Artificial dotted
fibers 520,560,837 433,948,551 258,126,615 284,777,813 330,642,040
56
Wadding, non wovens felt, special yarns or spun
1,262,076 20,494 21,851 274,795 2,177,046
57 Carpets and other
58
Special woven fabrics, embroidery tapestry and lace
835,578 1,914,259 1,671,506 2,101,295 1,460,584
59
Coated textile fabrics, suitable for industry
1,250,456 266,251 125,529 544,403 2,390,871
60 Knitted and
crocheted fabrics 370,321 103,363 220,170 254,779 299,385
61
Goods and not knitted clothing accessories
180,816,079 137,738,116 132,576,908 136,447,645 127,037,911
62
Goods and not knitted clothing accessories
723,303,653 607,358,125 450,279,272 413,173,890 406,719,076
63
Other finished textile goods, finished textile
95,333,751 70,895,418 47,419,954 73,893,962 81,597,179
Source: Central Bureau of Statistics
Table 7. The Export Main Destination Countries of Yarn and Textile Industry Commodities of Central Java Year 2006 - 2011
(US$ Million).
Year The Main
Destination Country
Value (US$ Million)
% Toward Group
2007 United States 410.75 31.37
2008 United States 374.09 30.89
2009 United States 372.28 32.01
2010 United States 545.88 34.71
2011 United States 602.93 32.34
Source: Central Bureau of Statistics
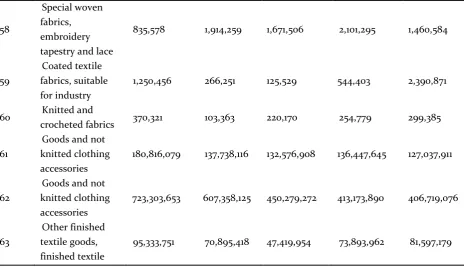
Based on the commodity groups of the yarn and textile industry based on HS 2 digit code, the goods and not knitted clothing accessory commodity has the largest export value compared to the others (Table 6). While based on the export main destination country, U.S takes over approximately 40 percent share of Central Java textile export (shown in Table 7).
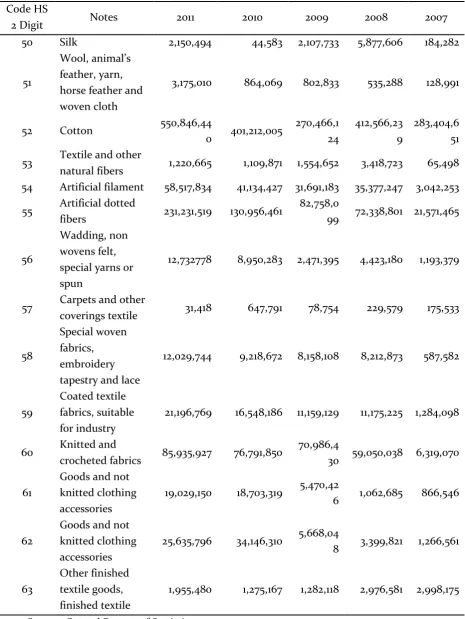
Below is the import development of yarn and textile industry commodities of Central Java from year 2006 to 2011. Based on Table 8, the greatest imports value was in 2011, which amounted to 1.025.69 million USD. Based on the commodity group of yarns and textile industries, cotton commodity was the most imported commodity (Table 9).
Table 8. The Import Value and Percentage of Yarn and Textile
Industry Commodities of Central Java Year 2006-2011 (US$ Million).
Year Value %
2006 166.93 2.66
2007 322.98 4.61
2008 618.30 6.65
2009 492.75 7.78
2010 741.59 7.69
2011 1025.69 7.87
Table 9. Central Java Imports According to the Code HS 2 Digit 2007-2011 (USD). Code HS
2 Digit Notes 2011 2010 2009 2008 2007
50 Silk 2,150,494 44,583 2,107,733 5,877,606 184,282
51
Wool, animal’s feather, yarn, horse feather and woven cloth
3,175,010 864,069 802,833 535,288 128,991
52 Cotton 550,846,44
0 401,212,005
270,466,1 24
412,566,23 9
283,404,6 51
53 Textile and other
natural fibers 1,220,665 1,109,871 1,554,652 3,418,723 65,498
54 Artificial filament 58,517,834 41,134,427 31,691,183 35,377,247 3,042,253
55 Artificial dotted
fibers 231,231,519 130,956,461
82,758,0
99 72,338,801 21,571,465
56
Wadding, non wovens felt, special yarns or spun
12,732778 8,950,283 2,471,395 4,423,180 1,193,379
57 Carpets and other
coverings textile 31,418 647,791 78,754 229,579 175,533
58
Special woven fabrics, embroidery tapestry and lace
12,029,744 9,218,672 8,158,108 8,212,873 587,582
59
Coated textile fabrics, suitable for industry
21,196,769 16,548,186 11,159,129 11,175,225 1,284,098
60 Knitted and
crocheted fabrics 85,935,927 76,791,850
70,986,4
30 59,050,038 6,319,070
61
Goods and not knitted clothing accessories
19,029,150 18,703,319 5,470,42
6 1,062,685 866,546
62
Goods and not knitted clothing accessories
25,635,796 34,146,310 5,668,04
8 3,399,821 1,266,561
63
Other finished textile goods, finished textile
1,955,480 1,275,167 1,282,118 2,976,581 2,998,175
While based on the main imports origin country, China is the country that the most importing the yarns and textile industries commodites to Central Java (Table 10).
Table 10. The Main Import Origin Country of Yarn and Textile Industry Commodities of Central Java Year 2006 - 2011 (Million US$).
Year The Main
Source: Central Bureau of Statistics
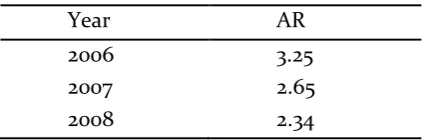
Based on table 11, it indicates that AR exports commodity of yarn and textile industry of Central Java was greater than 1 (AR> 1), it indicates that yarns and textiles commodities of Central Java had strong export market share. AR value of yarns and textiles commodities that are greater than one and positive, it illustrated the difference in the exports and imports the growth rate of yarn and textile products of Central Java in the world market, namely the exports growth rate of yarn and textile of Central Java was greater than the growth rate of imports.
Table 11. Acceleration Ratio of Yarn and Textile Industry Export Commodities of
Central Java 2006 – 2011.
Year AR
Despite having AR greater than one (AR> 1), but AR index was getting decrease and Specialization Index (TSI) of yarns and textiles commodities of Central Java was 0.45 and the value was positive, it means that the yarns and textiles commodities of Central Java had strong competitiveness in the export trade of the yarn and textiles commodities in the world market, or Central Java tends to be exporting areas.
Overall, it can be said that TSI of the yarn and textile industry commodity of Central Java was the stage III or stage of exports expansion (growth). This stage means that the industries in Central Java performed production on a large scale and began to increase their exports. In the domestic market, the bidding for these commodities are greater than the demand.
Table 12. Trade Specialization Index of Export Commodities of Yarn and Textile Industry of
Central Java 2006 - 2011.
CONCLUSION
The Acceleration Ratio of the yarn and textile industry export commodities of Central Java is greater than 1 (AR> 1). The Trade Specialization Inedx (TSI) of the yarn and textile commodities of Central Java is 0.45 and the value is positive. The results of AR and TSI indicate that Central Java has strong export market share and the industry of yarns and textiles commodities of Central Java is at the stage of export expansion (growth).
The yarns and textile industry
Commodities of Central Java are concentrated on few commodities, such as: goods and not knitted clothing accessories, dotted artificial fibers, cotton, artificial filaments, goods and knitted garment equipments.
Advice that can be given is that the entrepreneurs in the textile area in Central Java should try to open the new markets besides the United States. Furthermore, the government should give the policy in favor of the employers of yarns and textiles commodities from the upstream, intermediate and downstream sectors.
The limitation of this study is the short research period. For further research, it is recommended that years of research should be added and the researchers can use other
measurements to assess the exports
competitiveness of yarn and textile industry commodities of Central Java, such as Constant Market Share (CMS), Intra-industry Trade (IIT), Concentration Ratio (CR), etc. Besides, the more in-depth research of each sectors in the textile industry (upstream, intermediate and downstream) needs to be done.
REFERENCES
BPS. (2010). Statistik Ekspor Jawa Tengah. Semarang ____. (2011). Jawa Tengah Dalam Angka. Semarang BKPM. (2011). Kajian Pengembangan Industri Tekstil Dan
Produk Tekstil.
www.regionalinvestment.bkpm.go.id. Diunduh pada: 2 Juni 2016
Dumairy. (1996). Perekonomian Indonesia. Jakarta: Erlangga
Ekananda, Mahyus. (2015). Ekonomi Internasional. Jakarta: Erlangga
Hady, Hamdi. (2009). Ekonomi Internasional: Teori dan Kebijakan Perdagangan Internasional. Jakarta: Ghalia Indonesia
Kellman, H Mitchell, Shachmurove, Yochanna. (2012).
Montenegrin Trade Specialization Index. Available at http://ssrn.com/abstract=231346. Diunduh pada 3 Juni 2016
Kuncoro, Mudrajad. (2007). Ekonomika Industri Indonesia: Menuju Negara Industri Baru 2030?. Yogakarta: Penerbit Andi.
Lubis, Adrian Darmawan, Nuryanti, Sri. (2011). Analisis Dampak ACFTA dan Kebijakan Perdagangan Kakao di Pasar Domestik dan China. Analisis Kebijakan Pertanian, 9 (2), 143-156
Oktaviani, Rina, Widyastutik, Novianti, Tanti. (2008). Integrasi Perdagangan dan Dinamika Ekspor Indonesia ke Timur Tengah (Studi Kasus: Turki, Tunisia dan Maroko). Jurnal Agro Ekonomi, 26 (2). Rejekiningsih, Tri Wahyu. (2012) Konsentrasi Ekspor Provinsi Jawa Tengah. Jurnal Ekonomi Kuantitatif Terapan, 5(2), 109-118
Mirela, Rusali Adriana. (2013). Evaluation Of The Romanian Agricultural Products Specialization In The Intra-Sectoral Foreign Trade. Agricultural Economics and Rural Development, 10(1), 77-83 Salvatore, Dominick. (2014). Ekonomi Internasional.
Jakarta: Erlangga
Sarwono dan Pratama, Willy. (2014). Analisis Daya Saing Kedelai Indonesia. JEJAKJournal of Economics and Policy. 7 (2) (2014): 100-202
Sukirno, Sadono. (2013). Pengantar Ekonomi Makro. Jakarta : Raja Grafindo Persada
Suprihatini, Rohayati. (2005). Daya Saing Ekspor Teh Indonesia di Pasar Teh Dunia, Jurnal Agro Ekonomi, 23(1)
Tambunan, Tulus. (2004). Globalisasi dan Perdagangan Internasional. Bogor: Ghalia Indonesia
______________. (2011) Perekonomian Indonesia: Kajian Teoritis dan Analisis Empiris. Jakarta: Ghalia Indonesia
Turukay, Martha. (2010). Analisis Daya Saing Ekspor Kopra Indonesia di Pasar Dunia. Jurnal Budidaya Pertanian, 6(2)