Does Going Public Affect Innovation?
SHAI BERNSTEIN∗
ABSTRACT
This paper investigates the effects of going public on innovation by comparing the innovation activity of firms that go public with firms that withdraw their initial public offering (IPO) filing and remain private. NASDAQ fluctuations during the book-building phase are used as an instrument for IPO completion. Using patent-based metrics, I find that the quality of internal innovation declines following the IPO, and firms experience both an exodus of skilled inventors and a decline in the productivity of the remaining inventors. However, public firms attract new human capital and acquire external innovation. The analysis reveals that going public changes firms’ strategies in pursuing innovation.
DOES THE TRANSITION TO PUBLICequity markets affect innovation? This question is important given the critical role of innovation in promoting economic growth (Solow (1957)) and the prevalence of technological firms in the initial public offering (IPO) market over recent years.1 Although a large body of research
examines the performance of firms around their IPO, little is known about the effects of going public on innovation. This paper’s main contribution is to show that going public affects three important dimensions of innovation activity: the creation of internally generated innovation, the productivity and mobility of individual inventors, and the acquisition of external innovation.
Theoretically, in frictionless financial markets, selling equities publicly should have no bearing on subsequent innovation activity. Under financial fric-tions, however, the transition to public equity markets improves firms’ access to capital, which can lead to an increase in innovation activity, because such
∗Shai Bernstein is with Stanford University. I am deeply grateful to Fritz Foley, Josh Lerner,
Andrei Shleifer, and Jeremy Stein for their invaluable comments. I also thank Philippe Aghion, Effi Benmelech, Laura Field, Paul Gompers, Robin Greenwood, Sam Hanson, Oliver Hart, Victoria Ivashina, Dirk Jenter, Bill Kerr, Jacob Leshno, Gustavo Manso, Ramana Nanda, Francisco Perez-Gonzalez, David Scharfstein, Antoinette Schoar, Amit Seru, Adi Sunderam, Rick Townsend, and Jeff Zwiebel for helpful comments. I am grateful to seminar participants at Chicago University, Columbia University, Dartmouth College, Entrepreneurial Finance and Innovation Conference, Harvard Business School, Hebrew University, London Business School, London School of Eco-nomics, NBER Productivity Lunch, Northwestern University, Searle Conference on Innovation and Entrepreneurship, Stanford University, Tel-Aviv University, University of British Columbia, and University of Pennsylvania for helpful comments and suggestions. Andrew Speen provided superb research assistance. I am grateful for funding from the Ewing Marion Kauffman Founda-tion.
1Approximately 40% of all firms that have gone public in the last 40 years are technological firms.
DOI: 10.1111/jofi.12275
may reflect reversion to the mean and thereby mix life cycle effects with the IPO effect.
To overcome this selection bias and estimate the IPO effect on innovation, I construct a sample of innovative firms that file an initial registration statement with the Securities and Exchange Commission (SEC) in an attempt to go public, and then either complete or withdraw their filing. Combined with standard patent-based metrics, this sample allows me to compare the innovation activity of firms that go public with that of private firms that intended to go public and hence are at a similar stage in their life cycle. Of course, comparing complete and withdrawn IPO filings introduces a new bias associated with the decision of firms to withdraw the IPO filing and remain private.
To address this concern, I use NASDAQ fluctuations over the two months fol-lowing the IPO filing date as an instrument for IPO completion, relying on fil-ers’ sensitivity to aggregate stock market movements during the book-building phase. Consistent with prior literature, I find that these short-run NASDAQ fluctuations strongly predict IPO completion, with the effect concentrated at market declines (e.g., Busaba, Benveniste, and Guo (2001), Benveniste et al. (2003)). In the analysis, the IPO effect is identified from differences in long-run innovation (i.e., innovation over a five-year period) between firms that file to go public in the same year but experience different postfiling NASDAQ returns.
For the instrument to be valid, it needs to satisfy the exclusion restriction condition, that is, two-month NASDAQ returns must be related to the long-run innovation measures only through the IPO completion choice. I find empirical support for the validity of the instrument (see Section II.C for a detailed dis-cussion). While reduced-form analysis shows that the instrument significantly explains long-run innovation, it may also affect innovation through other chan-nels. To the extent that this is the case, two-month NASDAQ returns should also explain long-run innovation outside the book-building phase. A placebo test reveals that outside the book-building phase, when ownership choice is fixed, NASDAQ returns have no effect on long-run innovation. This finding is
consistent with the notion that short-term NASDAQ returns during the book-building phase affect long-run innovation only through the IPO completion choice.
Using the instrumental variables approach, I find a significant link between public ownership and innovation: going public causes a substantial 40% decline in innovation novelty as measured by patent citations. At the same time, I find no change in the scale of innovation, as measured by the number of patents. These results suggest that the transition to public equity markets leads firms to reposition their R&D investments toward more conventional projects.
Having shown that going public affects the composition of innovative relative to conventional projects, I study the effects of going public on individual inven-tors’ productivity and mobility over time. I find that the quality of innovation produced by inventors who remain at the firm declines following the IPO, and key inventors are more likely to leave. The firms that go public are also more likely to generate spin-off companies, suggesting that inventors who leave re-main entrepreneurial. These effects are partially mitigated by the ability of public firms to attract new inventors.
I also find a stark increase in the likelihood that newly public firms acquire companies in the years following an IPO. To better understand whether these acquisitions are used to purchase new technologies, I collect information on targets’ patent portfolios. I find that public firms acquire a substantial number of patents through M&A: acquired patents constitute almost a third of firms’ total patent portfolio in the five years following the IPO. The acquired patents are of higher quality than the patents produced internally following the IPO.
These results suggest that the transition to public equity markets affects the strategies that firms employ in pursuing innovation. While publicly traded firms generate more incremental innovation internally, they also rely more heavily on acquiring technologies externally. This shift takes place concurrent with a substantial inventor turnover after the IPO.
What leads to these changes? A stock market listing may increase the scope for agency problems, leading firms to pursue less innovation following the IPO (Berle and Means (1932), Jensen and Meckling (1976)). Alternatively, agency problems may be concentrated in private firms that pursue too much inno-vation. Finally, it may be the case that the results are not driven by agency problems, but rather the improved access to capital allows firms to focus on commercialization after the IPO. Such a strategy is not viable for firms that remain private and therefore focus on innovation only. I discuss these hypothe-ses in detail in Section IV. I find supportive evidence for managerial career concerns, consistent with recent papers on agency problems in public equity markets (e.g., Aghion, Van Reenen, and Zingales (2013), Fisman et al. (2013), Asker, Farre-Mensa, and Ljungqvist (2014), Gao, Hsu, and Li (2014)).
example, Seru (2014) explores the effects of mergers and acquisitions on inno-vation, Lerner, Sorensen, and Stromberg (2011) examine the impact of private equity investments, and Aghion, Van Reenen, and Zingales (2013) explore the importance of institutional investors and concentrated ownership. In addition, this paper is connected to the theoretical literature on the organization of R&D (e.g., Aghion and Tirole (1994)), and more broadly to empirical work on the boundaries of the firm (e.g., Robinson (2008), Beshears (2013), and Seru (2014)).
The rest of the paper proceeds as follows. SectionIdescribes the data and presents summary statistics and Section II presents the empirical strategy. SectionIIIprovides the main results and SectionIVdiscusses potential chan-nels. SectionVconcludes.
I. Data
The data in this analysis comprise information on IPO filings, patents, hand-collected financial information, and information on other firm characteristics.
A. IPO Filings
To apply for an IPO, a firm is required to submit an initial registration state-ment to the SEC (usually Form S-1), which contains the IPO filer’s business and financial information. Following the submission of the Form S-1, filers market the equity issuance to investors (the book-building phase) and have the option to withdraw the IPO filing by submitting Form RW. Withdrawals are common in IPO markets, with approximately 20% of all IPO filings ultimately withdrawn.
I collect all IPO filings using Thomson Financial’s SDC New Issues database. The sample starts in 1985, when SDC began covering withdrawn IPOs systematically, and ends in 2003, as the analysis explores the innovation out-comes of firms in the five years after the IPO filing. Following the IPO literature, I exclude IPO filings of financial firms (SIC between 6000 and 6999), unit of-fers, closed-end funds (including REITs), American depositary receipts (ADRs), limited partnerships, special acquisition vehicles, and spin-offs. I identify 5,583 complete IPOs and 1,599 withdrawn IPO filings from 1985 to 2003.
B. Patent Data
B.1. Measuring Innovative Activity
An extensive literature on the economics of technological change demon-strates that patenting activity reflects the quality and extent of firm innova-tion, and the use of patenting activity as a measure of innovation is widely accepted (Lanjouw, Pakes, and Putnam (1998), Hall, Jaffe, and Trajtenberg (2001)). Importantly for this analysis, patent information is available for both public and private firms, unlike R&D expenditures, and allows us to measure firm innovation output along several dimensions.
The most basic measure of innovation output is a simple count of the num-ber of patents granted. However, patent counts cannot distinguish between breakthrough innovation and incremental discoveries (e.g., Griliches (1990)). A second metric therefore reflects the novelty of a patent by counting the num-ber of citations a patent receives following its approval. The numnum-ber of patent citations also captures the economic importance of the innovation, as it corre-lates with a firm’s market value (Hall, Jaffe, and Trajtenberg (2005)). Indeed, Kogan et al. (2012) show that the stock market strongly, and positively, reacts to the approval of patents that are eventually highly cited, and that such patents predict both firm productivity and capital and labor flows from noninnovative to innovative firms within the industry.
Both citation rates and patent counts vary over time and across technologies. Variation may stem from changes in the importance of technologies or from changes in the patent system. Therefore, a comparison of raw patents and citations is only partially informative. To adjust patent citations, I follow Hall, Jaffe, and Trajtenberg (2001) and constructScaled Citations by scaling each patent citation count by the average number of citations of matched patents, where matched patents are patents granted in the same year and in the same technology class. Similarly, to adjust patent counts, I weight each patent by the average number of patents granted by firms in the same year and technology class. Hence, patents granted in technologies in which firms issue more patents receive less weight. TheScaled Number of Patentsis a simple sum of the scaled patents a firm generates in a year.
completed the IPO filing, and manually match patents to withdrawn IPO fil-ings.5I restrict the sample to firms with at least one successful patent
applica-tion over the period from three years before to five years after the IPO filing. This yields 1,488 innovative firms that went public and 323 that withdrew the IPO application.
The goal is to collect information on firms’ innovation activity in the five years after the IPO filing regardless of whether the firms are acquired or go public in a second attempt, to avoid biases that may arise from truncating firm activity. After all, firm exits are yet another consequence of the IPO effect that influences firms’ innovation paths. Collecting patent information subsequent to firm exits is feasible as in most cases, even if a firm is acquired, its patents are still assigned to the acquired rather than the acquiring company.6
I calculate the number of citations a patent receives in the calendar year of its approval and in the subsequent three years. This time frame is selected to fit the nature of the sample. Since many of the IPO filings in the sample occur toward the end of the 1990s, increasing the time horizon of citation counts would reduce sample size. Further motivating the selected citation horizon is the fact that citations are concentrated in the first few years following a patent’s
4Originality (Generality) is the Herfindahl index of the cited (citing) patents used to capture dispersion across technology classes. I use the bias correction of the Herfindahl measures, described in Jaffe and Trajtenberg (2002), to account for cases with a small number of patents within technological categories.
5As withdrawn firms are not included in COMPUSTAT, I match these firms based on company name, industry, and geographic location, all of which are available in SDC and IPO registration forms. In cases in which firm names are similar but not identical, or the location of the patentee differs from the SDC records or SEC registration statements, I conduct web and FACTIVA searches to verify matches.
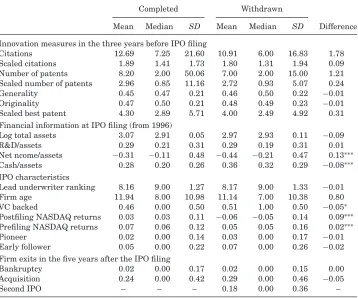
Table I
Summary Statistics
This table provides key summary statistics, comparing firms that go public with firms that with-draw IPO filing and remain private. All variables are defined in the Appendix. Average innovation measures are calculated over the three years up to (and through) the IPO filing year. Financial information and IPO characteristics are at the time of the IPO filing. Firm exits such as acquisi-tion, bankruptcy, and second IPO are calculated over the five years after the IPO filing. *, **, and *** indicate that differences in means are statistically significant at the 10%, 5%, and 1% level, respectively.
Completed Withdrawn
Mean Median SD Mean Median SD Difference
Innovation measures in the three years before IPO filing
Citations 12.69 7.25 21.60 10.91 6.00 16.83 1.78 Scaled citations 1.89 1.41 1.73 1.80 1.31 1.94 0.09 Number of patents 8.20 2.00 50.06 7.00 2.00 15.00 1.21 Scaled number of patents 2.96 0.85 11.16 2.72 0.93 5.07 0.24 Generality 0.45 0.47 0.21 0.46 0.50 0.22 −0.01 Originality 0.47 0.50 0.21 0.48 0.49 0.23 −0.01 Scaled best patent 4.30 2.89 5.71 4.00 2.49 4.92 0.31 Financial information at IPO filing (from 1996)
Log total assets 3.07 2.91 0.05 2.97 2.93 0.11 −0.09 R&D/assets 0.29 0.21 0.31 0.29 0.19 0.31 0.01 Net ncome/assets −0.31 −0.11 0.48 −0.44 −0.21 0.47 0.13∗∗∗
Cash/assets 0.28 0.20 0.26 0.36 0.32 0.29 −0.08∗∗∗
IPO characteristics
Lead underwriter ranking 8.16 9.00 1.27 8.17 9.00 1.33 −0.01 Firm age 11.94 8.00 10.98 11.14 7.00 10.38 0.80 VC backed 0.46 0.00 0.50 0.51 1.00 0.50 −0.05∗
Postfiling NASDAQ returns 0.03 0.03 0.11 −0.06 −0.05 0.14 0.09∗∗∗
Prefiling NASDAQ returns 0.07 0.06 0.12 0.05 0.05 0.16 0.02∗∗∗
Pioneer 0.02 0.00 0.14 0.03 0.00 0.17 −0.01 Early follower 0.05 0.00 0.22 0.07 0.00 0.26 −0.02 Firm exits in the five years after the IPO filing
Bankruptcy 0.02 0.00 0.17 0.02 0.00 0.15 0.00 Acquisition 0.24 0.00 0.42 0.29 0.00 0.46 −0.05
Second IPO – – – 0.18 0.00 0.36 –
approval, with a considerable serial correlation in citation rates (Akcigit and Kerr (2013)).
Since the NBER patent database ends in 2006, I supplement it with informa-tion from the Harvard Business School (HBS) patent database, which covers patents granted through December 2009. This enables calculation of citations for patents granted toward the end of the sample. Overall, the sample consists of 39,306 granted patents of firms that went public and 4,835 granted patents of firms that withdrew their filing.
standard financial databases. To overcome this constraint, I collect withdrawn firms’ financial information from initial registration statements by download-ing Form S-1 fildownload-ings from the SEC’s EDGAR database, which is available as of 1996. I collect financial information for IPO firms from COMPUSTAT and CapitalIQ.
Additional information on firm characteristics comes from various sources. I obtain data on venture capital (VC) funding from SDC, VentureXpert, and registration statements. I supplement these data with information on a firm’s age at the time of the IPO filing and its underwriters’ ranking from registration forms, VentureXpert, Jay Ritter’s web page, and the SDC database. Finally, I collect information on firm exits, that is, events in which a firm is acquired, goes public in a second attempt (for withdrawn firms), or files for bankruptcy. I use COMPUSTAT and CapitalIQ to search for acquisitions and bankruptcies, and the SDC database to identify second IPOs of withdrawn firms. I perform extensive checks to verify the nature of private firms’ exits using the Deal Pipeline database, Lexis-Nexis, and web searches.
TableI compares the characteristics of IPO firms and withdrawn firms at the time of filing. I find no significant differences in firm size, measured by the log of firm assets, or in R&D expenditures normalized by firm assets. However, withdrawn firms have a higher cash-to-assets ratio and lower net income to assets. I also find no significant differences in the reputation of the lead underwriter, which is often used as a proxy for firm quality (Carter and Manaster (1990), Carter, Dark, and Singh (1998), and Loughran and Ritter (2004)), or in firm age at the time of filing.
There are stark differences, however, in the NASDAQ fluctuations that firms experience after the IPO filing. Specifically, firms that go public experience on average a 3% increase in two-month NASDAQ returns following the IPO filing,
while firms that withdraw experience on average a sharp drop of 6% over a similar period. The differences in NASDAQ returns in the three months prior to the IPO filing, however, are fairly small (5% increase for firms that ultimately remain private versus 7% for those that go public). These differences provide further motivation for using NASDAQ fluctuations as a source of variation that affects IPO completion choices. I discuss this in detail in the next section.
TableIalso summarizes firm exits in the five years following the IPO filing. I find that 29% of the withdrawn firms and 24% of the IPO firms are acquired over this period, with the difference between the two groups insignificant. Only 2% of both IPO and withdrawn firms go bankrupt. Additionally, 18% of the withdrawn firms ultimately go public in a second attempt in the five years following the IPO filing.
The small fraction of withdrawn firms that return to public equity markets in a second attempt is highlighted in the literature (Busaba, Beneviste, and Guo (2001), Dunbar and Foerster (2008)). Several explanations exist for the low fraction of second attempt IPOs. Returning to IPO markets in a second attempt may be difficult as the window of opportunity may have closed due to the boom and bust nature of IPO markets (Ibbotson and Ritter (1995)). Brau and Fawcett (2006) find that the most important signal when going public is a firm’s past historical earnings. If going public requires several years of fast growth to attract investors’ attention, such growth may be difficult to replicate in a second attempt. Dunbar and Foerster (2008) further suggest that there are reputational costs associated with the decision to withdraw, which may prevent firms from returning to equity markets.
II. Empirical Strategy
A. Empirical Design
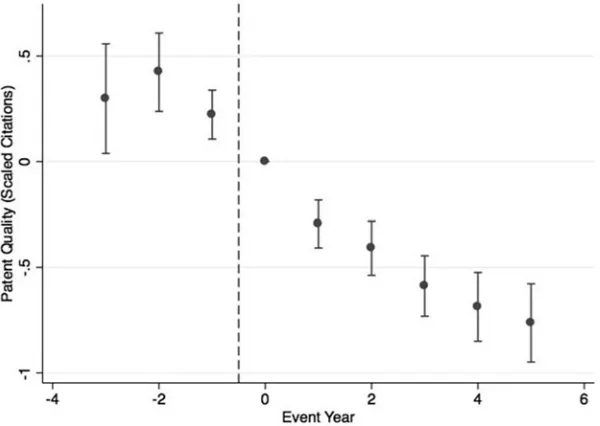
Identifying the effects of going public on innovation and firm outcomes is challenging due to inherent selection issues that arise from the decision to go public. This concern is evident in Figure1, which presents within-firm changes in innovation quality, as measured by Scaled Citations, in the years around the IPO.8Firms experience a monotonic decline in patent novelty between the
two years before the IPO event and the five years after. Due to the choice to go public, post-IPO performance could be driven by reversion to the mean and life cycle effects, rather than the effect of becoming a publicly traded firm.
What is a reasonable counterfactual for firms that go public? Simply com-paring post-IPO innovation to an average private firm may generate biased estimates, as most private companies are fundamentally different and never
Figure 1. Quality of innovation around the IPO event. The figure presents changes in patent quality, as measured by Scaled Citations, in the years around the IPO. The estimates and confi-dence intervals are taken from the following specification:Yit=β0+kk==−53
k=0
γkEventY eari,k+τi+
µt+εi,t.The unit of observation is at the patent level and the dependent variable is Scaled
Ci-tations.EventYeari,kis a dummy variable indicating the relative year around the IPO in which
a patent application was submitted (year zero is the year of the IPO and the omitted category). The specification is estimated using OLS and includes firm fixed effects (τi) and year fixed effects
(µt). Standard errors are clustered at the firm level. The estimates are reported in the Internet
Appendix.
go public. This is evident in TableI, where one can see that prefiling innovation quality of firms that go public is 80% higher than the average innovation in the respective technological classes. To overcome this concern, I focus on those firms that submit an initial registration statement to the SEC in an attempt to go public.
I compare the long-run innovation of firms that go public with firms that file to go public in the same year but ultimately withdraw their filing and remain private. This setup is attractive as it allows for comparison of the post-IPO performance of firms that go public with that of private firms at a similar stage in their life cycle. The baseline specification is
Yipost=α1+β1I P Oi+γ1Yipre+Xi′δ1+νk+µt+ε1i, (1)
whereYipost is the average innovation performance in the five years following the IPO filing (average scaled citations, average scaled originality/generality, and average scaled number of patents per year),Yipreis the equivalent measure in the three years prior to the IPO filing, and I P Oi is the dummy variable of
null hypothesis that going public has no effect on innovation, β1 should not be statistically different from zero. This model includes industry (vk) and IPO
filing year (µt) fixed effects.
If the decision to withdraw an IPO filing is related to unobserved innovation policy or innovative opportunities (captured in the error term), thenβ1may be biased. Therefore, I instrument for the IPO completion choice using NASDAQ returns in the first two months of the book-building phase. The decision to use a two-month window is somewhat arbitrary. One could use the NASDAQ returns over the entire period of the book-building phase. However, since the length of the book-building phase is often correlated with the likelihood of withdrawing, I choose a fixed window that is sufficiently shorter than the average length of the book-building period.
The figure below illustrates the timeline of the IPO filing and the NASDAQ fluctuations during the book-building phase. On average, the ownership choice is made within the four months following the IPO filing. Firm-level innovation is measured over the five-year period after the IPO filing.9
To implement the instrumental variables approach, I estimate the following first-stage regression:
I P Oi =α2+β2NSDQi+γ2Yipre+X
′
iδ2+νk+µt+ε2i, (2)
where NSDQi is the instrumental variable. The second-stage equation
esti-mates the impact of IPO on innovation activity:
Yipost =α3+β3I P Oi+γ3Yipre+X
′
iδ3+νk+µt+ε3i, (3)
where I P Oi are the predicted values from (2). If the conditions for a valid
instrumental variable are met, β3 captures the causal effect of an IPO on innovation outcomes. I implement the instrumental variable estimator using two-stage least squares (2SLS). I also use a quasi-maximum likelihood (QML) Poisson model to estimate the specification (Blundell and Powell (2004)), which is the standard estimation method used in both the innovation literature and count data analysis more generally.
It is important to note that the estimates in the instrumental variables analysis are coming only from thesensitivefirms (Imbens and Angrist (1994)). In other words, the estimates are coming only from those firms that would alter their IPO completion decision if they experience a NASDAQ drop, and therefore are sensitive to changes in the instrument. In the Internet Appendix, I provide a simple example to illustrate this point. In the next section, I discuss the assumptions that need to hold for the instrument to be valid.
Figure 2. NASDAQ Fluctuations and IPO Withdrawals.The figure illustrates the sensitivity of IPO filings to NASDAQ fluctuations. The sample includes all IPO filings from 1985 through 2003 in the United States, after excluding unit investment trusts, closed-end funds, REITs, limited patnerships, and financial companies. Overall there are 8,563 IPO filings, with 6,958 complete registrations and 1,605 withdrawn registrations. The dashed line is the fraction of monthly filings that ultimately withdraw their registration. The solid line is the two-month NASDAQ returns calculated from the middle of each month. The correlation of the two plots is−0.44, and−0.34 before 2000. Both correlations are significantly different from zero at the 1% level.
B. NASDAQ Fluctuations and IPO Completion
For the instrument to be valid, it must strongly affect IPO completion choice. Indeed, issuers are highly sensitive to stock market fluctuations during the book-building phase (Dunbar (1998), Busaba, Benveniste, and Guo (2001), Ben-veniste et al. (2003), Edelen and Kadlec (2005), Dunbar and Foerster (2008)). This sensitivity is also illustrated in Figure 2, which plots the fraction of monthly filings that ultimately withdraw against the two months of NAS-DAQ returns calculated from the middle of each month, which approximates the stock market fluctuations during the initial part of the book-building phase (the correlation of the two plots equals−0.44 and is significantly different from zero at the 1% level). Consistent with this evidence, a survey by Brau and Fawcett (2006) finds that CFOs that withdraw an IPO registration indicate that market conditions played a role in their decision.
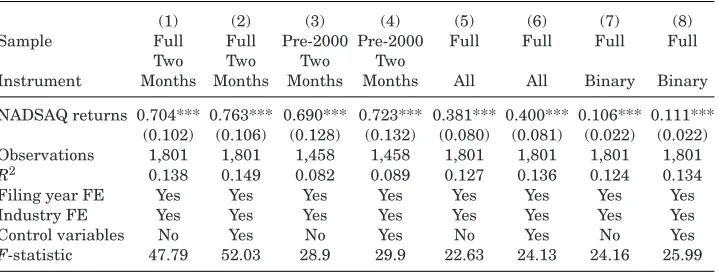
Table II
First Stage
This table reports the first-stage estimation of the instrumental variables analysis. The dependent variable is a dummy variable that equals one if a firm completes the IPO filing, and zero otherwise. NASDAQ Returnsis constructed differently across specifications. In columns (1) to (4), NASDAQ returns are the two-month returns after the IPO filing date. In columns (5) and (6), NASDAQ returns are calculated over the entire book-building period, that is, from the date of the initial registration statement to the completion or withdrawal date. Finally, columns (7) and (8) use a dummy variable that is equal to one if a firm does not experience a NASDAQ drop, where a firm is said to have experienced a NASDAQ drop if the two-month NASDAQ returns from the date of the IPO filing are within the bottom 25% of all filers in the same year. In columns (3) and (4) the sample is restricted to IPO filings before 2000. When control variables are included, the following variables are added to the specification: three-month NASDAQ returns prior to the IPO filing, number of patents in the three years before the IPO filing,VC Backed, Pioneer,and Early Follower. All variables are defined in the Appendix. The model is estimated using OLS, and robust standard errors are presented in parentheses. *, **, and *** indicate that the coefficient is statistically significant at the 10%, 5%, and 1% level, respectively.
(1) (2) (3) (4) (5) (6) (7) (8) Sample Full Full Pre-2000 Pre-2000 Full Full Full Full
Two Two Two Two
Instrument Months Months Months Months All All Binary Binary
NADSAQ returns 0.704*** 0.763*** 0.690*** 0.723*** 0.381*** 0.400*** 0.106*** 0.111*** (0.102) (0.106) (0.128) (0.132) (0.080) (0.081) (0.022) (0.022) Observations 1,801 1,801 1,458 1,458 1,801 1,801 1,801 1,801 R2 0.138 0.149 0.082 0.089 0.127 0.136 0.124 0.134 Filing year FE Yes Yes Yes Yes Yes Yes Yes Yes Industry FE Yes Yes Yes Yes Yes Yes Yes Yes Control variables No Yes No Yes No Yes No Yes F-statistic 47.79 52.03 28.9 29.9 22.63 24.13 24.16 25.99
The first-stage results, presented in TableII, demonstrate the effect of NAS-DAQ returns during the book-building phase on IPO completion. The depen-dent variable is equal to one if a firm completes the IPO filing, and zero other-wise. All specifications include filing year and industry fixed effects using OLS. In column (1), I find that the coefficient on two-month NASDAQ returns equals 0.704 and is significant at the 1% level. A one standard deviation decline in NASDAQ returns translates into a 8.72% decrease in the likelihood of complet-ing the IPO. Moreover, the F-statistic equals 47.79 and exceeds the threshold of F=10, which suggests that the instrument is strong and unlikely to be biased toward the OLS estimates (Bound, Jaeger, and Baker (1995), Staiger and Stock (1997)).
In column (2), I control for the three-month NASDAQ returns prior to the IPO filing, the number of prefiling patents, a VC backing dummy variable, and the location of the filer within the IPO wave.10The coefficient remains highly
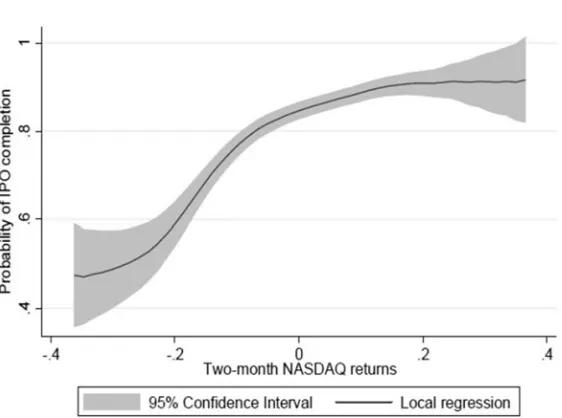
Figure 3. Two-month NASDAQ fluctuations and IPO completion likelihood.The figure presents the nonparametric association between the two-month post-IPO filing NASDAQ returns and the likelihood of completing the IPO filing for firms in the sample.
statistically significant, suggesting that the instrument is almost orthogonal to the added control variables. In columns (3) and (4), I limit the sample to the pre-2000 period. The results remain similar. In columns (5) and (6), I calculate the NASDAQ returns over the entire book-building period.11 The
coefficient is still significant at the 1% level, but the magnitude of the coefficient is somewhat lower. In columns (7) and (8), I construct a dummy variable that equals one if the firm does not experience a NASDAQ drop, where a firm is classified as having experienced a NASDAQ drop if its two-month NASDAQ return following the IPO filing is among the lowest 25% of all filers within the same year. The dummy variable in column (7) is highly statistically significant, reflecting a 10.6% increase in the likelihood of IPO completion. Column (8) adds the additional control variables. The results again remain unchanged.
Figure3illustrates the nonparametric relation between the two-month NAS-DAQ fluctuations and the likelihood of completing the IPO filing. The figure shows that, as long as the NASDAQ fluctuations are negative, there is a posi-tive and monotonic association between NASDAQ returns and the likelihood of completing the IPO filing. When NASDAQ returns are positive, filers become less sensitive to market conditions and the likelihood of completing an IPO filing becomes more or less stable around 85%.
Overall, the first-stage results indicate that NASDAQ fluctuations have a strong effect on IPO completion, with the effect concentrated in market
declines. Moreover, the two-month NASDAQ effect seems to be orthogonal to the control variables considered.
C. The Exclusion Restriction Condition
The instrument needs to not only affect IPO completion choice, but also sat-isfy the exclusion restriction. That is, it should not affect the scaled innovation measures through any channel other than the decision to complete the IPO filing.12 Formally, this requires that the instrument is uncorrelated with the
residuals in equation(1). To alleviate concerns about the exclusion restriction, I take several steps:
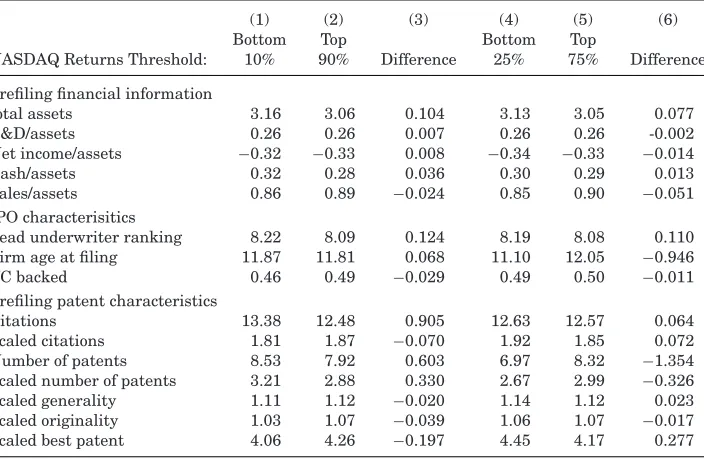
(1) Comparison of observables: I explore whether significant differences in observables occur between firms that experience a NASDAQ drop and other firms that file to go public in the same year. A firm is classified as having experienced a NASDAQ drop if the two-month NASDAQ re-turn after the IPO filing is within the bottom 10% (or 25%) of filers in a given year. Using both thresholds in Table III, I find no significant differences between the two sets of firms across a list of observables such as firm financial information at the time of filing, age, VC backing, IPO filing characteristics, and, importantly, all innovation measures in the three years before the IPO filing. These findings are not surprising given that similar firms are likely to cluster and try to go public at the same time in an attempt to exploit information spillovers (Benveniste et al. (2003)).
(2) Within-year comparison: In the analysis, I compare the long-run innova-tion activity of firms that file to go public in the same year but experi-ence different short-term NASDAQ fluctuations during the book-building phase. Firms that file to go public in the same year are likely to be similarly exposed to changes in long-run innovation opportunities, since R&D expenditure is a slow-moving process (Hall, Griliches, and Haus-man (1986), Lach and SchankerHaus-man (1989)).
(3) Additional controls: To further address concerns about within-year com-positional shifts, I also control for the three-month NASDAQ return pre-ceding the IPO filing, and for firms’ location within the IPO wave. (4) Scaled innovation measures: Any aggregate changes, such as changes
in innovation opportunities, should affect both sample firms and all other firms doing research in the same technology. Since scaled inno-vation measures are expressed relative to all patents granted in the same year and technology class, these measures are not likely to be
Prefiling financial information
total assets 3.16 3.06 0.104 3.13 3.05 0.077 R&D/assets 0.26 0.26 0.007 0.26 0.26 -0.002 Net income/assets −0.32 −0.33 0.008 −0.34 −0.33 −0.014 Cash/assets 0.32 0.28 0.036 0.30 0.29 0.013 Sales/assets 0.86 0.89 −0.024 0.85 0.90 −0.051 IPO characterisitics
Lead underwriter ranking 8.22 8.09 0.124 8.19 8.08 0.110 Firm age at filing 11.87 11.81 0.068 11.10 12.05 −0.946 VC backed 0.46 0.49 −0.029 0.49 0.50 −0.011 Prefiling patent characteristics
Citations 13.38 12.48 0.905 12.63 12.57 0.064 Scaled citations 1.81 1.87 −0.070 1.92 1.85 0.072 Number of patents 8.53 7.92 0.603 6.97 8.32 −1.354 Scaled number of patents 3.21 2.88 0.330 2.67 2.99 −0.326 Scaled generality 1.11 1.12 −0.020 1.14 1.12 0.023 Scaled originality 1.03 1.07 −0.039 1.06 1.07 −0.017 Scaled best patent 4.06 4.26 −0.197 4.45 4.17 0.277
affected by aggregate changes to the extent that they are captured by the instrument.13
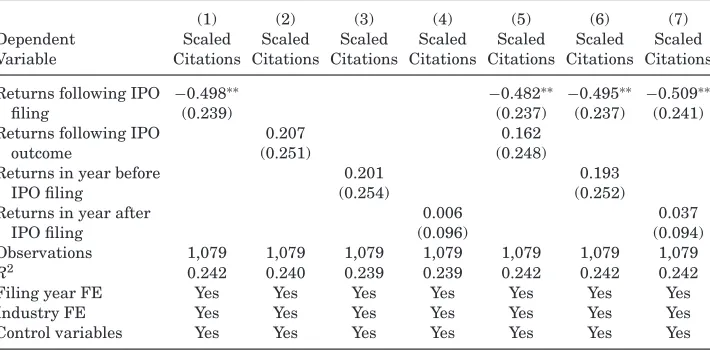
(5) Placebo test: Column (1) of TableIVpresents the reduced from result in which there is a statistically significant correlation between two-month postfiling NASDAQ returns and long-run scaled citations.14 If the
ex-clusion restriction is violated, then two-month NASDAQ returns affect long-run innovation through channels other than the ownership channel.
13Consider, for example, a firm that submitted an IPO filing in 1995 and was awarded a patent in 1998 in fiber optics technology. The novelty of the patent is scaled by the average novelty of all patents granted in 1998 in fiber optics technology. If the two-month NASDAQ returns following the IPO filing reflected a change in innovation opportunities in fiber optics in coming years, this change should affect the novelty of all patents within this technology class. Hence, relative patent novelty is unlikely to be affected by the instrument, even if the instrument reflects changes in innovative opportunities.
Table IV
Placebo Test
This table reports a placebo test to assess the validity of the instrumental variable exclusion restriction. The dependent variable is the average scaled citations in the five years after the IPO filing.Returns following IPO filingare the two-month NASDAQ returns calculated from the IPO filing date.Returns following IPO outcomeare the two-month NASDAQ returns calculated from either the date of the equity issuance or the date of the IPO filing withdrawal. When the date of IPO filing withdrawal is not available, 270 days subsequent to the last amendment of the IPO filing is assumed (Lerner (1994)).Returns in year before IPO filingare the two-month NASDAQ returns calculated from a year before the IPO filing.Returns in year after IPO filingare the two-month NASDAQ returns calculated from a year after the IPO filing. The variables included in the regressions are prefiling average scaled citations, prefiling number of patents,VC Backed, Pioneer, Early Follower, and the three-month NASDAQ returns before the IPO filing. All variables are defined in the Appendix. The model is estimated using OLS, and robust standard errors are reported in parentheses. *, **, and∗∗∗indicate that the coefficient is statistically significant at the
10%, 5%, and 1% level, respectively.
(1) (2) (3) (4) (5) (6) (7)
Dependent Scaled Scaled Scaled Scaled Scaled Scaled Scaled Variable Citations Citations Citations Citations Citations Citations Citations
Returns following IPO −0.498∗∗ −0.482∗∗ −0.495∗∗ −0.509∗∗
filing (0.239) (0.237) (0.237) (0.241)
Returns following IPO 0.207 0.162
outcome (0.251) (0.248)
Returns in year before 0.201 0.193
IPO filing (0.254) (0.252)
Returns in year after 0.006 0.037
IPO filing (0.096) (0.094)
Observations 1,079 1,079 1,079 1,079 1,079 1,079 1,079 R2 0.242 0.240 0.239 0.239 0.242 0.242 0.242 Filing year FE Yes Yes Yes Yes Yes Yes Yes
Industry FE Yes Yes Yes Yes Yes Yes Yes
Control variables Yes Yes Yes Yes Yes Yes Yes
Such alternative channels should also be apparent when exploring NAS-DAQ returns outside the book-building phase, when firms’ ownership choice is fixed. Using this setting as a placebo test, in column (2) I find that two-month NASDAQ returns immediately following the IPO comple-tion choice do not predict long-run innovacomple-tion performance. In columns (3) and (4), I similarly find that, in the year before (or year after) the IPO filing, two-month NASDAQ returns are insignificant and do not correlate with long-run innovation. In columns (5) to (7), I repeat the analysis by including both postfiling NASDAQ returns and NASDAQ returns outside the book-building phase. In contrast to the NASDAQ returns following the IPO filing, outside the book-building window they are not correlated with long-run innovation. These findings are consistent with the notion that short-run NASDAQ returns affect long-run innovation only through their impact on firms’ ownership choice.
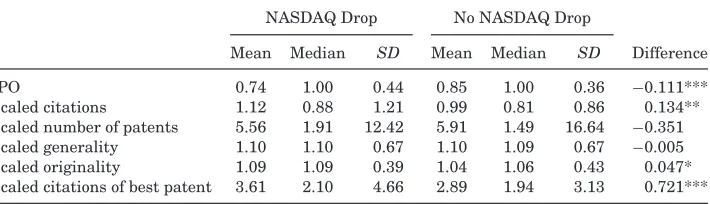
Scaled number of patents 5.56 1.91 12.42 5.91 1.49 16.64 −0.351 Scaled generality 1.10 1.10 0.67 1.10 1.09 0.67 −0.005 Scaled originality 1.09 1.09 0.39 1.04 1.06 0.43 0.047* Scaled citations of best patent 3.61 2.10 4.66 2.89 1.94 3.13 0.721***
The results, reported in the Internet Appendix, show that the instru-ment does not predict changes in aggregate innovation trends.
III. Results
A. Internal Innovation
In this section, I use the instrumental variables approach, described in Section II, to study the effects of going public on internally generated firm innovation.
A.1. Simple Illustration of Reduced Form Results
Before presenting the multivariate analysis, I illustrate the results by a sim-ple comparison of the post-IPO innovation performance of firms that experience a NASDAQ drop relative to other filers within the same year. This comparison is equivalent to the reduced-form estimation in which the instrument is binary and equals one if a firm experience a NASDAQ drop. This approach is attrac-tive because of its simplicity and absence of any distributional or functional form assumptions.
In TableV, I find a strong correlation between two-month NASDAQ declines and subsequent five-year innovation performance, arguably through the im-pact of NASDAQ returns on IPO completion choice. Firms that experience NASDAQ declines produce patents with higher average scaled citations and higher average scaled originality. The difference in patent quality is also ap-parent when one considers the most-cited patent produced after the IPO filing (rather than the average citation rates). I find no differences in the number of patents produced following the IPO filing. These results are similar to those presented in the multivariate analysis, which makes use of the continuous-value instrument.
A.2. Multivariate Analysis
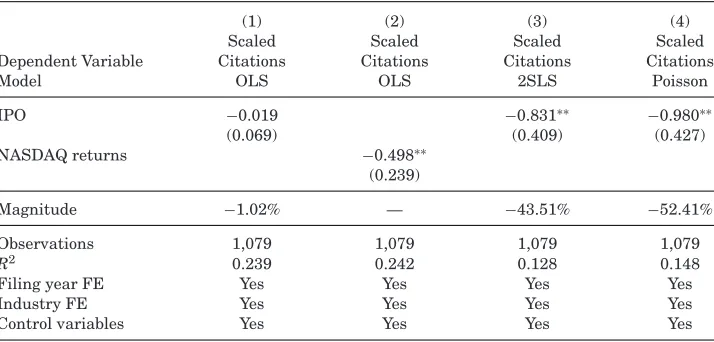
The first set of results explores the effect of going public on innovation nov-elty. The dependent variable is the average scaled citations in the five years following the IPO filing, controlling for the equivalent measure in the three years prior to the IPO filing. All specifications follow the model described in Section II.A, controlling for filing year and industry fixed effects. Additionally, I control for three-month pre-IPO filing NASDAQ returns, the VC backing dummy variable, and location within the IPO wave. Robust standard errors are reported in parentheses.
In column (1) of Table VI, I report the endogenous OLS model and find no differences between IPO firms and withdrawn firms, as the IPO coefficient is insignificant. Column (2) presents the reduced-form estimation, obtained by substituting the endogenous IPO variable with the instrument. I find a sta-tistically significant and negative correlation between two-month NASDAQ returns and average scaled citations in the subsequent five years, arguably through the impact of the instrument on IPO completion choice. This result corresponds to the findings in TableV. Interestingly, this negative correlation counters the notion that two-month NASDAQ returns predict long-run inno-vation opportunities, as in that case, one would expect a positive correlation between short-run NASDAQ returns and long-run innovation. In column (3), I report the 2SLS estimates. The coefficient on the IPO variable is significant and equals −0.831, implying that the average scaled citations of IPO firms drops after the IPO by 43.51% (=0.83/1.91, where 1.91 is the average number of scaled citations in the pre-event years). In column (4), I use the QML Poisson model to estimate the IV specification. The estimates are similar to those in column (3), as the coefficient of interest is significant, negative, and of a similar magnitude.
It is interesting to note that the OLS coefficient overestimates the effect of going public on the quality of innovation, compared to the IV estimate. This suggests that the selection bias associated with the decision to complete the IPO filing is positive, and on average more innovative firms are more likely to complete the IPO filing.
(1) (2) (3) (4)
Scaled Scaled Scaled Scaled
Dependent Variable Citations Citations Citations Citations
Model OLS OLS 2SLS Poisson
IPO −0.019 −0.831∗∗ −0.980∗∗
(0.069) (0.409) (0.427)
NASDAQ returns −0.498∗∗
(0.239)
Magnitude −1.02% — −43.51% −52.41%
Observations 1,079 1,079 1,079 1,079
R2 0.239 0.242 0.128 0.148
Filing year FE Yes Yes Yes Yes
Industry FE Yes Yes Yes Yes
Control variables Yes Yes Yes Yes
the IPO significantly declines as the IPO coefficient equals−0.137, reflecting a decline of 13% (=−01..1306,where 1.06 is the average scaled originality in the pre-event years). These findings suggest that issuers who remain private produce patents that rely on a broader set of technologies. In columns (4) to (6), I repeat the analysis with respect to the average scaled generality measure. The results are insignificant.
The decline in innovation novelty may be driven by an increase in the scale of innovation, as measured by number of patents. In that case, the addition of low-quality innovation projects may generate the results rather than a reposi-tioning of research to lower-impact topics. The analysis in TableVIIIaddresses this question by exploring changes in the scale of innovation.15
Table VII
Fundamental Nature of Research
This table reports the effect of an IPO on the fundamental nature of research. In columns (1) to (3) the dependent variable is the average scaled originality in the five years after the IPO filing, and in columns (4) to (6) it is average scaled generality.IPOis a dummy variable equal to one if a firm completes the IPO filing, and zero otherwise.NASDAQ Returnsis the two-month NASDAQ returns calculated from the IPO filing date. In columns (1) to (3) I control for the prefiling average scaled originality, and in columns (4) to (6) I control for the corresponding generality measure. Additional control variables are: prefiling average scaled citations, prefiling average scaled patents per year, VC Backed, Pioneer, Early Follower, and the three-month NASDAQ returns before the IPO filing. All variables are defined in the Appendix. The model is estimated using OLS in columns (1), (2), (4), and (5) and using 2SLS in columns (3) and (6).Magnitudeis the ratio ofIPOcoefficient to the prefiling average of scaled originality or scaled generality. Robust standard errors are reported in parentheses. *, **, and *** indicate that the coefficient is statistically significant at the 10%, 5%, and 1% level, respectively.
(1) (2) (3) (4) (5) (6)
Scaled Scaled Scaled Scaled Scaled Scaled Dependent Variable Originality Originality Originality Generality Generality Generality
Model OLS OLS 2SLS OLS OLS 2SLS
IPO −0.006 −0.137∗∗ −0.001 −0.087
(0.010) (0.068) (0.016) (0.092)
NASDAQ returns −0.081∗∗ −0.050
(0.036) (0.051)
Magnitude −0.10% – −13% 0% – −8%
Observations 1,079 1,079 1,079 1,079 1,079 1,079
R2 0.231 0.234 0.102 0.226 0.226 0.206
Filing year FE Yes Yes Yes Yes Yes Yes
Industry FE Yes Yes Yes Yes Yes Yes
Control variables Yes Yes Yes Yes Yes Yes
The endogenous model in column (1) indicates that IPO firms produce signif-icantly more patents per year following the IPO filing, with a 37.75% increase relative to the pre-IPO average. Column (2), however, indicates that the above effect is insignificant when the reduced-form specification is estimated. The 2SLS estimate in column (3) shows that the coefficient on the IPO variable is insignificant and the magnitude declines to 28.17%. In fact, when using the IV Poisson specification in column (4), the coefficient on the IPO variable is close to zero and insignificant.
A.3. Robustness Checks and Interpretation
Scaled Scaled Scaled Scaled Dependent Variable Patents Patents Patents Patents
Model OLS OLS 2SLS Poisson
IPO 0.268∗∗∗ 0.200 0.002
(0.066) (0.474) (0.662)
NASDAQ returns 0.127
(0.305)
Magnitude 37.75% 28.17% 0.28%
Observations 1,801 1,801 1,801 1,801
R2 0.184 0.178 0.184 0.168
Filing year FE Yes Yes Yes Yes
Industry FE Yes Yes Yes Yes
Control variables Yes Yes Yes Yes
examine firms’ best (i.e., most-cited) patent, which is unlikely to be affected by the addition of low-quality patent filings. I find that the quality of IPO firms’ best patent declines as well, with a comparable magnitude to the decline in average innovation quality reported in Table VI. This evidence, which is re-ported in the Internet Appendix, suggests that going public affects the entire patent distribution rather than simply driving average performance down by the addition of low-quality projects.16
Next, cash-rich firms may be associated with fewer citations because citing firms may face higher litigation risk, which would mechanically generate the results in the paper. To test this concern, I focus on patents approved before the IPO filing and examine whether patents’ annual citation rate changes after the firms go public (relative to firms that withdraw the filing). In results reported in the Internet Appendix, I find that changes in the citation rate of existing inventions cannot be explained by the transition to public equity markets.
I also explore whether the results are driven by the Internet bubble years. As illustrated in Table IV, the instrument strongly predicts IPO completion even when all firms that filed during the Internet bubble and thereafter are excluded. In robustness tests I reestimate the innovation novelty regressions after excluding all firms that file to go public as of 1999. The results, reported in the Internet Appendix, remain significant and qualitatively unchanged.
In the main analysis, I collect information on the innovation trajectory of firms in the five years subsequent to the IPO filing. In interpreting the results, it is natural to wonder how the endogenous transition of 18% of the withdrawn firms to public equity markets in a second attempt affects the estimates. To examine this question, I repeat the instrumental variables analysis using an endogenous variable that equals one if a firm goes public in the two (or three) years after the IPO filing, regardless of whether it withdraws in the first at-tempt. Thus, if a firm withdraws its filing and returns to the IPO market in the first two (three) years after the filing, this firm would be considered part of the treatment group (and not the control group).17As reported in the
Inter-net Appendix, these specifications generate estimates that are similar to those reported above.
Finally, it is important to understand whether the estimates are driven by changes in firms that withdraw their IPO filing and remain private or by firms that go public. For example, withdrawn firms may choose to increase their innovation in order to successfully go public in a second attempt, rather than IPO firms experienc a decline in innovation. However, I find that all IPO filers experience a decline in scaled innovation measures, both firms that experience a NASDAQ drop (and thus are more likely to remain private) and firms that do not experience a NASDAQ drop.18However, the decline is more substantial
among firms that end up going public. Similarly, changes in the acquisition of external innovation, as discussed in Section III.C, are driven by those firms that go public rather than those that remain private.19
17I also explore an endogenous variable that is the fraction of years during the five years after the IPO filing in which the firm is public. If a firm goes public in its first attempt, this variable equals one while, if the firm withdrew and never returned in a second attempt, this variable equals zero. If a withdrawn firm goes public three years following the initial filing, then the variable equals 2/5. Using this endogenous variable generates similar results.
18This decline is evident in TableV, in which the postfiling scaled citations of firms that experi-ence a NASDAQ drop (and thus are more likely to remain private) are substantially smaller than their prefiling scaled citations (as reported in TableIII).
inventors’ names are unreliable as first names can be abbreviated and different inventors may have similar or even identical names. Second, while it is possible to infer that an inventor changed firms (for example, an inventor is associated with a patent for company A in 1987 and a patent for company B in 1989), the precise date of the relocation is unavailable. Additionally, transitions for which inventors do not produce patents in the new location are not observable. Hence, this method identifies relocations of the more creative inventors who patent frequently and presumably matter the most.
To overcome the hurdle of name matching, I use the HBS patenting database, which includes unique inventor identifiers. The unique identifiers are based on refined disambiguation algorithms that separate similar inventors based on various characteristics (Lai, D’Amour, and Fleming (2009)). When patent applications include multiple inventors, I attribute a patent equally to each inventor. Overall, I obtain information on approximately 36,000 inventors in my sample. I restrict the analysis to inventors that produce at least a single patent both before and after the IPO filing and examine the patenting behavior of inventors in the three years before and five years after the IPO filing. I identify three inventor types:
1. Stayer: An inventor with at least a single patent before and after the IPO filing at the same sample firm.
2. Leaver: An inventor with at least a single patent at a sample firm before the IPO filing, and at least a single patent in a different company after the IPO filing.20
3. Newcomer: An inventor with at least a single patent after the IPO filing at a sample firm, but no patents before, and at least a single patent at a different firm before the IPO filing.
Table IX
Inventor Mobility and Innovative Productivity
This table reports the effects of an IPO on inventors’ mobility and innovative activity. Inventors are classified into three categories: stayers, leavers, and newcomers, as defined in the text. In column (1) the sample is restricted to stayers and the dependent variable is the average scaled citations after the IPO filing. In columns (2) and (3), the sample includes stayers and leavers, and the dependent variable equals one if the inventor leaves the firm or generates a spin-off, respectively. An assignee is considered a spin-off if the number of applied patents before the leaver’s patent is zero. In column (4) the sample includes stayers and newcomers, and the dependent variable equals one if the inventor joins the firm.IPOis a dummy variable equal to one if a firm completes the IPO filing, and zero otherwise. The instrument is the two-month NASDAQ returns calculated from the IPO filing date. In all specifications I control for the inventor’s pre-IPO filing average scaled citations and scaled number of patents. Additional control variables are:VC Backed, Pioneer, Early Follower, and the three-month NASDAQ returns before the IPO filing. All variables are defined in the Appendix. All models are estimated using 2SLS.Magnitudeis the ratio of theIPOcoefficient to the prefiling average of scaled citations. Robust standard errors are reported in parentheses. *, **, and *** indicate that the coefficient is statistically significant at the 10%, 5%, and 1% level, respectively.
(1) (2) (3) (4)
Citations of Likelihood Likelihood Likelihood Dependent Variable Stayers of Leaving of a Spin-off of Hiring
Model 2SLS 2SLS 2SLS 2SLS
IPO −1.094** 0.183*** 0.095*** 0.388***
(0.457) (0.062) (0.048) (0.078)
Magnitude −47.94% – –
Observations 6,657 8,773 8,773 11,678
R2 0.203 0.017 0.03 0.058
Filing year FE Yes Yes Yes Yes
Industry FE Yes Yes Yes Yes
Control variables Yes Yes Yes Yes
Of the 36,000 inventors in my sample, I can classify 16,108 inventors into the above categories.21 These inventors account for approximately 65% of the
sample patents.
B.2. Inventor Level Analysis
I explore changes in inventor-level activity using the instrumental variables approach introduced in Section II.A. I start by investigating changes in the innovation quality of stayers. Next, I examine inventor mobility by studying inventors’ likelihood of leaving, spinning off a company, or joining the firm following the IPO filing.
The results are reported in TableIX, where the unit of observation is at the level of the inventor. In column (1), I explore changes in stayers’ productivity. I
inventors that produce patents at the firm before the IPO filing, and examine the likelihood that they leave the firm. In column (2), I run a similar specifica-tion to that reported in column (1), but now the dependent variable equals one if the inventor is classified as a leaver and zero if an inventor is a stayer. The 2SLS estimates show that inventors in IPO firms are 18% more likely to leave the firm after the IPO, with the coefficient statistically significant at the 1% level.23This result demonstrates that the decline in the quality of innovation
of IPO firms is potentially also driven by the departure of inventors.
Does the increased inventor departure rate also translate into a higher rate of spin-offs? Following Agrawal et al. (2012), I identify all patents produced by leavers postdeparture and the firms to which these patents are assigned. An assigned firm is considered a spin-off if the number of applied patents before the leaver’s patent is zero.24This approach provides an approximation of whether
a leaver started a new company. While not perfect, inaccuracies are similarly likely to affect leavers of IPO and withdrawn firms.
I repeat the specification of column (2), focusing on inventors who produced patents in a sample firm before the IPO filing, and explore the likelihood that they create a spin-off. The 2SLS estimates reported in column (3) of TableIX illustrate that IPO firms are 9.5% more likely to generate spin-offs compared to withdrawn firms, suggesting that IPO firms’ leavers remain entrepreneurial following their departure. This result is also consistent with the finding that the leavers of IPO firms generate higher quality pre-IPO patents relative to the stayers, in contrast to the case of withdrawn firms (see the Internet Appendix).
22Results are similar when using a Poisson specification, as reported in the Internet Appendix. 23A natural concern regarding the validity of the instrument in this setup is that NASDAQ returns may also reflect changes in labor market conditions and thus correlate with the likelihood that an inventor leaves the firm. However, since the empirical exercise compares firms that file to go public in the same year, it may be reasonable to assume that employees of these firms face similar labor market conditions in the five years following the IPO filing. In the Internet Appendix, I show that results remain the same even if restricting the sample to stayers andlateleavers. The time lag between the IPO filing event and late relocations may reduce the likelihood that the two-month NASDAQ change is correlated with future labor market conditions.
Finally, I explore whether IPO firms are more likely to attract new inventors. In column (4) I restrict the analysis to inventors that generate postfiling patents in a sample firm, and as a dependent variable I use an indicator for whether an inventor is a newcomer. Using the 2SLS specification, I find that IPO firms are substantially more likely to hire new inventors. The magnitude of the coefficient is large, corresponding to a 38.8% increase.25
The results reveal that the transition to public equity markets has important implications for the human capital accumulation process, as it shapes firms’ ability to retain and attract inventors. Following the IPO, there is an exodus of inventors leaving the firm, and more spin-offs are generated following their departure. Additionally, going public affects the productivity of the inventors who remain at the firm. The average quality of patents produced by stayers declines substantially at IPO firms. However, this effect is mitigated in part by the ability of IPO firms to attract new inventors who produce patents of higher quality than the inventors who remain at the firm.
C. Acquisition of External Technologies
In this section, I explore how the transition to public equity markets af-fects firms’ reliance on external technologies purchased through mergers and acquisitions.26 I collect information on all acquisitions conducted by IPO and
withdrawn firms using the SDC database.27In results reported in the Internet
Appendix, I find that IPO firms exhibit a sharp increase in M&A activity in the five years following the IPO, while there is no meaningful effect for withdrawn firms.
Acquisitions, however, are used for a variety of reasons. The question remains whether acquisitions are used to buy external technologies. I collect information on patents generated by target firms in the years prior to the acquisition by matching acquisition targets to the NBER patents database.28Approximately
7,500 patents were acquired through mergers and acquisitions in the five years following the IPO filing, relative to approximately 30,000 patents produced. In the Internet Appendix, I show that before the IPO filing both withdrawn and IPO firms rarely acquire external patents through M&A. Following the IPO,
25The results remain the same when focusing on late newcomers, as reported in the Internet Appendix.
26Firms may enhance their innovation activity through other external venues such as joint ventures and strategic alliances (Robinson (2008), Seru (2014)).
27Approximately half of all deals reported on SDC are made by private acquirers (Netter, Stege-moller, and Wintoki (2011)). Nevertheless, to further alleviate concerns about limited coverage of private acquirers, I search CapitalIQ and Lexis-Nexis for additional acquisitions made by sample firms.
External External External External Dependent Variable Patents Patents Patents Patents
Model OLS OLS 2SLS 2SLS
IPO 0.630∗∗∗ 2.603∗∗ 2.489∗
(0.154) (1.277) (1.288)
NASDAQ returns 1.636∗∗
(0.785)
Observations 1,801 1,801 1,801 1,801
R2 0.366 0.365 0.347 0.350
Filing year FE Yes Yes Yes Yes
Industry FE Yes Yes Yes Yes
Control variables Yes Yes Yes Yes
Acquisition propensity No No No Yes
however, the fraction of external patents in IPO firms’ portfolio increases to 31% while it remains small for withdrawn firms (8%).
Similar patterns arise when using the instrumental variables approach. In Table X, the dependent variable is the number of external patents bought through mergers and acquisitions in the five years following the IPO filing. All specifications follow the model described in Section II.A, controlling for filing year and industry fixed effects. I also add all additional control variables previously mentioned. I estimate the 2SLS in column (3) and find that IPO firms acquire 2.6 more patents per year compared to withdrawn firms.
The identifying assumption here is that, for two firms that attempt to go public in thesameyear, changes in short-term NASDAQ fluctuations have a similar effect on the likelihood of acquiring external patents. To further allevi-ate concerns about the exclusion restriction, in column (4) I also control for the industry acquisition intensity in the five years following the IPO filing.29I find
that the results continue to hold. In the Internet Appendix, these results can be
also illustrated by comparing simple averages between firms that experience a NASDAQ drop and other filers in the same year, similar to the approach taken in TableV.
Given the increased reliance on external patents, it is interesting to compare the external and internal patents of IPO firms. In the Internet Appendix, I find that on average external patents exhibit higher quality than patents generated internally, as measured by average scaled citations.30Overall, the results
sug-gest that going public leads to enhanced reliance on external technologies.
IV. Potential Channels
The empirical findings thus far illustrate that the transition to public equity markets changes firms’ innovation strategies. Following the IPO, firms expe-rience a decline in innovation quality, substantial inventor turnover, and an increase in the acquisition of external innovation.
In this section, I discuss four potential explanations for the findings. I focus on four such explanations. The corporate finance literature has long argued that public ownership entails agency problems between managers and shareholders due to the separation of ownership and control (Berle and Means (1932), Jensen and Meckling (1976)). Therefore, I first focus on two hypotheses based on agency problems that can lead publicly traded firms to conduct too little innovation. Specifically, motivated by Aghion, Van Reenen, and Zingales (2013), I focus on the managerial career concerns and the quiet life hypotheses. However, it may be the case that agency problems are more pervasive in private firms, leading to too much innovation. This alternative theory is captured by the excessive innovation hypothesis. Finally, I consider the case in which the results may not be driven by agency problems. In particular, this agency-free hypothesis is motivated by the assumption that commercialization is capital-intensive and thus possible only following the IPO.
I discuss these hypotheses in detail below, and then provide suggestive em-pirical evidence in an attempt to differentiate between these alternative stories.
A. Hypotheses
A.1. Career Concerns Hypothesis
The first hypothesis is based on a variation of the career concerns theory (Holmstrom (1982)). Under this hypothesis, the principal-agent problem occurs between shareholders and the manager. The manager gains private benefits from retaining her job. Innovation may cost the manager her job, however, if shareholders attribute innovation failures, even those due to purely stochastic reasons, to poor managerial skill. As a result, concerns about the impact of
job.
A.2. Quiet Life Hypothesis
Another hypothesis related to the agency problem between shareholders and the manager is based on the idea that innovation is a difficult task that imposes a private cost on the manager (e.g., it may require deviating from standard routines), deterring the manager from innovation activity (based on a simple variation of Holmstrom and Tirole (1997)). This hypothesis, which is similar to the quiet life hypothesis of Bertrand and Mullainathan (2003), predicts that, in privately owned companies, investor monitoring may lead the manager to lose her job if she does not innovate, while, under public ownership, weaker investor incentive to monitor may allow the manager to innovate less. This hypothesis also predicts that an entrenched manager will choose to innovate less following the IPO, as her job is more secure, in contrast to the career concerns hypothesis.
A.3. Excessive Innovation Hypothesis
It may also be the case that private firms innovate too much. If the en-trepreneur gains private benefits from innovation, as opposed to commercial-ization, and she is also the largest owner in a private firm and therefore has control, then the entrepreneur may choose to focus too much on innovation. Here, the principal-agent problem arises between the entrepreneur, who is the largest shareholder, and minority shareholders.32In publicly traded firms, in
contrast, the entrepreneur is not the largest shareholder and has less control, and therefore has less ability to pursue excessive innovation.
31This hypothesis is also consistent with Stein’s (1989) short-termism model.
A.4. Agency-Free Hypothesis
Under the last hypothesis, firms choose to go public to commercialize existing innovation. Commercialization alone cannot explain the results, as all sample firms are attempting to go public. However, if commercialization is capital intensive (more than innovation), then only those firms that successfully complete the IPO can pursue commercialization strategy. If the focus on commercialization leads firms to innovate less, this may explain the decline in innovation quality. In contrast, firms that remain private do not have the resources to commercialize and thus continue to innovate. Importantly, for this hypothesis to hold, it is necessary to assume that some limited resource, such as managerial attention, prevents firms from pursuing commercialization and innovation simultaneously, despite the improved access to capital following the IPO.
B. Empirical Tests
This section provides suggestive empirical evidence in an attempt to distin-guish between the four hypotheses above.
B.1. Excessive Innovation Hypothesis
The excessive innovation hypothesis posits that, when the entrepreneur has control, private firms may conduct too much innovation that may not necessar-ily contribute to firm value. To explore this hypothesis, I compare firms that go public with a set of withdraws firms that remained private in which the entrepreneur has no control. Specifically, I consider private firms owned by VC firms and managed by a professional manager (i.e., a nonfounder manager). These private firms are likely to suffer the least from agency problems that lead to excessive innovation. I repeat the main instrumental variables analy-sis to examine the IPO effect relative to such private firms (see the Internet Appendix). I find that even VC-owned private companies conduct significantly higher quality innovation in the years following the IPO filing relative to firms that go public. Moreover, inventors in such private firms are significantly less likely to leave. This evidence suggests that private firms do not overinvest in innovation, as conjectured by the excessive innovation hypothesis, as compa-nies that are likely to suffer the least from agency problems produce higher quality innovation.
B.2. Agency-Free Hypothesis
Kogan et al. (2012) find that high-quality innovation predicts firm productivity as well as capital and labor flows from noninnovative to innovative firms within an industry. Moreover, in the “use of proceeds” section in the IPO filing prospec-tus, I find that 75% of firms state that they also intend to use proceeds from the IPO for technological development and innovation.34When I repeat the main
instrumental variables strategy restricting the sample to firms that state an intention to innovate, as reported in the Internet Appendix, I find a similar decline in innovation quality similar to the main findings.35
B.3. Career Concerns and Quiet Life Hypotheses
In light of the above evidence, I next consider whether publicly traded firms underinvest in innovation due to agency problems that arise between manage-ment and shareholders. Consistent with the main results, both the quiet life and career concerns hypotheses suggest that innovation will decline following the IPO. However, these hypotheses yield different predictions when interacted
33One may be concerned that these results, discussed in the literature, do not apply to the life cycle stage of firms after the IPO. However, in the Internet AppendixIreplicate these findings and find that innovation remains economically important in the years after the IPO. In particular I find that innovation is correlated with long-run post-IPO buy-and-hold returns, and with risk-adjusted returns, when applying the Brav and Gompers (1997) methodology. Moreover, I use Kogan et al.’s (2012) measure of market reaction to patent approvals, and find that markets react strongly and favorably to patents produced by firms in the years following the IPO. Moreover, the economic importance of patents following the IPO (relative to firm market capitalization) is similar to that described by Kogan et al. (2012) using all patents from 1926 to 2010. I am grateful to the authors for sharing their data.
34I manually collect this information for all firms that file to go public from 1996 (the first year the SEC Edgar system became available). Firms rarely provide the specific amounts to be used for each objective, but rather state in broad terms the planned uses of the proceeds.