75 Agroland : The Agriculture Science Journal, 2017 Desember 4 (2) 75 - 82 ISSN : 2407 – 7585
E-ISSN : 2407 - 7593
GROWTH OF SPINACH (
AMARANTHUS TRICOLOR
L.) UNDER
VARIOUS APPLICATIONS OF NUTRIENT CONCENTRATIONS IN
HYDROPONIC SYSTEM OF NUTRIENT FILM TECHNIQUE
Sindy Sella Rukmi1), Aiyen2), Abdul Rauf 2)
1)
Agrotechnology Program, Faculty of Agriculter, University of Tadulako, Palu Email : [email protected], 2)
Faculty of Agriculter, University of Tadulako, Palu Email : [email protected], Email : [email protected]
ABSTRACT
The research aimed to discover the response of the growth of two spinach species on Nutrient Film Technique (NFT) hydroponic system and the concentration of the appropriate AB Mix solution on each species. The research was conducted in January to February 2016, at Green House, Faculty of Agriculture, Tadulako University by using Split Plot Design method. The main plot was red and green spinach, while the subplot was the concentration of AB Mix nutrient solution, namely 4 ml/L of water, 5 ml/L of water, 6 ml/L of water and 7 ml/L of water. The research findings reveal that AB Mix nutrient solution was generally very good to support the growth of spinach on NFT hydroponic. The green spinach had better response rather than the red one. There was no interaction between species and the concentration of nutrient solution. The good concentration of nutrient solution for green spinach is 6 ml/L. It was showed by the better growth of plant height on all age of plant, the more number of leaves, the canopy and the root (wet and dry) were heavier, while on the red spinach, 5 ml/L of concentration of nutrient solution resulted in the best growth, yet it was not significantly different from other concentration except on the parameter of plant height and the dry weight of plant canopy.
Key Words : Nutrient film technique hydroponic, Nutrient solution, Species.
INTRODUCTION
Hydroponics is a non-media agricultural land system that can be cultivated in various places. Narrow land area, critical soil conditions, uncontrolled pests and diseases, limited amounts of irrigation water, uncertain seasons, and uniform quality can be overcome with this system (Ida, 2014).
One of the most widely used hydroponic forms is the hydroponic NFT or Nutrient Film Technique system. NFT is one of hydroponic system with a method of cultivation where the roots of plants are in a thin layer of water that circulates and contains nutrients in accordance with the
needs of plants (Cooper, 1979 in
Dermawati, 1996).
In the NFT system, nutrients for plants are highly dependent on the nutrients
provided. Nutrient concentrations that are not able to meet the needs of plants in implementing physiological processes can cause the process of inhibition of growth and development, while the concentration of nutrients that are dissolved too thick will cause plant cells undergo plasmolysis, that is the discharge of cell fluids as attracted by the more concentrated nutrient solution (Schwarz,1995 ; Wijayani 2000).
76 achieved was to learn how to grow spinach on the NFT hydroponics system, to study the response of spinach to the concentration
of nutrient solutions in the NFT
hydroponics system, and determine the best nutrient concentration for each spinach species.
RESEARCH METHODS
The study was conducted from January to February 2016 at the Greenhouse Faculty of Agriculture, Tadulako University.
The instruments used in this research were paper label, plastic tray, cork, plastic board, oven, analytical scale, spectrophotometer branded "PG Instrument T-90", centrifuge, pipette, test tube,
measuring cup, documentation and
stationery . The materials used were pure water (Aquades), sand, red and green spinach seeds (produced by CV.Aditya Sentana Agro), alcohol, and ready-mixed nutrient solution under the trademark of AB Mix (produced by CV Sapto Bumi Hidroponik).
This study used a split-plot design method in a complete random form repeated 4 times. The main plot was a type of spinach consisting of 2 treatments namely,
S1: Green Spinach and S2: Red Spinach.
The subplot was the concentration of nutrient solution of AB Mix with 4
concentration level, K1: 4ml/L, K2: 5 ml/L,
K3: 6 ml/L and K4: 7 ml/L.
Research implementation activities were as follows :
1. Seedling
Seeds of green and red spinach were added to the sand medium and kept until 2 weeks old.
2. Preparation of Growing Media
Growing media in the form of
rectangular plastic containers with the length of 28cm x width 21cm x height 4cm. The container was then given a
cover made of plastic board. The board was perforated as many as 4 holes with 2.5 cm diameter functioned as a planting hole. Each container was then filled with 500ml nutrient solution.
3. Planting
Planting was performed after the seeds were 2 weeks old when the plant had grown two or three leaves (uniform). The root of the plant was coated with cork to support the stem of the plant. Each planting hole planted 3 seeds which then nullified until 1 spinach plant.
4. Preparation of nutrient solutions
The nutrient solution was made from AB Mix fertilizer. Stock A and B stock were both crystalline powders each dissolved in 500 ml aquades. The concentration used was that the two solutions were combined into:
K1: 4 ml stock A+ 4 ml stock B then dissolved in 1 liter of aquades
K2 : 5ml stock A+ 5 ml stock B then dissolved in 1 liter of aquades
K3: 6 ml stock A+ 6 ml stock B then dissolved in 1 liter of aquades
K4: 7 ml stock A+ 7 ml stock B then dissolved in 1 liter of aquades
5. Application of nutrient solutions
Application of nutrient solution to the plant was performed by the solution filled into the container that has been
prepared. Application of nutrient
solution in accordance with the
concentration tested. 6. Maintenance
Plant maintenance activities include replacing and adding nutrient solution once a week and controlling plant pests. 7. Harvesting
Harvesting was performed after 4 weeks after planting.
Research Variable
To know the effect of the experiment, then made a number of observations on the growth of plants. The observed as follows: a. Number of leaves, observed at ages of
77
b. Plant height (cm), measured uniformly from the surface of the cork.
c. Fresh weight of root and canopy (g),
weighed after harvesting with analytic scales.
d. Dry weight of root and canopy (g), the
sample was weighed after being put in the oven for 48 hours with temperature
of 650 C.
e. Chlorophyll total (mg/g), measured by
using a spectrophotometer after harvesting. Leaf chlorophyll measurements used the Wintermans and De Mots (1965) method in Banyo et al. (2013), that was 1 g Fresh leaves that dissolved in 20ml ethanol (96%) and measured the absorbance of chlorophyll solution at 649 and 665 nm wavelengths.
Data Analysis
The data obtained were analyzed by analysis of variance (F test), if the treatment had real effect followed by honestly significant different test (HSD) to know the response of plant type and orthogonal test to know the appropriate concentration on each plant type.
RESULTS AND DISCUSSIONS
Results
Plant height. Statistical analysis showed
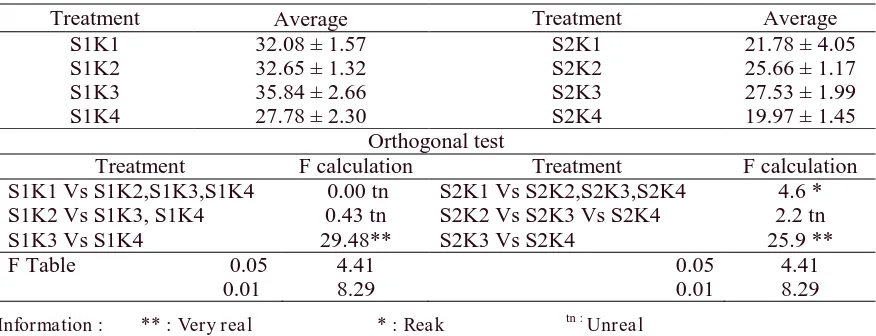
that the concentration of nutrient solution had significant effect on plant height at age of 21 and 28 DAP, whereas the type treatment had significant effect on plant height at age of 14,21 and 28 DAP. The interaction between the concentration of nutrient solution and the type did not have real effect on plant height. At the age of 28 DAP, the nutrient solution of 6 ml/L resulted in the highest plant height of 35.84 ± 2.66 and very real difference with treatment of 7 ml/L. Similarly, in red spinach, the response of nutrient solution of 6 ml/L was significantly different from 4 ml/L and very real to 7 ml/L.
In the type treatment, it was shown that green spinach yielded a higher average plant height than red spinach at all plant ages is presented in Table 2. Plant height growth is presented in Table 1.
Table 1. The average of plant height (cm) on 28 DAP at various concentrations of nutrient solution.
Treatment Average Treatment Average
S1K1 32.08 ± 1.57 S2K1 21.78 ± 4.05
S1K2 32.65 ± 1.32 S2K2 25.66 ± 1.17
S1K3 35.84 ± 2.66 S2K3 27.53 ± 1.99
S1K4 27.78 ± 2.30 S2K4 19.97 ± 1.45
Orthogonal test
Treatment F calculation Treatment F calculation S1K1 Vs S1K2,S1K3,S1K4 0.00 tn S2K1 Vs S2K2,S2K3,S2K4 4.6 * S1K2 Vs S1K3, S1K4 0.43 tn S2K2 Vs S2K3 Vs S2K4 2.2 tn
S1K3 Vs S1K4 29.48** S2K3 Vs S2K4 25.9 **
F Table 0.05 4.41 0.05 4.41 0.01 8.29 0.01 8.29
Information : ** : Very real * : Reak tn : Unreal
Table 2. The average of Plant height (cm) on 14, 21, and 28 DAP of two types of spinach
Treatment Plant height
14 DAP 21 DAP 28 DAP
Green spinach (S1) 7.58b 14.71b 32.09b
Red spinach (S2) 6.08a 11.41a 23.73a
HSD 5% 0.67 0.92 2.28
Information: The number followed by the same alphabet and column has no significant difference at the
78 Number of leaves. Statistical analysis
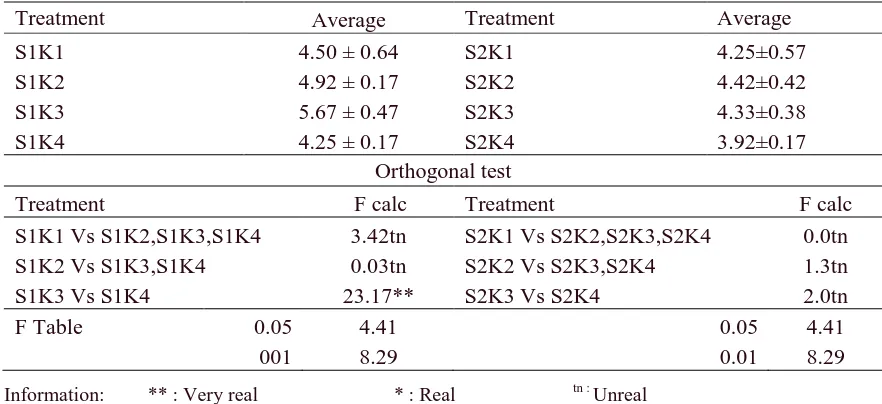
showed that the treatment of nutrient concentration had significant effect on the number of leaves at age of 21 DAP, while at age of 14 and 28 DAP did not have real effect. In the treatment of the type of effect was real to the number of leaves at age of 21 and 28 DAP. The interaction between the concentration of nutrient solution and the type had no significant effect on the number of leaves.
In Table 3, the type of green spinach that produced the most number of leaves obtained from the treatment of nutrient concentration of 6ml/L with the average number of leaves produced was 5.67 leaves but not significantly different with the concentration of 5ml/L. In the red spinach, the highest number of leaves was generated by the 5 ml/L concentration of nutrient
solution with the average number of leaves produced was 4.42 leaves but not significantly different with the concentration of other nutrient solutions.
Based on Table 4, on 21 and 28 DAP green spinach produced more leaves than red spinach. This suggested that green spinach provide a better response than red spinach.
Weight of Root. The statistical analysis of
fresh weight of roots showed that the concentration treatment of nutrient solution, type and interaction between the two treatments did not significantly affect the fresh weight of roots of spinach plants, while the dry weight of roots showed that the type of treatment significantly affected the dry weight of spinach roots but the concentration of nutrient solution and interaction had no significant effect. In the
Table 3. Average number of leaves (helai) on 21 DAP at various concentrations of nutrient solution.
Treatment Average Treatment Average
S1K1 4.50 ± 0.64 S2K1 4.25±0.57
S1K2 4.92 ± 0.17 S2K2 4.42±0.42
S1K3 5.67 ± 0.47 S2K3 4.33±0.38
S1K4 4.25 ± 0.17 S2K4 3.92±0.17
Orthogonal test
Treatment F calc Treatment F calc
S1K1 Vs S1K2,S1K3,S1K4 3.42tn S2K1 Vs S2K2,S2K3,S2K4 0.0tn S1K2 Vs S1K3,S1K4 0.03tn S2K2 Vs S2K3,S2K4 1.3tn
S1K3 Vs S1K4 23.17** S2K3 Vs S2K4 2.0tn
F Table 0.05 4.41 0.05 4.41
001 8.29 0.01 8.29
Information: ** : Very real * : Real tn : Unreal
Table 4. Average Number of leaves on 14, 21, and 28 DAP of two types of spinach.
Treatment Number of leaves
14 DAP 21 DAP 28 DAP
Green spinach (S1) 3.31 4.83b 10.60b
Red spinach (S2) 3.38 4.23a 9.44a
HSD 5% - 0.34 0.87
Information: The number followed by the same alphabet and column has no significant difference at the
79
fresh weight parameter was obtained the
result that green spinach with a
concentration of the nutrient solution of 6ml/L resulted in fresh weight of root which was heavier. In red spinach, a concentration of 5ml /L nutrient solution had heavier fresh weights which are presented in Table 5.
Table 6 showed that root dry weight of green spinach concentrations of 5 and 6 ml/L yielded the heaviest dry weight of root, while in dry weight of roots of red spinach was produced by concentration of 5ml/L. In general, average dry weight of red
spinach roots was heavier than green spinach.
Canopy Weight. The statistical analysis
showed that the treatment of nutrient
concentration and type showed no
significant interaction with fresh canopy weight and each treatment did not significantly affect the fresh weight of spinach canopy while the concentration treatment of nutrient and type significantly affected the dry weight of spinach canopy, but the effect of interaction between nutrition and type had no significant effect.
Table 5. Average Weight of Root (g) at various concentrations of nutrient solution and two types of spinach.
Concentration Treatment
Green Spinach (V1) Red Spinach (V2)
4 ml/L (K1) 4.24 ± 1.36 5.22 ± 0.74
5 ml/L (K2) 5.45 ± 0.60 5.55 ± 0.58
6 ml/L (K3) 5.90 ± 1.74 5.23 ± 1.77
7 ml/L (K4) 4.08 ± 0.76 4.40 ± 0.85
Average 4.9 5.1
Table 6. Average Dry Weight of Root (g) at various concentrations of nutrient solution and two types of spinach.
Concentration Treatment
Green Spinach (V1) Red Spinach (V2)
4 ml/L (K1) 0.27 ± 0.07 0.33 ± 0.06
5 ml/L (K2) 0.28 ± 0.04 0.38 ± 0.02
6 ml/L (K3) 0.28 ± 0.13 0.37 ± 0.15
7 ml/L (K4) 0.24 ± 0.02 0.27 ± 0.04
Average 0.27a 0.34b
HSD 5% 0.06
Information: The number followed by the same alphabet and column has no significant difference at the HSD level of 5%.
Table 7. Average Canopy Fresh Weight (g) of two types of spinach Treatment
Concentration Green Spinach (V1) Red Spinach (V2)
4 ml/L (K1) 9.09± 1.19 9.62± 1.98
5 ml/L (K2) 9.10± 1.50 10.8± 0.44
6 ml/L (K3) 9.95± 1.39 9.69± 1.32
7 ml/L (K4) 8.12± 1.18 9.02± 0.74
80
Based on table 8, the type of green spinach which resulted in the heaviest dry weight that was obtained from the treatment of nutrient solution concentration of 6 ml/L with 0.93 ± 0.12 average but not significantly different with other nutrient concentrations whereas in the heaviest dry weight of red spinach canopy was produced by the concentration of 5 ml/L nutrient solution with average of 1.22 ± 0.18.
In this treatment of type, the heaviest canopy dry weight produced by red spinach of 0.99g while green spinach yielded only 0.65 g of dry weight that is presented in Table 9.
Leaf chlorophyll. Statistical analysis
showed that the interaction of nutrient concentration and type had no significant effect and each treatment also had no significant effect on the amount of plant
Table 8. Average Canopy Fresh Weight at various concentrations of nutrient solution (g).
Treatment Average Treatment Average
S1K1 0.79 ± 0.03 S2K1 0.85 ± 0.11
S1K2 0.90± 0.06 S2K2 1.22 ± 0.18
S1K3 0.93 ± 0.12 S2K3 0.97 ± 0.19
S1K4 0.79 ± 0.15 S2K4 0.89 ± 0.12
Orthogonal test
Treatment F calc Treatment F calc
S1K1 Vs S1K2,S1K3,S1K4 1.12tn S2K1 Vs S2K2,S2K3,S2K4 5.35* S1K2 Vs S1K3,S1K4 0.23tn S2K2 Vs S2K3,S2K4 12.98**
S1K3 Vs S1K4 2.06tn S2K3 Vs S2K4 0.77tn
F Table 0.05 4.41 0.05 4.41
0.01 8.29 0.01 8.29
Information : ** : Very real * : Real tn : Unreal
Table 9. Average Canopy Dry Weight (g) of two types of spinach.
Treatment Canopy Dry Weight
Green spinach (V1) 0.85a
Red spinach (V2) 0.99b
HSD 5% 0.122
Information: The number followed by the same alphabet and column has no significant difference at the
HSD level of 5%
Table 10. Average Number of Chlorophyll (mg/g) at various concentrations of nutrient solution and two types of spinach.
Treatment
Concentration Green Spinach (V1) Red Spinach (V2)
4 ml/L (K1) 0.02± 0.01 0.03± 0.01
5 ml/L (K2) 0.04± 0.01 0.04± 0.01
6 ml/L (k3) 0.05± 0.03 0.03± 0.01
7 ml/L (K4) 0.03± 0.02 0.04± 0.03
81
chlorophyll. The effect of such treatment is presented in Table 10.
Discussions
The results showed that spinach that grown on hydroponic NFT systems could grow well. The free-selling hydroponic nutrient solution, AB-Mix (goodplant) had a positive effect on the growth of green spinach and red spinach.
Different concentrations of nutrient solution had significant effect on plant height, the number of leaves, dry weight of root and canopy dry weight. In plant height, the number of leaves, dry root and canopy weight, nutrient solution concentration of 6 ml/L showed better results on green spinach and 5ml/L in red spinach.
From the observation of plant height, number of leaves, dry root weight, and canopy dry weight, in green spinach there was an increase of crop yield along with the increase of nutrient solution concentration from 4 ml/L to 6 ml/L, but at the concentration of 7 ml/L the was decrease of crop yields. Thus the concentration of 6 ml/L was the optimum concentration in green spinach. In red spinach, there was an increase in crop yield along with the increase of nutrient solution concentration from 4 ml/L to 5 ml/L but there is a decrease in yield at the concentration of 6 to 7 ml/L.
According to Schwarz (1995) in Dermawati (2000) and Kristanti (1998), the concentration of nutrients that is unable to meet the needs of plants in implementing physiological processes can cause the inhibitation of growth and development, while the concentration of nutrients dissolved that is too thick, it can make plants less maximum to absorb nutrients contained therein. Such concentrations can affect plant metabolism, namely the speed of photosynthesis, enzyme activity, and the potential absorption of ion of the solution by the roots so as to affect nutrient absorption.
According to Wijayani and Widodo (2005), concentrated solutions cannot be
absorbed by the roots maximally, due to the cell osmotic pressure being smaller than the osmotic pressure outside the cell, thus the possibility of a return fluid of plant cells (plasmolysis). This was supported by the research of Moerhasrianto (2011), which found that the growth rate of crops tended to increase with increasing concentration of "Growmore" nutrition to a concentration of 2.5 g/l, but decreased at higher concentrations of 3 g/l. The decrease of growth rate is due to nutrient solution which has high nutrient nitrogen content, which according to Runhayat (2007), the use of N nutrient solution concentration above the optimum point causes plant growth to be inhibited. This result is also consistent with the fact that N nutrient is toxic to plants when the amount is too much.
The results of this study also showed a significant effect on the treatment of different types on plant height, number of leaves, and canopy dry weight. The type treatment showed green spinach and red spinach had different growth responses to each of the concentrations of nutrient different growth phase can be expressed on a variety of plant traits that include the shape and function of the plant to produce a growth diversity. The diversity of plant appearance due to differences in genetic makeup is always possible even if the plants used are of the same kind.
CONCLUSIONS AND SUGGESTIONS
Conclusions
This study yields several conclusions:
1. AB-Mix nutrient solution can be used to
82
2. The AB-Mix solution with a
concentration of 6 ml/L gave the best growth for green spinach and 5 ml/L for red spinach.
Suggestions
For better results it is advisable to
use AB Mix as much as 5 ml/L for red spinach and 6 ml/L for green spinach.
REFERENCES
Banyo, Y.E., N.S Ai, P.Siahaan, A.M, Tangapo. 2013. Konsentrasi Klorofil Daun Padi pada Saat Kekurangan Air yang Diinduksi dengan Polietilen Glikol. Jurnal Ilmiah Sains Vol. 13 (1):1-8
Candra Ginting dan Teresjia C. Rakian. 2008. Hidroponik: Pertanian Masa Depan Untuk Masyarakat Perkotaan. WARTA-WIPTEK, Volume 16 Nomor 01-01-2008. Universitas Haluoleo. Kendari
Dermawati.2006. Subtitusi Hara Mineral Organik Terhadap Inorganik Terhadap Produksi Tanaman Pakchoi. Skripsi : Fakultas MIPA. Institut Pertanian Bogor. Bogor
Ida Syamsu Roidah.2014. Pemanfaatan Lahan Dengan Menggunakan Sistem Hidroponik. Jurnal Universitas Tulungagung BONOROWO Vol. 1.No.2 Tahun 2014
Kristanti,N. 1998. Karakteristik Konduktivitas Listrik Larutan Nutrisi Tanaman Selada (Lactuva sativa .L) pada System Nutrient Film Technique (NFT) Dengan Sirkulasi Larutan Nutrisi Secara Berkala. Skripsi; Fakultas Pertanian. Institut Pertanian Bogor. Bogor
Moerhasrianto, P. 2011. Respon Pertumbuhan Tiga Macam Sayuran pada Berbagai Konsentrasi Nutrisi Larutan Hidroponik.Skripsi: Jurusan Budidaya Pertanian. Fakultas Pertanian.Universitas Jember.
Runhayat, A. 2007. Penentuan Kebutuhan Pokok Unsur Hara N, P, K Untuk Pertumbuhan Tanaman Panili (Vanilla planifolia). Buletin Littro (Online) http:// balittro.litbang. deptan.go.id/ind/images/stories/Buletin/.../5-panili.pdf. Diakses tanggal 5 Maret 2016.
Sitompul,S.M. dan Guritno.1995. Analisis Pertumbuhan Tanaman. Gadjah Mada University Press. Yogyakarta
Wijayani, A. 2000. Budiaya Paprika Secara Hidroponik: Pengaruhnya terhadap Serapan Nitrogen dalam Buah. Agrivet Vol 4 (2): 60-65.
Wijayani A. dan Widodo, W. 2005. Usaha Meningkatkan Kualitas Beberapa Varietas Tomat dengan Sistem Budidaya Hidroponik. Ilmu Pertanian, Vol 12 (1) : 77-83.