LAMPIRAN
Lampiran 1
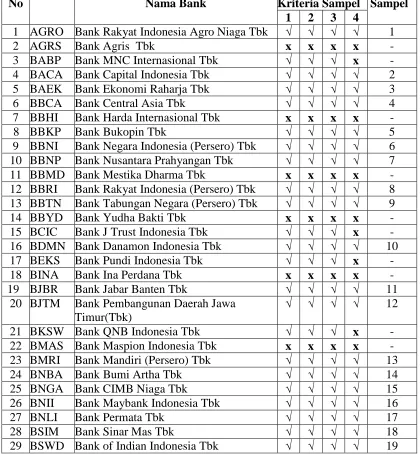
Tabel Seleksi Populasi
No
Nama Bank
Kriteria Sampel Sampel
Lampiran 2
Hasil Perhitungan Capital Adequacy Ratio (CAR), Non Performing Loan (NPL), Return on Asset (ROA), Loan to Deposit
Ratio (LDR), dan Nilai Perusahaan (PBV)
No
Emiten
Tahun CAR
NPL
ROA
LDR
PBV
1
AGRO
2012 14.80038928 3.658922520 1.273991842 82.86946651 1.4008372262
AGRO
2013 21.59846804 2.202027150 1.397116569 89.76613815 1.0505261523
AGRO
2014 19.06196741 1.980581862 1.336743866 90.17195284 0.8489072244
BACA
2012 17.99694082 2.106216305 1.104113055 59.26343114 0.7541076155
BACA
2013 20.12907180 0.367775228 1.307457507 63.51986468 0.5999408306
BACA
2014 16.43479721 0.336441868 1.068940709 58.40301883 0.6107126077
BAEK
2012 14.21408838 0.279936493 0.973337629 82.14570620 0.9951168468
BAEK
2013 13.09916377 0.920264531 1.129482331 84.05746808 1.5302469039
BAEK
2014 13.40677549 2.270052375 0.299910606 85.08084678 1.58973519310
BBCA
2012 14.69396967 0.382948695 3.315178338 69.30449133 4.37061824111
BBCA
2013 16.03368450 0.439578051 3.589651792 76.21748086 3.70017802112
BBCA
2014 17.23754646 0.596560265 3.754566249 77.32291586 4.15290610813
BBKP
2012 16.33937598 2.777273113 1.612684947 84.38219394 0.98628435414
BBKP
2014 15.12436489 2.426220996 1.718464095 86.81291013 0.84611048616
BBNI
2012 16.52872673 2.810020539 2.670107527 77.90951245 1.56068948517
BBNI
2013 14.92328669 2.170063361 2.916856215 85.86716762 1.52084652018
BBNI
2014 16.32592000 1.960037206 3.246558710 88.44475687 1.83529037119
BBNP
2012 12.17345874 0.968762145 1.402229461 84.97422308 0.78230893720
BBNP
2013 15.74920344 0.919859049 1.421257281 84.54135034 0.95183934821
BBNP
2014 16.60299241 1.859936005 1.377661312 85.20360975 1.37375855122
BBRI
2012 16.94595392 1.795102406 4.327585685 77.91747124 2.64250886123
BBRI
2013 16.99171840 1.550928534 4.457174548 86.12581814 2.25459771724
BBRI
2014 18.30634241 1.690043215 3.847980522 82.06316447 2.94048800225
BBTN
2012 17.69114079 4.089987839 1.667315847 100.9210804 1.24647521226
BBTN
2013 15.62433974 4.050086098 1.632061757 104.4272771 0.79532915027
BBTN
2014 14.63587177 4.009979623 1.070836389 108.8711035 1.04322875128
BDMN
2012 18.90057589 2.403927133 3.521813297 103.6519165 1.88028017429
BDMN
2013 17.85591802 1.90015865 3.001678574 96.90316563 1.14402713430
BDMN
2014 17.87236197 2.299974477 1.81572712 94.05976077 1.31049049131
BJBR
2012 18.52929265 2.217028109 2.135065294 75.74448468 1.71049131532
BJBR
2013 16.47153479 2.759514166 2.470289811 97.81131748 1.28451306133
BJBR
2014 16.35015082 4.150536439 1.896829756 100.9894277 0.99924975434
BJTM
2012 26.55599719 2.954167282 3.439593163 83.55066281 1.03309837535
BJTM
2013 23.72314041 3.438065786 3.490562415 84.97956350 0.97822373336
BJTM
2014 22.17086760 3.309807234 3.620807238 86.53650024 1.13543175537
BMRI
2012 15.25281969 1.877940073 3.225875473 80.51748427 2.49486542839
BMRI
2014 16.13463052 2.149999786 3.041731959 83.27914107 2.39799434440
BNBA
2012 19.18250546 0.629997577 2.223815759 77.95078058 0.72946621941
BNBA
2013 16.99290963 0.210014635 1.949119948 83.96157527 0.64257303242
BNBA
2014 15.07206336 0.250047733 1.368306733 79.44546991 0.60613850243
BNGA
2012 15.31306888 2.334912405 2.931388619 93.21991065 1.21692721644
BNGA
2013 15.58204688 2.336137975 2.664646908 91.42171290 0.89061148345
BNGA
2014 15.79912680 4.062448254 1.372506324 96.94224124 0.73555676246
BNII
2012 12.83495418 1.700664224 1.464823705 88.52924536 2.31124556647
BNII
2013 12.71621861 2.109989487 1.554090710 89.02467688 1.50361677848
BNII
2014 15.72405821 2.230016382 0.669721095 96.23682331 0.96186305949
BNLI
2012 16.73099384 1.370041655 1.432550172 90.60284788 1.12496250850
BNLI
2013 14.51123305 1.020025743 1.387836079 88.01877798 0.94984006151
BNLI
2014 13.78659703 1.699992264 1.103978708 90.12766818 1.04388424952
BSIM
2012 18.08749383 3.180544163 1.884114538 80.04093707 1.26744797053
BSIM
2013 21.81751389 2.500518344 1.639780702 78.94702831 1.14295802154
BSIM
2014 18.37943526 3.182166440 0.944963602 84.37531036 1.50597822455
BSWD
2012 21.10050840 1.403479759 2.909466175 93.20737267 3.62277151056
BSWD
2013 15.27721899 1.589993302 3.042842989 93.76344329 1.24037745157
BSWD
2014 14.45068838 1.149670285 2.731620437 88.06480269 1.70321300458
BTPN
2012 21.48619493 0.599833756 4.206841369 86.18116864 3.96454583859
BTPN
2013 23.08829783 0.700568135 4.118281235 88.33159926 2.53467676560
BTPN
2014 23.30535495 0.700086515 3.362709917 97.48469648 1.91277887662
BVIC
2013 18.45029914 0.695162445 1.628715430 79.27883835 0.50953305663
BVIC
2014 18.25262435 3.520404428 0.568840024 76.83525573 0.48680871764
INPC
2012 16.29849219 0.852056598 0.680050412 87.43051514 0.48688651265
INPC
2013 15.75495375 1.955963443 1.385713305 88.87236755 0.45656344766
INPC
2014 15.68711432 1.917710165 0.758002685 87.61873043 0.38023858767
MAYA
2012 10.92936749 3.019749028 2.045495217 80.57881410 5.25820853368
MAYA
2013 14.06901634 1.039944382 2.122073128 85.60586609 3.77776502169
MAYA
2014 10.63691296 1.460141221 1.604286442 81.24546156 2.18413648570
MCOR
2012 13.86247917 1.980003293 1.970949214 80.82987153 0.56676417671
MCOR
2013 14.68274678 1.690410522 1.499365812 83.44951707 0.72496274672
MCOR
2014 14.14885277 2.709714064 0.731330513 84.36619822 0.99311091573
MEGA
2012 17.60057952 2.089957476 2.401158262 53.68742253 1.95023181574
MEGA
2013 16.10918283 2.180104613 0.951550746 57.61253958 2.33320707875
MEGA
2014 16.25634952 2.089977402 1.047266447 66.01049060 2.00204126476
NISP
2012 16.48681081 0.912917944 1.544369692 86.78640858 1.45164394877
NISP
2013 19.28277071 0.732377871 1.568544745 92.48984115 1.04555279378
NISP
2014 18.73989366 1.344465794 1.722902666 93.58739462 1.04666383179
PNBN
2012 16.31114384 1.689951640 2.044768149 90.52168071 0.85989455280
PNBN
2013 16.73639819 2.130022593 1.982354419 87.17178749 0.79654782381
PNBN
2014 17.30092228 2.049993115 2.014739491 90.35069142 1.20807897082
SDRA
2012 14.69763437 1.990174961 2.104192338 84.48835492 2.88520117883
SDRA
2013 13.07287127 2.640586213 2.042257645 91.13668943 3.567844606LAMPIRAN 3
Hasil Uji Deskriptif
Statistics
Mean 16.776511214 1.938826834 2.052155077 85.110294251 1.553048984
Std. Deviation 2.8991722411 .9976071117 .9995208425 10.2472079658 1.0202430846
Minimum 10.6369130 .2100146 .2999106 53.6874225 .3802386
LAMPIRAN 4
Hasil Uji Normalitas
One-Sample Kolmogorov-Smirnov Test
Standardized Residual
N 84
Normal Parametersa,b Mean .0000000
Std. Deviation .97560608
Most Extreme Differences
Absolute .122
Positive .122
Negative -.082
Kolmogorov-Smirnov Z 1.119
Asymp. Sig. (2-tailed) .164
LAMPIRAN 5
Hasil Uji Multikolinearitas
Coefficientsa
Model Collinearity Statistics
Tolerance VIF
1
CAR .873 1.146
NPL .874 1.144
ROA .848 1.179
LDR .892 1.121
LAMPIRAN 6
Hasil Uji Autokorelasi
Model Summaryb
Model R R Square Adjusted R
LAMPIRAN 7
Hasil Uji Heterokedastisitas
Variables Entered/Removeda
Model Variables
Entered
a. Dependent Variable: Abresid b. All requested variables entered.
Model Summaryb
Model R R Square Adjusted R
Square
Std. Error of the Estimate
1 .000a .000 -.051 .81894
a. Predictors: (Constant), LDR, CAR, NPL, ROA b. Dependent Variable: Abresid
ANOVAa
a. Dependent Variable: Abresid
Coefficientsa
Model Unstandardized Coefficients Standardized
Coefficients
LAMPIRAN 8
Hasil Uji Determinasi
Model Summary
Model R R Square Adjusted R
Square
Std. Error of the Estimate
1 .622a .387 .356 .81894
LAMPIRAN 9
LAMPIRAN 10
Hasil Uji t
Coefficientsa
Model Unstandardized Coefficients Standardized
Coefficients