THIS REPORT CONTAINS ASSESSMENTS OF COMMODITY AND TRADE ISSUES MADE BY USDA STAFF AND NOT NECESSARILY STATEMENTS OF OFFICIAL U.S. GOVERNMENT POLICY
-
Date: GAIN Report Number:
Post:
Report Categories:
Approved By:
Prepared By:
Report Highlights:
Greece’s MY 2017/18 apple production is forecast to decrease from the previous year, down 5.2
percent, at 282,000 MT. In MY 2017/18 pear production is forecast to increase from the previous year, up 13.8 percent, at 78,000 MT. Greece is the second largest producer of table grapes in the EU-28, behind Italy. According to industry estimates, table grape production in MY2017/18 is forecast at 320,000 MT, up 14.3 percent compared to the previous campaign.
Dimosthenis Faniadis Fred Giles
Fresh Deciduous Fruit
Fresh Deciduous Fruit Annual 2017
Rome
Greece
IT1766 10/31/2017 Public
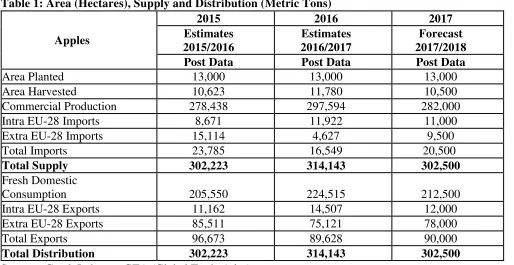
Table 1: Area (Hectares), Supply and Distribution (Metric Tons)
Apples
Commercial Production 278,438 297,594 282,000
Intra EU-28 Imports 8,671 11,922 11,000
Extra EU-28 Imports 15,114 4,627 9,500
Total Imports 23,785 16,549 20,500
Total Supply 302,223 314,143 302,500
Fresh Domestic
Consumption 205,550 224,515 212,500
Intra EU-28 Exports 11,162 14,507 12,000
Extra EU-28 Exports 85,511 75,121 78,000
Total Exports 96,673 89,628 90,000
Total Distribution 302,223 314,143 302,500
Sources: Greek Industry; GTA (Global Trade Atlas)
PRODUCTION
Greece’s MY 2017/18 (July/June) apple production is forecast to decrease from the previous year, down
5.2 percent, at 282,000 MT, due to the hail that occurred in the apple growing areas of North Greece. In Greece, there are approximately 13,000 hectares currently cultivated for apples. The main producing areas include the prefectures of Kastoria, Kozani, Pella, and Imathia in Macedonia; and Magnesia and Larissa in Thessaly. Almost 53 percent of Greek apple orchards consist of red varieties, predominately
Red Delicious. The green varieties (mostly Granny Smith) follow with 15 percent, while Fuji and
Golden Delicious represent 9 percent, respectively. The remaining 14 percent of cultivated orchards are
planted with Gala, Jonagold, Jonagored and new apple varieties (Ariane, Belgica, Cameo, Diwa, Honey
Crunch, Jazz, Junami, Rubens, Tentation, Wellant, etc.).
TRADE
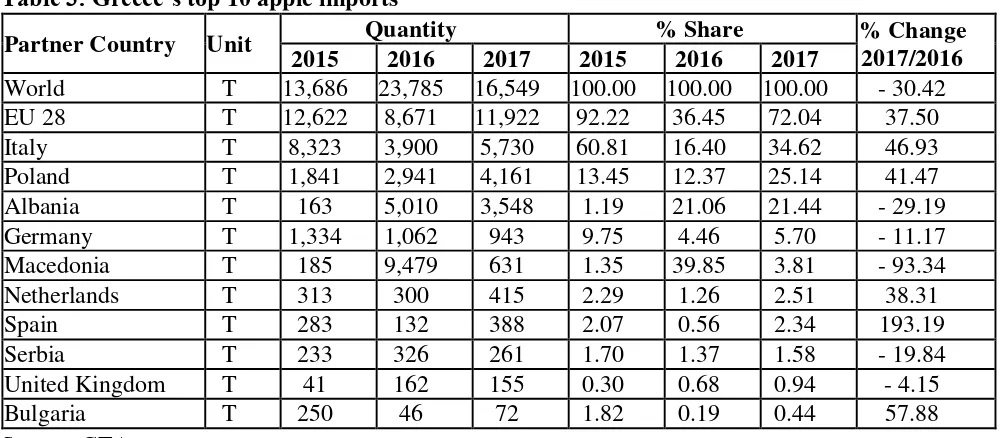
Greece imported 16,549 MT of apples, mainly from Italy (5,730 MT), Poland (4,161 MT), and Albania (3,548 MT).
Table 2: Greece’s top 10 apple exports
Partner Country Unit
Quantity % Share %
Table 3: Greece’s top 10 apple imports
II. PEARS
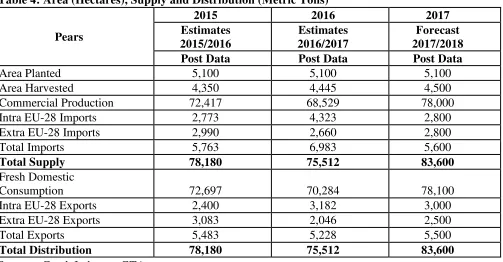
Table 4: Area (Hectares), Supply and Distribution (Metric Tons)
Pears
Commercial Production 72,417 68,529 78,000
Intra EU-28 Imports 2,773 4,323 2,800
Extra EU-28 Imports 2,990 2,660 2,800
Total Imports 5,763 6,983 5,600
Total Supply 78,180 75,512 83,600
Fresh Domestic
Consumption 72,697 70,284 78,100
Intra EU-28 Exports 2,400 3,182 3,000
Extra EU-28 Exports 3,083 2,046 2,500
Total Exports 5,483 5,228 5,500
Total Distribution 78,180 75,512 83,600
Sources: Greek Industry; GTA
PRODUCTION
Greece’s MY 2017/18 (July/June) pear production is forecast to increase from the previous year, up
13.8 percent, at 78,000 MT. There are approximately 5,100 hectares currently cultivated for pears. The main producing areas include the townships of Larissa in Thessaly; Pella and Imathia in Macedonia; and Corinth in Peloponnese. Krystalli (synonymous to the Spanish Blanquilla) is the leading pear variety in Greece. Williams, Kondoules, Santa Maria, Passacrassana, Abate Fetel, and Coscia-Ercollini are also grown in Greece. Fruit quality is expected to be high, with satisfactory calibers and sugar content.
TRADE
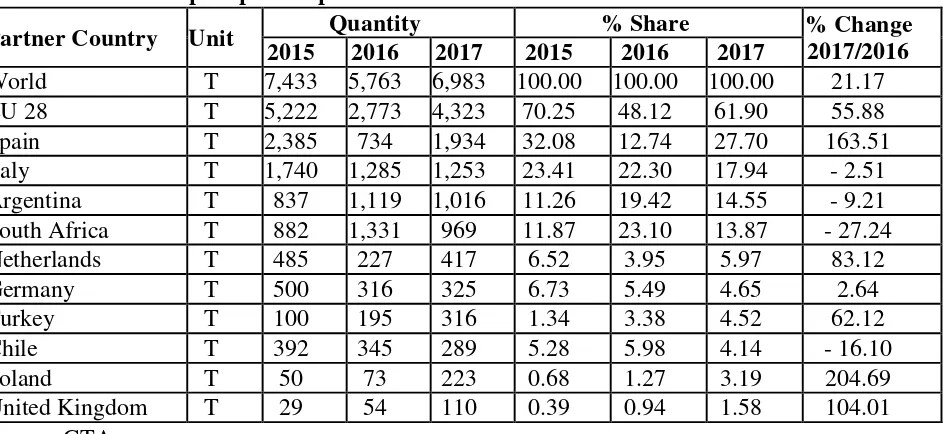
Greece’s MY 2016/17 pear imports reached 6,983 MT, mainly from Spain (1,934 MT), Italy (1,253
MT), and Argentina (1,016 MT). In MY 2016/17, Greece exported 5,228 MT of pears, mostly to Bulgaria (1,829 MT), Albania (1,091 MT), and Romania (659 MT).
Table 5: Greece’s top 10 pear exports
Albania T 1,564 1,240 1,091 31.95 22.62 20.87 - 12.02 Romania T 362 387 659 7.39 7.05 12.61 70.43 Jordan T 109 913 458 2.23 16.65 8.77 - 49.79
Cyprus T 253 339 369 5.16 6.18 7.05 8.84
Macedonia T 291 134 135 5.94 2.44 2.58 1.05
Italy T 0 24 94 0.00 0.44 1.80 289.68
Saudi Arabia T 24 113 92 0.48 2.05 1.77 - 17.99
Kosovo T 0 14 82 0.00 0.25 1.56 493.01
Israel T 61 271 72 1.24 4.94 1.38 - 73.42
Source: GTA
Table 6: Greece’s top 10 pear imports
Partner Country Unit Quantity % Share % Change
2017/2016 2015 2016 2017 2015 2016 2017
World T 7,433 5,763 6,983 100.00 100.00 100.00 21.17 EU 28 T 5,222 2,773 4,323 70.25 48.12 61.90 55.88 Spain T 2,385 734 1,934 32.08 12.74 27.70 163.51 Italy T 1,740 1,285 1,253 23.41 22.30 17.94 - 2.51 Argentina T 837 1,119 1,016 11.26 19.42 14.55 - 9.21 South Africa T 882 1,331 969 11.87 23.10 13.87 - 27.24 Netherlands T 485 227 417 6.52 3.95 5.97 83.12
Germany T 500 316 325 6.73 5.49 4.65 2.64
Turkey T 100 195 316 1.34 3.38 4.52 62.12
Chile T 392 345 289 5.28 5.98 4.14 - 16.10
Poland T 50 73 223 0.68 1.27 3.19 204.69
United Kingdom T 29 54 110 0.39 0.94 1.58 104.01 Source: GTA
III. TABLE GRAPES
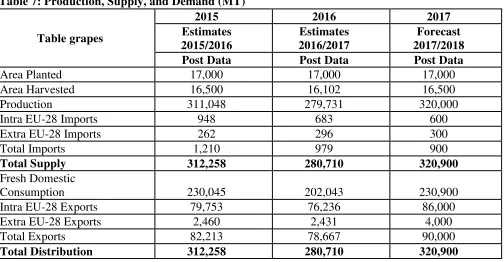
Table 7: Production, Supply, and Demand (MT)
Table grapes
Area Harvested 16,500 16,102 16,500
Production 311,048 279,731 320,000
Intra EU-28 Imports 948 683 600
Extra EU-28 Imports 262 296 300
Total Imports 1,210 979 900
Total Supply 312,258 280,710 320,900
Fresh Domestic
Consumption 230,045 202,043 230,900
Intra EU-28 Exports 79,753 76,236 86,000
Extra EU-28 Exports 2,460 2,431 4,000
Total Exports 82,213 78,667 90,000
Total Distribution 312,258 280,710 320,900
Sources: Greek Industry; GTA
PRODUCTION
Greece is the second largest producer of table grapes in the EU-28, behind Italy. According to industry estimates, table grape production in MY2017/18 is forecast at 320,000 MT. Fruit quality is expected to be good. There are approximately 17,000 hectares currently cultivated with table grapes. The main producing areas include the townships of Corinth in Peloponnese; Kavala in Macedonia; and Heraklion on the island of Crete. The rain in June and the summer drought in some areas of Crete affected the quality; in Corinth and Kavala the production increase compared to last year is estimated at
approximately 20 percent higher with good fruit quality. Sultana (Thompson Seedless) and Victoria are the leading table grape varieties grown in Greece. Crimson Seedless is showing an increased interest for new plantations, currently planted in 1,000 ha; Crimson grapes are forecast down 20 percent for the current year. Moreover, a greater focus is now being placed on diversifying Greece’s grape offer to extend the marketing season into October and November. Other varieties cultivated include the table grapes Prime, Superior, Flame, and Cardinal.
TRADE
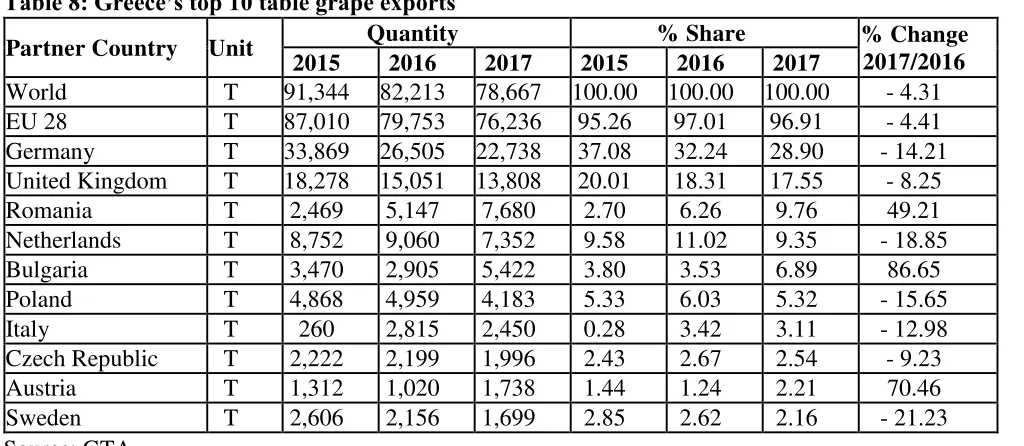
In MY 2016/17, Greece exported 78,667 MT of table grapes, mainly to Germany (22,738 MT), the United Kingdom (13,808 MT), Romania (7,680 MT), and the Netherlands (7,352 MT). Greek table grapes (both seedless and seeded) are mainly marketed within Europe from late July to the end of September. Growers of Thompson Seedless from Corinth and Crete received lower prices than in 2016 due to competition from Spain and Italy in the first half of September. On the other hand, growers of
Greece imported 979 MT of table grapes, mainly from Chile (286 MT), and the Netherlands (273 MT).
Table 8: Greece’s top 10 table grape exports
Partner Country Unit Quantity % Share % Change
Table 9: Greece’s top 10 table grape imports
Partner Country Unit Quantity % Share % Change
Abbreviations and definitions used in this report:
MS EU-28 Member State Ha hectare; 1 ha = 2.471 acres MT Metric ton = 1000 kg
MY Marketing Year Apples: July/June Pears: July/June
Table Grapes: June/May
HS Codes: Apples: 080810 Pears: 080830
Table grapes: 080610