CLUSTERING-BASED APPROACHES TO
THE EXPLORATION OF SPATIO-TEMPORAL DATA
Xiaojing Wu*a, Raul Zurita-Millab, Menno-Jan Kraakb, Emma Izquierdo-Verdiguierb
a Humanities, Arts and Social Sciences, Singapore University of Technology and Design, 8 Somapah Road Singapore 487372, Singapore – [email protected]
bFaculty of Geo-Information Science and Earth Observation (ITC), University of Twente, PO Box 217, 7500 AE, Enschede, the Netherlands – (r.zurita-milla, m.j.kraak, e.izquierdoverdiguier)@utwente.nl
Commission IV, WG IV/3
KEY WORDS: Data Mining; Spatio-temporal Data; Co-clustering; Tri-clustering; Geovisualization
ABSTRACT:
As one spatio-temporal data mining task, clustering helps the exploration of patterns in the data by grouping similar elements together. However, previous studies on spatial or temporal clustering are incapable of analysing complex patterns in spatio-temporal data. For instance, concurrent spatio-temporal patterns in 2D or 3D datasets. In this study we present two clustering algorithms for complex pattern analysis: (1) the Bregman block average co-clustering algorithm with I-divergence (BBAC_I) which enables the concurrent analysis of spatio-temporal patterns in 2D data matrix, and (2) the Bregman cube average tri-clustering algorithm with I-divergence (BCAT_I) which enables the complete partitional analysis in 3D data cube. Here the use of the two clustering algorithms is illustrated by Dutch daily average temperature dataset from 28 weather stations from 1992 to 2011. For BBAC_I, it is applied to the averaged yearly dataset to identify station-year co-clusters which contain similar temperatures along stations and years, thus revealing patterns along both spatial and temporal dimensions. For BCAT_I, it is applied to the temperature dataset organized in a data cube with one spatial (stations) and two nested temporal dimensions (years and days). By partitioning the whole dataset into clusters of stations and years with similar within-year temperature similarity, BCAT_I explores the spatio-temporal patterns of intra-annual variability in the daily temperature dataset. As such, both BBAC_I and BCAT_I algorithms, combined with suitable geovisualization techniques, allow the exploration of complex spatial and temporal patterns, which contributes to a better understanding of complex patterns in spatio-temporal data.
1. INTRODUCTION
Thanks to the advanced technology in data collection and sharing, large volumes of spatio-temporal data are becoming unprecedentedly available with various scopes and coverages (Guo 2003, Miller and Han 2009). Extracting meaningful information from these data becomes the primary challenge in spatio-temporal analytics. Under this situation, data mining is especially useful because it distils information from data and reveals patterns hidden in large datasets.
Clustering is an important task in spatio-temporal data mining. It assigns similar data elements to the same group and thus allows an overview of the data at a higher level of abstraction (Andrienko, Andrienko et al. 2009). However, previous studies have primarily focused on clustering data elements along space or time dimension (Crane and Hewitson 2003, Hagenauer and Helbich 2013). Take spatial clustering for example, it clusters the locations in spatio-temporal data by the similarity of the attribute’s values along all timestamps and the resulting clusters are groups of locations with similar behaviour. Because of this, they are incapable of analysing complex patterns in spatio-temporal data. For instance, concurrent spatio-temporal patterns in 2D or 3D datasets. In this study, we present two clustering algorithms used for complex pattern analysis: (1) the Bregman block average co-clustering algorithm with I-divergence (BBAC_I) which enables the concurrent analysis of spatio-temporal patterns in 2D data matrix, and (2) the Bregman cube average tri-clustering algorithm with I-divergence (BCAT_I) which enables the
* Corresponding author
patterns analysis in 3D data cube. Geovisualization techniques are used to support the representation and understanding of the clustering results (Kraak 2003).
2. LITERATUREREVIEW
2.1 Co-clustering
Euclidean distance) to optimize the co-clustering results and also allows various co-clustering schemes to preserve different sets of summary statistics in the clustering results. However, the co-clustering methods are rarely used for exploring spatio-temporal data.
2.2 Tri-clustering
Tri-clustering analyses spatio-temporal data that fit into a data cube by three dimensions of the data at the same time. There are several studies using tri-clustering methods even though they are relatively new (Sim, Gopalkrishnan et al. 2013). Zhao and Zaki (2005) developed the TRICLUSTER algorithm to analyze a 3D gene expression dataset. Ji, Tan et al. (2006) developed the CubeMiner algorithm to identify the frequent co-occurrences in gene-sample-time dataset. Xu, Lu et al. (2009) developed a 3D cluster model named S2D3 also to identify gene-sample-time tri-clusters in the microarray dataset. Moreover, Sim, Aung et al. (2010) proposed the MIC algorithm to analyze a 3D financial dataset. However, CubeMiner is only applicable to binary 3D datasets while S2D3 identifies clusters that are not axis-parallel, which worsen the task to understand the explored patterns. Although TRICLUSTER and MIC are applicable to quantitative datasets and identify axis-parallel tri-clusters, the significant tri-clusters they are able to identify are usually of few amount (Sim, Gopalkrishnan et al. 2013) and therefore incapable of revealing patterns in the whole dataset. In this context, BCAT_I is developed to enable the complete partitional analysis of the 3D data cube.
3. DATA
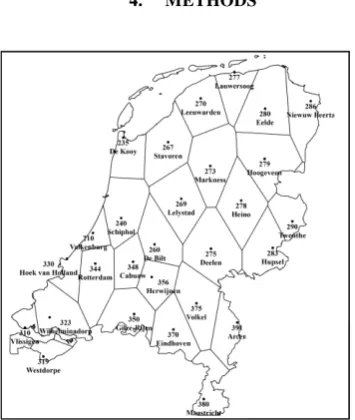
Dutch daily average temperatures collected from 28 weather stations from 1992 to 2011 are used to illustrate this study. To define the area affected by each station, a Thiessen polygon map was generated based on all stations’ geographic coordinates (Figure 1) where each polygon is labelled with station ID and name. The temperature dataset and coordinates are available for free from the website of the Royal
Netherlands Meteorological Institute
(https://data.knmi.nl/portal/KNMI-DataCentre.html). To assure positive temperatures which are required by BBAC_I and BCAT_I, the absolute value of the minimum temperature was added to all the average temperatures in the data matrix and cube.
4. METHODS
Figure 1. Thiessen polygon map of the Dutch weather stations.
Without losing generality, the description of methods is guided by the case study dataset (Dutch daily temperatures at m stations in n years).
4.1 BBAC_I
As one specific case of Bregman co-clustering algorithm, BBAC_I employs the I-divergence as the distance measure because its superiority has been empirically proved by Banerjee, Dhillon et al. (2007). BBAC_I uses the second clustering scheme to preserve co-cluster averages because this scheme considers the variations among attribute values within each co-cluster along both dimensions of the data, which matches the purpose of the co-clustering analysis.
To apply BBAC_I, the case study dataset needs to be averaged to create a yearly temperature dataset, which is organized in a 2D matrix where rows are stations and columns are years. By iteratively mapping stations to station-clusters and years to year-clusters, BBAC_I (which regards the co-clustering problem as an optimization issue) minimizes the loss of mutual information between the original and the co-clustered matrices (Banerjee, Dhillon et al. 2007). As a result, it identifies the station-year co-clusters that contain similar temperatures along both the spatial and the temporal dimensions. By this means, BBAC_I enables the analysis of spatial and temporal patterns in a concurrent fashion. For a detailed explanation, refer to Wu, Zurita-Milla et al. (2015) and Wu, Zurita‐Milla et al. (2016).
4.2 BACT_I
Developed from BBAC_I by (Wu, Zurita-Milla et al. 2017), BCAT_I is an extension of BBAC_I that enables the analysis of 3D data cubes. In this case, the dataset is organized into a cube with stations, years and days as its three dimensions. By iteratively grouping stations to station-cluster, years to year-clusters and days to day-clusters concurrently, BCAT_I identifies tri-clusters with similar temperatures along all the three dimensions.
Like BBAC_I, BACT_I uses I-divergence as distance measure to optimize the loss of mutual information between the original cube and tri-clustered one. Also, it preserves the tri-cluster averages to consider the variations among temperature values within each tri-cluster. Similar temperatures might still exist at different tri-clusters due to the need to predefine the numbers of clusters. This is solved by re-grouping the tri-clusters into an optimal number of temperature groups. For a detailed explanation, refer to Wu, Zurita-Milla et al. (2017).
Figure 3. Spatio-temporal patterns in Dutch yearly temperature dataset (adapted from (Wu, Zurita-Milla et al. 2015))
5. RESULTS
5.1 The co-clustering results
BBAC_I was used to concurrently analyze spatio-temporal patterns in Dutch yearly temperatures. The 28 stations were clustered to four station-clusters and the 20 years to four year-clusters, resulting in 4x4 station-year co-clusters.
The heatmap in Figure 2 provides a straightforward view of station-clusters, year-station-clusters, station-year co-clusters as well as their elements in the co-clustering results. Year-clusters from 1 to 4 that categorize “cold”, “cool”, “warm” and “hot” years and also years belonging to each year-cluster are arranged in the x- axis. From the bottom to the top of the y-axis shows the stations IDs arranged as station-clusters from 1 to 4 with increasing temperature values. Based on the arrangement of axes, the “coldest” co-cluster lies in the bottom-left corner while the “hottest” one in the top-right corner. Also, the temperature values of the co-clusters become increasingly high from left to right and from bottom to top of the heatmap.
The small multiples in Figure 3 display the spatial distribution of four station-clusters for each of four year-clusters. Each map of the small multiples shows the spatial patterns of station-year co-clusters. In each map, the 4 regions indicated by thick lines correspond to 4 station-clusters and each of regions to each of the station-year co-station-clusters shown in Figure 2. These co-clusters reveal the increasing temperature patterns from northeast to southwest of the Netherlands and from “cold” to “hot” years. The timeline below displays the temporal distribution of the four year-clusters with only 3 years belonging to “cool” or “cold” years.
5.2 The tri-clustering results
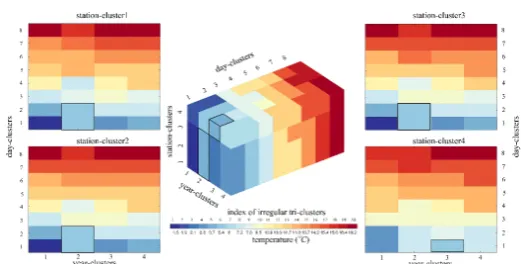
The Dutch daily temperature dataset was subjected to BCAT_I to yield 128 (4 × 4 × 8) clusters, which was re-grouped to 20 irregular tri-clusters.
These irregular tri-clusters are displayed in Figure 4 using a 3D heatmap (centre) and four 2D heatmaps. These heatmaps show that the data cube is fully partitioned and the discrete values for each irregular tri-clusters indicate that similar temperature values of the original dataset are completely identified along spatial, temporal and day
Fiugre 4. 3D heatmap (center) and 2D heatmaps (side subplots) to visualize irregular tri-clusters (Wu, Zurita-Milla et al. 2017)
dimensions, which enables the full exploration of the complex patterns in the data cube.
Then by analysing groups of stations and years that have similar within-year variability from irregular tri-clusters, BCAT_I explored the spatio-temporal patterns of intra-annual variability in Dutch daily temperature dataset. The explored six unique spatial patterns of intra-annual variability are displayed in the small multiples in Figure 5. Extracted from irregular tri-clusters by combining day-clusters with the same spatial patterns, the temporal patterns of temperature variability within each of four year-clusters are displayed in the timeline aligned with the corresponding spatial pattern. Figure 5 shows that even though the Netherlands has a relatively small territory, this country has complex spatio-temporal patterns of intra-annual variability in daily temperatures. For most days from 1992 to 2011, there are two regions in the whole country that are defined by the variability in temperature: the northeast & centre and the southwest. In both cold years (i.e. 1996, 2010) and hot years (most recent years), there is an intense variability in the spring and winter temperatures in the northeast & centre of the country while such a variability in spring temperatures only exists in the southwest. Whereas summer temperatures over the whole Netherlands are homogeneous for most of the study period.
6. CONCLUSION
In this study, we presented the use of two clustering algorithms for complex pattern analysis of spatio-temporal data. The first is the BBAC_I that enables the simultaneous analysis of spatial and temporal patterns in 2D data matrix. By identifying location-timestamp co-clusters which contain similar attribute values along both the spatial and temporal dimensions, this co-clustering algorithm are able to reveal the concurrent space-time varying behaviour in the data. The second is BCAT_I that enables the complete partitional analysis of 3D data cube with one spatial, one temporal and any third (e.g. attribute) dimensions. By partitioning the whole dataset into tri-clusters that contain similar values along three dimensions of the cube, this tri-clustering algorithm allows the full exploration of spatio-temporal pattern in the 3D data cube.
recent years. On the other hand, by organizing the case study dataset in a data cube with one spatial (stations) and two nested temporal dimensions (years and days), BCAT_I enables the exploration of spatio-temporal patterns of intra-annual variability in the dataset. Results show that from 1996 onwards, an intense variability of spring and winter temperatures exists at the northeast & centre of the Netherlands while such variability of spring temperatures is visible only at the southeast of the country.
In summary, both BBAC_I and BCAT_I allows the analysis of complex patterns in spatio-temporal data. By combining suitable geovisualization techniques, both clustering algorithms enable the exploration of complex spatial and temporal patterns, which contributes to a better understanding of spatio-temporal data.
REFERENCES
Andrienko, G., N. Andrienko, S. Rinzivillo, M. Nanni, D. Pedreschi and F. Giannotti (2009). Interactive visual clustering of large collections of trajectories. Visual Analytics Science and Technology, 2009. VAST 2009. IEEE Symposium on, IEEE.
Banerjee, A., I. Dhillon, J. Ghosh, S. Merugu and D. S. Modha (2007). "A generalized maximum entropy approach to bregman co-clustering and matrix approximation." Journal of Machine Learning Research 8: 1919-1986. Cheng, Y. and G. M. Church (2000). Biclustering of expression data. Proceedings ISMB, AAAI Press.
Cho, H., I. S. Dhillon, Y. Guan and S. Sra (2004). Minimum sum-squared residue co-clustering of gene expression data. Fourth SIAM Int'l Conf. Data Mining.
Crane, R. G. and B. C. Hewitson (2003). "Clustering and upscaling of station precipitation records to regional patterns using self-organizing maps (SOMs)." Climate research 25(2): 95-107.
Dhillon, I. S., S. Mallela and D. S. Modha (2003). Information-theoretic co-clustering. The 9th International Conference on Knowledge Discovery and Data Mining (KDD).
Guo, D. (2003). Human-Machine Collaboration for Geographic Knowledge Discovery with High-Dimensional Clustering, The Pennsylvania State University.
Hagenauer, J. and M. Helbich (2013). "Hierarchical self-organizing maps for clustering spatiotemporal data." International Journal of Geographical Information Science 27(10): 2026-2042.
Hartigan, J. A. (1972). "Direct clustering of a data matrix." Journal of American Statistical Association 67(337): 123-129.
Hofmann, T. (2004). "Latent semantic models for collaborative filtering." ACM Transactions on Information Systems (TOIS) 22(1): 89-115.
Ji, L., K. L. Tan and A. K. H. Tung (2006). Mining frequent closed cubes in 3D datasets. The 32nd international conference on Very large data bases. Kraak, M.-J. (2003). "Geovisualization illustrated." ISPRS Journal of Photogrammetry and Remote Sensing 57(5–6): 390-399.
Madeira, S. C. and A. L. Oliveira (2004). "Biclustering algorithms for biological data analysis: a survey." IEEE/ACM Transactions on Computational Biology and Bioinformatics (TCBB) 1(1): 24-45.
Miller, H. J. and J. Han (2009). Geographic data mining and knowledge discovery, CRC Press.
Pensa, R. G. and J.-F. o. Boulicaut (2008). Constrained co-clustering of gene expression data. International Conference on Data Mining SDM'08, Atlanta, USA.
Qiu, G. (2004). Image and feature co-clustering. The 17th International Conference on Pattern Recognition., IEEE.
Qiu, G. (2004). Image and feature co-clustering. Pattern Recognition, 2004. ICPR 2004. Proceedings of the 17th International Conference on, IEEE. Sim, K., Z. Aung and V. Gopalkrishnan (2010). Discovering correlated subspace clusters in 3D continuous-valued data. Data Mining (ICDM), 2010 IEEE 10th International Conference on.
Sim, K., V. Gopalkrishnan, A. Zimek and G. Cong (2013). "A survey on enhanced subspace clustering." Data Mining and Knowledge Discovery 26(2): 332-397.
Takamura, H. and Y. Matsumoto (2002). Two-dimensional clustering for text categorization. The 6th Conference on Natural Language Learning, Association for Computational Linguistics.
Wu, X., R. Zurita-Milla, Izquierdo-Verdiguier E. and M. J. Kraak (2017). "Tri-clustering geo-referenced time series for analyzing patterns of intra-annual variability in temperature." Annals of the Association of American Geographers Accepted.
Wu, X., R. Zurita-Milla and M. J. Kraak (2015). "Co-clustering geo-referenced time series: exploring spatio-temporal patterns in Dutch temperature data." International Journal of Geographical Information Science 29(4): 624-642. Wu, X., R. Zurita‐Milla and M. J. Kraak (2016). "A novel analysis of spring phenological patterns over Europe based on co‐clustering." Journal of Geophysical Research: Biogeosciences 121(6): 1434-1448.
Xu, X., Y. Lu, K.-L. Tan and A. K. Tung (2009). Finding time-lagged 3D clusters. IEEE 25th International Conference on Data Engineering.