Indonesian Journal of Geography Vol. 49, No.1, June 2017 (27 - 33) DOI: http://dx.doi.org/10.22146/ijg.12777, website: https://jurnal.ugm.ac.id/ijg © 2017 Faculty of Geography UGM and he Indonesian Geographers Association
GIS Analysis of Flood Vulnerable Area in Benin–Owena River Basin Nigeria
Adebayo. H. Oluwasegun
Received: 09 02 2016 / Accepted: 27 06 2016 / Published online: 30 06 2017 © 2017 Faculty of Geography UGM and he Indonesian Geographers Association
Abstract he frequency and intensity of lood disasters have become serious issues in the national development process of Nigeria as lood disasters have caused serious environmental damages, loss of human lives and other heavy economic losses; putting the issue of disaster reduction and risk management higher on the policy agenda of afected govern-ments, multilateral agencies and NGOs. he starting point of concrete lood disaster mitigation eforts is to identify the areas with higher risk levels and fashion out appropriate preventive and response mechanisms. his research paper explored the potentials of Geographic Information System (GIS) in data capture, processing and analysis in identifying lood-prone areas for the purpose of planning for disaster mitigation and preparedness, using Benin-Owena river basin of Nigeria as a unit of analysis. he data used in this study were obtained from FORMECU and were entered and use to develop a lood risk information system. Analysis and capability of the developed system was illustrated and shown
Abstrak Frekuensi dan intensitas bencana banjir telah menjadi masalah serius dalam proses pembangunan nasional di Nigeria seperti bencana banjir yang menyebabkan kerusakan lingkungan yang serius, hilangnya nyawa manusia dan ker-ugian ekonomi yang berat; penempatan isu tentang pengurangan bencana dan manajemen risiko lebih tinggi daripada rencana kebijakan pemerintah yang terkena dampak, lembaga multilateral, dan LSM. Titik awal upaya mitigasi bencana adalah untuk mengidentiikasi area yang memiliki tingkat risiko lebih tinggi dan membentuk mekanisme pencegahan dan respon yang sesuai. Laporan penelitian ini menyelidiki kesanggupan Sistem Informasi Geograi (SIG) dalam pengambilan data, pengolahan, dan analisis dalam mengindentiikasi daerah rawan bencana yang menjadi tujuan dari perencanaan mitigasi bencana dan kesiapsiagaan, menggunakan Daerah Aliran Sungai Benin-Owena di Nigeria sebagai unit anali-sis. Data yang digunakan dalam penelitian ini diperoleh dari FORMECU dan telah dimasukkan dan digunakan untuk mengembangkan sistem informasi risiko banjir. Analisis dan kemampuan dari sistem yang dikembangkan digambarkan dan ditunjukkan melalui grais. Penelitian menunjukkan lebih dari seribu pemukiman di daerah penelitian menyimpan sepuluh juta penduduk berisiko terhadap banjir.
Keywords: Flood, Geographical Information System (GIS) Risk, River -Basin, Vulnerability
Kata kunci: Banjir, Daerah Aliran Sungai, Kerentanan, Risiko, Sistem Informasi Geograi,
1. Introduction
Flooding is a major risk to riversides populations and loodplains causing substantial impacts on the environment, including aquatic fauna and lora, bank erosion and other aspects due to the infrastructure such as dams, piers, and lands as well as by poor development practices including riverside development, excessive cleaning, encroachment upon water ways, dredging which may cause changes in the hydrological balance of the water ways involved [Nolan and Marron, 1995]. Worldwide, there has been rapid growth in number of people killed or seriously impacted by lood disasters [UN-Water, 2011]. Indeed, the amount of economic damages afects a large proportion of people in low-lying coastal zones or other areas at risk of looding and extreme weather condition. According to UN-Water [2011] lood is seen to have caused about half of disasters worldwide, and 84% disaster deaths in the world was attributed to looding. Askew [1999] reiterated that loods cause about one third of all deaths,
Adebayo. H. Oluwasegun
Faculty of Social and Management Sciences, Olabisi Onabanjo Uni-versity, Ago-Iwpye, Ogun State, Nigeria.
Correspondent Email : [email protected]
one third of all injuries and one third of all damages from natural disasters.
he primary cause of looding in many parts of the world according to the Action Aid ;[2006] is directly or indirectly related to rainfall in the catchment areas of the major river systems. he unpredictability of rainfall in recent times has caused untold hardship during the raining season. However, looding is not only related to heavy rainfall and extreme climatic events Action Aid [2006]; it is also related to changes in the built up areas themselves. Potschin [2009] asserted that land use is an important determinant of the state of the natural environment. Millennium Ecosystem Assessment MA [2005], for example, has shown that at global scales the conversion of ecosystems through human activities has adversely afected not only biodiversity but a range of ecosystem services. Urban areas such as Lagos, Port Harcourt, Kano, Ibadan, and Benin in Nigeria has always present some risk of looding when rainfall occurs. Prevailing uncoordinated and uncontrolled urban growth allows for buildings or infrastructure to be constructed that actually obstruct natural drainage channels [Aina et al., 1994 ; Aina, 1995].
[2008], documents the lack of provision in six African cities including Lagos, Nigeria for reducing lood risks or for managing loods when they happen. Urbanization aggravates looding by restricting where lood water can go, by covering large parts of the ground with roofs, roads and pavements, by obstructing sections of natural channels and by building drain that ensure that water moves to rivers more rapidly them it did under natural conditions. At extreme cases of lood, many abandon their houses and completely relocate to other areas that are not afected by lood. Some others live in their houses for few months of the year during the dry season, ater which they relocate and come back when another dry season begins. he money that would have been spent to improve the standard of living in the home is spent by families to relocate, helping to further impoverish the people. Shelter is one of the basic needs of man. In some other instances where the afected people cannot relocate, they are forced to live with the lood. his makes them vulnerable to various water-borne diseases such as malaria, diarrhoea, cholera and typhoid fever. Trauma resulting from the circumstance can also cause non-pathogenic diseases such as high blood pressure and diabetes Etiosa and Ogbeibu [2006].
he month of July in Nigeria, which is one of the peak periods of rains have continued to be dreaded by the residents of the lood prone areas within major river basins and cities such as Lagos, Port Harcourt and Benin. For instance, an extreme 10 hours rainfall in Port Harcourt on July, 14 2006 drove ten thousand residents out of their home and caused wide spread traic chaos. he lood problems was aggravated by structures such as the Port Harcourt-Patani - Warri Highway that cut across natural drainage lines and acts as a barriers lood waters [Abam et al. 2000]. Similarly, on the 15th of July 2010, the people in the cities of Lagos and Abeokuta were gripped with shock and stunned seeing the havoc wreaked by torrential rain. he heavy downpour rendered thousands of people homeless and dispossessed them of their valuables, so many roads and bridges were also seriously damaged.
he looding was aggravated by the release of water from the Oyan Dam near Abeokuta, which was illed beyond capacity by the high volume of water from the heavy rainfall in the area. In Nigeria, several studies of the hydrological changes associated with urbanization Akintola [1994] have described the contributions of topographic conditions, rainfall characteristics, land use changes (especially the expansion pave impermeable areas), uncontrolled waste dumping and construction on the loodplain, to lead local looding [Oriola, 1994]. he roles of rainfall amount and intensity have also been well discussed [Olaniran and Babatolu, 1996].he perception of impact adjustment to looding in Nigeria have been extensively studied [Olorogunorisa, 1999]. Heavy rains accompanied by thunderstorms appear to be on the increase in most areas probably because built up surfaces attain higher temperature than surrounding
areas. It is very important to have sound and efective lood management and control measures because loods impose a curse on the society and proper management and control of its occurrence is of vital importance. his is only feasible if there are proper and efective lood hazard maps of the area for proper decision making [Sedogo, 2002; McCall, 2008; Rambaldi et al. 2006]. In the absence of accurate and up-to-date information on issues such as lood hazard and vulnerability, decision-makers oten fail to make decisions or make incorrect decisions [Haack, 1982]. Flood hazard mapping is a vital component in lood mitigation measures; control and land use planning, and is also an important prerequisite for the lood insurance schemes in lood-prone areas [Okosun et al., 2009]. It creates easily-read, rapidly-accessible charts and maps which facilitates the administrators and planners to identify areas of risk and prioritize their mitigation/ response eforts. Such maps are very helpful in planning and decision making process as the identiied sensitive areas can be avoided from being developed. If the area must be developed, lood hazard maps can act as guidelines to further justify the type of development that is to be implemented. GIS applications in lood risk mapping range from storing and managing hydrological data to generating lood inundation and hazard maps to assist lood risk management.
Over the last decade in particular, a great deal of knowledge and experience has been gained in using GIS in lood risk mapping. he basic applications of GIS for hazard and vulnerability mapping as well as identiication of coping mechanisms, overall risk, urban hazards and conlict mapping can be found [McCall, 2008]. Recognizing the importance of up-to-date base maps for efective planning, there is need to utilize the opportunities facilitated by modern geospatial technology through the integration of satellite images with GIS for the production of such maps with high accuracy for the cities of this country. Remote Sensing and other sources are importnat in solivng and reducing the risk of lood hazards. here is an urgent need to include the concepts of disaster geo-information management into emergency preparedness planning, spatial planning and environmental impact assessment. In developing countries like Nigeria, the advantages of lood risk-related spatial information within a GIS context have not been widely explored. here is a need to convert raw data into useful spatial information that allows the community and other actors to develop analytical processes for lood risk analysis and exploration of risk reduction alternatives [Maskrey, 1998; IFRC, 2005].
and detail those factors that are relevant to current and future lood risks in the study area, 3) to examine the impact on and vulnerabilities of residents in the study area to the increasing risk of loods, and 4) to outline policies to be applied to such areas to minimise and manage lood risk.
2. he Methods
he Benin-Owena River Basin is one of the twelve river basin authorities created as part of the Nigeria’s hird National Development Plan in 1977 [Federal Government of Nigeria (FGN), 1975]. Located between longitudes 5o-6o 40I E and latitude 5-70 40I N, the basin is well drained with an average surface slope of
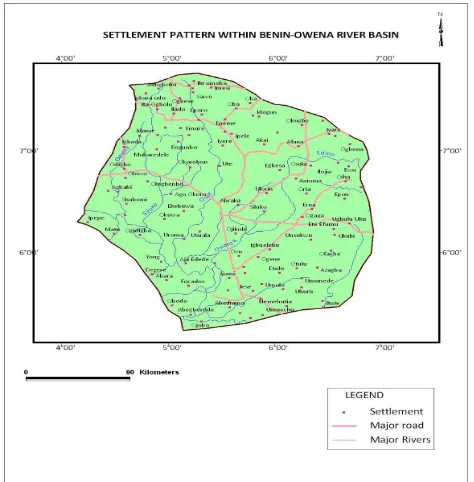
Figure 1. A digital map showing the drainage within Benin-Owena River Basin.
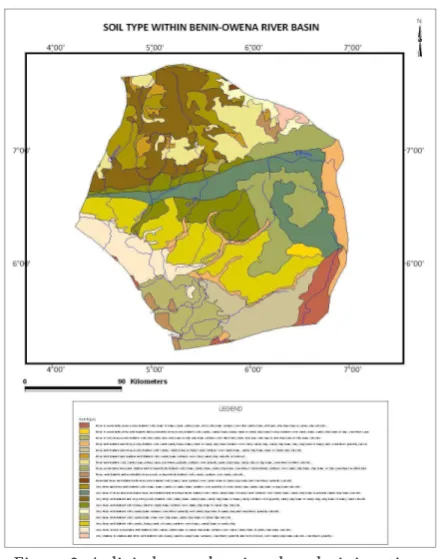
0-6%. Geologically, the basin is within two broad parts-the basement complex rocks of parts-the north with little or no prospect for exploitable groundwater and sedimentary rocks of the south with relatively high groundwater potential. he soils are Oxisols in the south and Utisols in the north. he hydrology is a relection of the geology and is dominated by the extensive River Niger lood plain in the east and other rivers such as the Ubo, Edion,Orle, Okhuamahun and Owena. he average monthly rainfall ranges from 27mm in December to 365mm in July with a mean annual rainfall of 2165m.
he study relies on spatial data obtained from FORMECU. Elevation data for the region was derived from the STRM data which was downloaded from their website. Digitized drainage (igure 1) and administrative boundary maps (igure 2), soil type map (igure 3), and land use map (igure 4) alongside the Digital Elevation Model form the input into the lood risk analysis. hese data are complemented by attribute data like rainfall and population data, obtained mostly from archival sources. Spatial data from satellite images were georeferenced and existing digital data transformed to the WGS_1984 Projection System. his was done to allow for consistency and avoid representation errors that may arise from difering spatial extent of these data. he attribute most especially the population and rainfall data were joined to spatial data based on common ields to further improve the usefulness of the spatial data.
Rainfall data were obtained from Nigeria Meteorological Agency. Drainage map of the study
area was produced from vectorization of the scanned topographical maps of the area and re-projected the data to WGS_1984. Settlement data were obtained from the settlement delineation study conducted by the Nigeria Communication Commission conducted in 2005 which remains the most comprehensive settlement data in the country till date. Soil types and land use data were obtained from digital vector data from FORMECU, a Federal Government Department in charge of forest management.
3. Result and Discussion
he data analysis for this study was essentially carried out within GIS framework, using ESRI’s ArcGIS 10.0TM. hree major variables were used to determine the risk exposure to looding in the study area. From literature, it is apparent that relief, hydrology and human activities are risk factors in looding [Ologunorisa, 2006]. Each of the three variables was categorized into three major categories-high, medium and low risk factors.
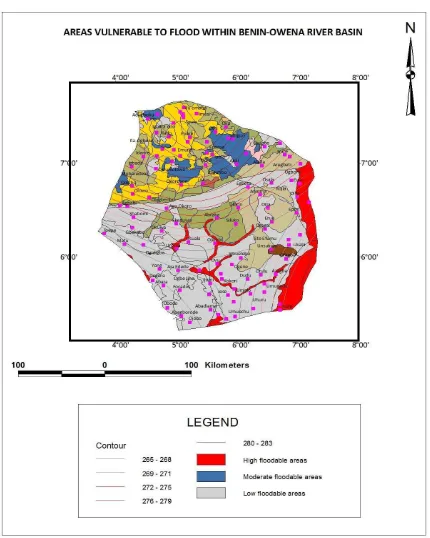
he study area is for the most part a lowland area made up of lood plain of major rivers. his informed the choice of the decision variables for delineating the area into high, medium and low lood risk areas. Since the rainfall regime is essentially the same for most parts of the study area, it was excluded from the decision variables. Generally, areas with height less than 268 metres were designated as high risk areas; areas with height between 268.1 and 280 metres were described as medium or moderate risk areas while areas above Figure 3. A digital map showing the administrative
Figure 4. A digital map showing the administrative boundary of Benin-Owena River Basin
280metres are designated as low risk areas (see igure 5).
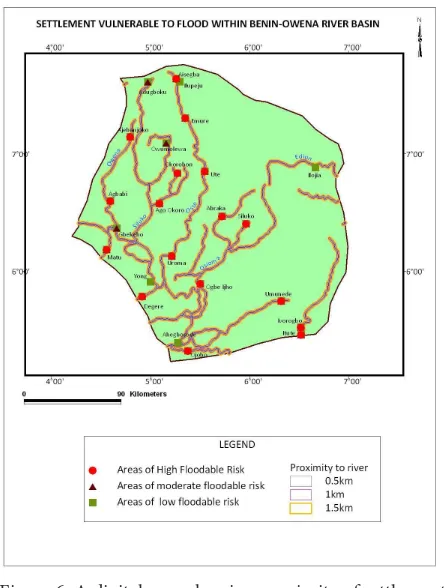
Proximity to river channels is an important variable in this study. Distance from rivers and their tributaries were reckoned at 0.5,1.0 and 1.5km, with areas within 0.5km of river channels were categorized as high risk areas; areas within 0.5-1.0km as medium risk areas and areas located at over 1.0km to the river channels were described as low risk areas (see igure 6).
5. Conclusion
his study has attempted an assessment of lood risk in Benin-Owena River Basin. he study reveals that over 1,000 settlemnts harbouring over 15million people are at grave risk of looding. It is therefore imperative the policies aimed at mitigating the efect of looding be strictly implemented in order to forestall losses in human lives and material possession.
References
Abams, T.K., Ofoegbu, C., Osadebe, C. And Abbobo, A. (2000). Impact of hydrology on the post-Harcourt Patani-Warri Road. Environmental Geology 40 (1), 153-162.
ActionAid. (2006). Climate change, urban looding and the rights of the urban poor in Africa, key inding from 50 African cities, A report by ActionAid, ActionAid International.
ActionAid. (2008). Unjust water. A report by Action Aid International.
Adedeji, O. H., Odufuwa B. O. and Adebayo, O. H. (2012).
Building Capabilities for Flood Disaster and Hazard Preparedness and Risk Reduction in Nigeria: Need for Spatial Planning and Land Management,” Journal of Sustainable Development in Africa. 1 (14), 45-58. Adelekan, I. (2000). Vulnerability of poor urban coastal
communities to climate change in Lagos, Nigeria. Fith Urban Research Symposium.
Aina, T.A. (1995). Metropolitan Lagos: population growth and spatial expansion; city study. Background paper for the Global Report on Human Settlements, 31 pages. Andjeikovic, I. (2001). Guideline on non structural measures
in urban lood management. Technical documents in hydrology. UNESCO, Paris
ASFPM. (2013, Januari 3). Flood Mapping for the Nation : A Cost Analysis for the Nation’s Flood Map Inventory. he Association of State Floodplain Managers (ASFPM). ASFPM Report: Flood Mapping for the Nation.
Ayoade, J.O. (1988). Tropical hydrology and water resources. Macmillan. London.
Birkmann, J. (2000). Measuring vulnerability to promote disaster-resilient societies: Conceptual frameworks and deinitions. Measuring vulnerability to natural hazards: towards disaster resilient societies (pp. 9-54). Tokyo : United Nations University Press .
Barroca, L. (2006). Indicators for identiication of Urban Flooding Vulnerability. Natural Hazards Earth System Science, 6 (4), 553-561.
Blaikie, P., T. Cannon, et al. (1994). At risk: natural hazards, people’s vulnerability and disasters. London etc., Routledge.
Dekens, J. (2007). Local knowledge for disaster preparedness: a literature review. Kathmandu, Nepal: International Centre for Integrated Mountain Development.
Douglas, et.al. Unjust waters: climate change, looding and the urban poor in Africa”, Environment and Urbanization, 20(1): Accessed on 12 December 2013 at: http://www. actionaid.org.uk/doc_lib/urban_looding_africa_report. pdf.
DMSG-Disaster Management Support Group. (2001). he Use of Earth Observing Satellites for Hazard Support Group, Final Report. NOAA, Department of Commerce. USA.
FLOODsite. Task 3: Review of Flood Hazard Mapping. Accessed on 11 April 2008 at : http://www.loodsite.net/ html/publications2.asp?ALLdocs=on&Submit=View. Ifatimehin, O.O. and Ifuah, M.E. (2006). An Analysis of
Urban Expansion and loss of Vegetation in Lokoja using GIS Techniques. Zaria Geographers, 17 (1), 28-36. Haile, A.T. and Rientjes, T.H.M. (2005). Efects of Lidar dem
resolution in lood modelling: A model sensitivity study for the city of Tegucigalpa, Honduras. ISPRS WG III/3, III/4, Workshop “Laser scanning 2005”. Enschede. IPCC. Climate Change Impacts, adaptation and Vulnerability,
Contribution of Working Group II to the Fourth Assessment Report of the Intergovernmental Panel on Climate Change Assessment Report, Summary for Policymakers. Accessed on 12 December 2013 at: http:// www.ipcc.ch/pdf/assessment-report/ar4/wg2/ar4-wg2-spm.pdf.
Ishaya, S., Ifatimehin, O.O., and Abaje, I.B. (2009). Mapping Flood Vulnerable Areas in a Developing Urban Centre of Nigeria. Journal of Sustainable Development Africa, 11 (4), 180-194.
Jayasselan, A.T. (2006). Drought and Floods Assessment and Monitoring Using Remote Sensing and GIS (Electronic version). Satellite Remote Sensing and GIS Application in Agricultural Meteorology. 291-313
Maantay, J and Maroko, A. (2009). Mapping Urban Risk: Flood Hazards, Race and Environmental Justice. Applied Geography, 29 (1), 111-124.
McCall, M.K. Participatory Mapping and Participatory GIS (PGIS) for CRA, Community DRR and Hazard Assessment. Accessed on 12 December 2012 at http:// www.proventionconsortium.org/?pageid=48#action Mitchell, J.K. (1999). Crucibles of Hazard: Megacities and
Disasters in Transition. Tokyo: United Nation University Press.
Okosun, A. E., Ndukwu, R. I, Chiemelu, N. E. (2009). Urban Growth Management of Nigerian Cities: A GIS Approach. Journal of Environmental Management and Safety, 1 (1), 165- 179
Ologunrisa, E. 1999. Flood hazard perception and adjustment in Ondo, Southwestern Nigeria, Journal of Nigeria Afairs. 4 :172-193.
Potschin, M. (2009). Land use and the state of the natural environment. Land Use Policy 26S : S170–S177. Doi:10.1016/J.Landusepol.2009.08.008
Sakamoto, T. (2007). Detecting temporal changes in the extent of annual looding within the Cambodia and the Vietnamese Mekong Delta from MODIS time-series imagery. – Remote Sensing of Environment, 109 (3), 295-313.
Satterthwaite, D., Huq, S., Pelling, M. Reid, H and Romero Lankao, P. (2007). Human Settlements Discussion Paper Series heme: Climate Change and Cities – 1: Adapting to Climate Change in Urban Areas. he possibilities and constraints in low- and middle-income nations.
Accessed at http://www.rockfound.org/initiatives/ climate/climate_change.html.
Sinha, Rajiv and Bapalu, G. Venkata. (2008). GIS in Flood Hazard Mapping: a case study of Kosi River Basin. India. GIS and Development.
Twigg. J. (2004). Good practice Review. Disaster Risk Reduction: “mitigation and preparedness in development and emergency programming. Overseas Development Institute, 111 Westminster Bridge Road, London U.K. Van Western, C.J. and Hosfstee, F. (2000). he role of remote
sensing and GIS in risk mapping and damage assessment for disasters in urban areas. Fernerkundung and Naturkatastophen, 7, 442-450.
Venkata, G. and Sinha, B. GIS in Flood Hazard Mapping: A case study of Kosi River basin. India. Accessed on 23 July 2013 at: http://www.gisdevelopment.net/application/ naturalhazards/loods/loods001.pdf.
UNFCCC. Vulnerability and adaptation to climate change in small island developing states – Background paper for the expert meeting on adaptation for small island developing States. UNFCCC Secretariat. Bonn, Germany. Accessed on 22 May 2011) at: http://unfccc.int/iles/adaptation/ adverse_effects_and_response_measures_art_48/ application/pdf/200702_sids_adaptation_bg.pdf. UN-Water. (2011). Cities coping with water uncertainties.
Media Brief. UN-Water Decade Programme on Advocacy and Communication.