123
Transactions on
Petri Nets
and Other Models
of Concurrency VIII
LNCS 8100
Maciej Koutny
Editor-in-Chief
Journal Subline
Wil M.P. van der Aalst · Alex Yakovlev
Guest Editors
Commenced Publication in 1973
Founding and Former Series Editors:
Gerhard Goos, Juris Hartmanis, and Jan van Leeuwen
Editorial Board
David Hutchison
Lancaster University, UK
Takeo Kanade
Carnegie Mellon University, Pittsburgh, PA, USA
Josef Kittler
University of Surrey, Guildford, UK
Jon M. Kleinberg
Cornell University, Ithaca, NY, USA
Friedemann Mattern
ETH Zurich, Switzerland
John C. Mitchell
Stanford University, CA, USA
Moni Naor
Weizmann Institute of Science, Rehovot, Israel
Oscar Nierstrasz
University of Bern, Switzerland
C. Pandu Rangan
Indian Institute of Technology, Madras, India
Bernhard Steffen
TU Dortmund University, Germany
Madhu Sudan
Microsoft Research, Cambridge, MA, USA
Demetri Terzopoulos
University of California, Los Angeles, CA, USA
Doug Tygar
University of California, Berkeley, CA, USA
Moshe Y. Vardi
Rice University, Houston, TX, USA
Gerhard Weikum
Alex Yakovlev (Eds.)
Transactions on
Petri Nets
and Other Models
of Concurrency VIII
Maciej Koutny Newcastle University School of Computing Science Newcastle upon Tyne, NE1 7RU, UK E-mail: [email protected]
Guest Editors
Wil M.P. van der Aalst
Eindhoven University of Technology
Department of Mathematics and Computer Science 5600 MB Eindhoven, The Netherlands
E-mail: [email protected] Alex Yakovlev
Newcastle University
School of Electrical, Electronic and Computer Engineering Newcastle upon Tyne, NE1 7RU, UK
E-mail: [email protected]
ISSN 0302-9743 (LNCS) e-ISSN 1611-3349 (LNCS) ISSN 1867-7193 (ToPNoC) e-ISSN 1867-7746 (ToPNoC) ISBN 978-3-642-40464-1 e-ISBN 978-3-642-40465-8 DOI 10.1007/978-3-642-40465-8
Springer Heidelberg New York Dordrecht London
CR Subject Classification (1998): D.2, F.3, F.1, D.3, J.1, I.6, I.2
© Springer-Verlag Berlin Heidelberg 2013
This work is subject to copyright. All rights are reserved by the Publisher, whether the whole or part of the material is concerned, specifically the rights of translation, reprinting, reuse of illustrations, recitation, broadcasting, reproduction on microfilms or in any other physical way, and transmission or information storage and retrieval, electronic adaptation, computer software, or by similar or dissimilar methodology now known or hereafter developed. Exempted from this legal reservation are brief excerpts in connection with reviews or scholarly analysis or material supplied specifically for the purpose of being entered and executed on a computer system, for exclusive use by the purchaser of the work. Duplication of this publication or parts thereof is permitted only under the provisions of the Copyright Law of the Publisher’s location, in its current version, and permission for use must always be obtained from Springer. Permissions for use may be obtained through RightsLink at the Copyright Clearance Center. Violations are liable to prosecution under the respective Copyright Law.
The use of general descriptive names, registered names, trademarks, service marks, etc. in this publication does not imply, even in the absence of a specific statement, that such names are exempt from the relevant protective laws and regulations and therefore free for general use.
While the advice and information in this book are believed to be true and accurate at the date of publication, neither the authors nor the editors nor the publisher can accept any legal responsibility for any errors or omissions that may be made. The publisher makes no warranty, express or implied, with respect to the material contained herein.
Typesetting:Camera-ready by author, data conversion by Scientific Publishing Services, Chennai, India
Printed on acid-free paper
The 8th issue of the LNCS Transactions on Petri Nets and Other Models of Concurrency (ToPNoC) contains revised and extended versions of a selection of the best papers from the workshops and tutorials held at the 33rd Interna-tional Conference on Application and Theory of Petri Nets and Other Models of Concurrency, Hamburg, Germany, 25–29 June 2012.
I would like to thank the two guest editors of this special issue: Wil van der Aalst and Alex Yakovlev. Moreover, I would like to thank all authors, reviewers, and the organizers of the Petri net conference satellite workshops, without whom this issue of ToPNoC would not have been possible.
June 2013 Maciej Koutny
Models of Concurrency: Aims and Scope
ToPNoC aims to publish papers from all areas of Petri nets and other models of concurrency ranging from theoretical work to tool support and industrial applications. The foundations of Petri nets were laid by the pioneering work of Carl Adam Petri and his colleagues in the early 1960s. Since then, a huge volume of material has been developed and published in journals and books as well as presented at workshops and conferences.
The annual International Conference on Application and Theory of Petri Nets and Other Models of Concurrency started in 1980. The International Petri Net Bibliography maintained by the Petri Net Newsletter contains close to 10,000 different entries, and the International Petri Net Mailing List has 1,500 sub-scribers. For more information on the International Petri Net community, see: http://www.informatik.uni-hamburg.de/TGI/PetriNets/
All issues of ToPNoC are LNCS volumes. Hence they appear in all main libraries and are also accessible in LNCS Online (electronically). It is possible to subscribe to ToPNoC without subscribing to the rest of LNCS.
ToPNoC contains:
– revised versions of a selection of the best papers from workshops and tutorials concerned with Petri nets and concurrency;
– special issues related to particular subareas (similar to those published in theAdvances in Petri Nets series);
– other papers invited for publication in ToPNoC; and
– papers submitted directly to ToPNoC by their authors.
Like all other journals, ToPNoC has an Editorial Board, which is responsible for the quality of the journal. The members of the board assist in the reviewing of papers submitted or invited for publication in ToPNoC. Moreover, they may make recommendations concerning collections of papers for special issues. The Editorial Board consists of prominent researchers within the Petri net community and in related fields.
Topics
nets; higher level net models; timed and stochastic nets; and standardization of nets.
Applications of nets to: biological systems; defence systems; e-commerce and trading; embedded systems; environmental systems; flexible manufacturing sys-tems; hardware structures; health and medical syssys-tems; office automation; oper-ations research; performance evaluation; programming languages; protocols and networks; railway networks; real-time systems; supervisory control; telecommu-nications; cyber physical systems; and workflow.
For more information about ToPNoC see: www.springer.com/lncs/topnoc
Submission of Manuscripts
Models of Concurrency: Editorial Board
Editor-in-Chief
Maciej Koutny, UK
(http://www.ncl.ac.uk/computing/people/profile/maciej.koutny)
Associate Editors
Grzegorz Rozenberg, The Netherlands Jonathan Billington, Australia Susanna Donatelli, Italy
Wil van der Aalst, The Netherlands
Editorial Board
Didier Buchs, Switzerland Gianfranco Ciardo, USA Jos´e-Manuel Colom, Spain J¨org Desel, Germany Michel Diaz, France Hartmut Ehrig, Germany Jorge C.A. de Figueiredo, Brazil Luis Gomes, Portugal
Serge Haddad, France Xudong He, USA
Kees van Hee, The Netherlands Kunihiko Hiraishi, Japan Gabriel Juhas, Slovak Republic Jetty Kleijn, The Netherlands Maciej Koutny, UK
Lars M. Kristensen, Norway Charles Lakos, Australia Johan Lilius, Finland Chuang Lin, China Satoru Miyano, Japan Madhavan Mukund, India Wojciech Penczek, Poland Laure Petrucci, France Lucia Pomello, Italy Wolfgang Reisig, Germany Manuel Silva, Spain
P.S. Thiagarajan, Singapore Glynn Winskel, UK
This volume of ToPNoC contains revised and extended versions of a selection of the best workshop papers presented at the 33rd International Conference on Application and Theory of Petri Nets and Other Models of Concurrency (Petri Nets 2012).
We, Wil van der Aalst and Alex Yakovlev, are indebted to the program com-mittees of the workshops and in particular their chairs. Without their enthusi-astic work this volume would not have been possible. Many members of the pro-gram committees participated in reviewing the extended versions of the papers selected for this issue. The following workshops were asked for their strongest contributions:
– PNSE 2012: International Workshop on Petri Nets and Software Engineering (chairs: Lawrence Cabac, Michael Duvigneau, and Daniel Moldt),
– CompoNet 2012: International Workshop on Petri Nets Compositions (chairs: Hanna Klaudel and Franck Pommereau),
– LAM 2012: International Workshop on Logics, Agents, and Mobility (chairs: Berndt M¨uller and Michael K¨ohler-Bußmeier),
– BioPNN 2012: International Workshop on Biological Processes and Petri Nets (chairs: Monika Heiner and Hofest¨adt)
The best papers of these workshops were selected in close cooperation with their chairs. The authors were invited to improve and extend their results where possible, based on the comments received before and during the workshop. The resulting revised submissions were reviewed by three to five referees. We followed the principle of also asking for fresh reviews of the revised papers, i.e. from ref-erees who had not been involved initially in reviewing the original workshop contribution. All papers went through the standard two-stage journal reviewing process and eventually ten were accepted after rigorous reviewing and revis-ing. Presented are a variety of high-quality contributions, ranging from model checking and system verification to synthesis, and from work on Petri-net-based standards and frameworks to innovative applications of Petri nets and other models of concurrency.
The paper by Paolo Baldan, Nicoletta Cocco, Federica Giummol, and Marta Simeoni,Comparing Metabolic Pathways through Reactions and Potential Fluxes proposes a new method for comparing metabolic pathways of different organisms based on a similarity measure that considers both homology of reactions and functional aspects of the pathways. The paper relies on a Petri net representation of the pathways and compares the corresponding T-invariant bases. A prototype tool, CoMeta, was implemented and used for experimentation.
(DSML) for Wireless Sensor Networks (WSNs) offering support for formal veri-fication. Descriptions in this language are automatically translated into a formal specification for model checking. The authors present the language and its trans-lation, and discuss a case study illustrating how several metrics and properties relevant to the domain can be evaluated.
The paperLocal State Refinement on Elementary Net Systems: An Approach Based on Morphisms by Luca Bernardinello, Elisabetta Mangioni, and Lucia Pomello presents a new kind of morphism for Elementary Net Systems for per-forming abstraction and refinement of local states in systems. These α-mor-phisms formalize the relation between a refined net system and an abstract one, by replacing local states of the target net system with subnets.The main re-sults concern behavioral properties preserved and reflected by the morphisms. In particular, the focus is on the conditions under which reachable markings are preserved or reflected, and the conditions under which a morphism induces a weak bisimulation between net systems.
The paperFrom Code to Coloured Petri Nets: Modelling Guidelinesby Anna Dedova and Laure Petrucci presents a method for designing a coloured Petri net model of a system starting from its high-level object-oriented source code. The entire process is divided into two parts: grounding and code analysis. For each part detailed step-by-step guidelines are given. The approach is illustrated using a case study based on the so-called NEO protocol.
The paper by Agata Janowska, Wojciech Penczek, Agata P´olrola, and An-drzej Zbrzezny,Using Integer Time Steps for Checking Branching Time Proper-ties of Time Petri Nets extends the result of Popova, which states that integer time steps are sufficient to test reachability properties of time Petri nets. The authors prove that the discrete-time semantics is also sufficient to verify proper-ties of the existential and the universal version of CTL∗for time Petri nets with the dense semantics. They compare the results for SAT-based bounded model checking of the universal version of CTL-X properties and the class of distributed time Petri nets.
The paperWhen Can We Trust a Third Party? – A Soundness Perspective by Kees M. van Hee, Natalia Sidorova, and Jan Martijn van der Werf explores the validity of a system comprising two agents and a third-party notary, which provides a communication interface between the agents, without any of them getting knowledge of the actual implementation features of the other. This is studied in a business-process setting, where the components are modelled as communicating workflow nets. The paper shows that if the notary is an acyclic state machine, or if it contains only single-entry-single-exit (SESE) loops, then the notary ensures soundness if it is sound with each of the organizations indi-vidually.
deterministic approaches to modelling the different aspects of the process, and the “hybridization” also includes mixing continuous and discrete elements. The new model is implemented using Snoopy, a tool for animating and simulating Petri nets in various paradigms.
The paperSimulative Model Checking of Steady-State and Time-Unbounded Temporal Operators by Christian Rohr starts from the observation that large stochastic models can only be analyzed using simulation. Hence, the author advocates simulative model checking. While finite time horizon algorithms are well known for probabilistic linear-time temporal logic, Rohr provides an infinite time horizon procedure as well as steady state computation, based on exact stochastic simulation algorithms. The paper illustrates the applicability of this idea using the model checking tool MARCIE applied to models of the RKIP-inhibited ERK pathway and angiogenetic process.
The paperModel-Driven Middleware Support for Team-Oriented Process Man-agement by Matthias Wester-Ebbinghaus and Michael K¨ohler-Bußmeier pro-poses a model for collaborative processes that provides a way to capture the whole context of team-oriented process management: from the underlying orga-nizational structure over team formation up to process execution by the team. The model is based on Mulan, a multi-agent system framework, so as to benefit from the advantages of high-level Petri nets implementing a hierarchical organi-zation described with place-transition nets (Sonar model) and subject to on-line dynamic changes. A running example provides an effective illustration of the model.
The paperGrade/CPN: A Tool and Temporal Logic for Testing Colored Petri Net Models in Teaching by Michael Westergaard, Dirk Fahland, and Christian Stahl proposes a semi-automatic tool for grading Petri net modelling assign-ments. It permits the teacher to describe the expected constraints of the model to be designed, as well as the properties that should be satisfied. The tool per-forms basic well-formedness checks, and simulates the model with the view to test some properties that are specified in Britney Temporal Logic developed by the authors. The tool is extensible by means of plugins.
As guest editors, we would like to thank all authors and referees who have contributed to this issue. Not only is the quality of this volume the result of the high scientific value of their work, but we would also like to acknowledge the excellent cooperation throughout the whole process that has made our work a pleasant task. Finally, we would like to pay special tribute to the work of Ine van der Ligt of Eindhoven University of Technology who has provided technical sup-port for the composition of this volume, including interactions with the authors. We are also grateful to the Springer/ToPNoC team for the final production of this issue.
June 2013 Wil van der Aalst
Guest Editors
Wil van der Aalst, The Netherlands Alex Yakovlev, UK
Co-chairs of the Workshops
Lawrence Cabac (Germany) Michael Duvigneau (Germany) Monika Heiner (Germany) Ralf Hofest¨adt (Germany) Hanna Klaudel (France)
Michael K¨ohler-Bußmeier (Germany) Daniel Moldt (Germany)
Berndt M¨uller (UK)
Franck Pommereau (France)
Referees
Paolo Baldan Kamel Barkaoui Marco Beccuti Liu Bing Rainer Breitling Claudine Chaouiya Gianfranco Ciardo Jos¨e Manuel Colom Raymond Devillers David Gilbert Luis Gomes Stefan Haar Vladimir Janousek Agata Janowska Radek Koci
Michael K¨ohler-Bußmeier Victor Khomenko
Hiroshi Matsuno
Sucheendra Kumar Palaniappan Wojciech Penczek
Laure Petrucci
Louchka Popova-Zeugmann Hanna Klaudel
Comparing Metabolic Pathways through Reactions and Potential
Fluxes. . . 1 Paolo Baldan, Nicoletta Cocco, Federica Giummol`e, and
Marta Simeoni
Modeling and Analyzing Wireless Sensor Networks with VeriSensor:
An Integrated Workflow . . . 24 Yann Ben Maissa, Fabrice Kordon, Salma Mouline, and
Yann Thierry-Mieg
Local State Refinement and Composition of Elementary Net Systems:
An Approach Based on Morphisms. . . 48 Luca Bernardinello, Elisabetta Mangioni, and Lucia Pomello
From Code to Coloured Petri Nets: Modelling Guidelines . . . 71 Anna Dedova and Laure Petrucci
Using Integer Time Steps for Checking Branching Time Properties of
Time Petri Nets . . . 89 Agata Janowska, Wojciech Penczek, Agata P´olrola, and
Andrzej Zbrzezny
When Can We Trust a Third Party?: A Soundness Perspective . . . 106 Kees M. van Hee, Natalia Sidorova, and
Jan Martijn E.M. van der Werf
Hybrid Petri Nets for Modelling the Eukaryotic Cell Cycle . . . 123 Mostafa Herajy, Martin Schwarick, and Monika Heiner
Simulative Model Checking of Steady State and Time-Unbounded
Temporal Operators. . . 142 Christian Rohr
Model-Driven Middleware Support for Team-Oriented Process
Management . . . 159 Matthias Wester-Ebbinghaus and Michael K¨ohler-Bußmeier
Grade/CPN: A Tool and Temporal Logic for Testing Colored Petri Net
Models in Teaching . . . 180 Michael Westergaard, Dirk Fahland, and Christian Stahl
through Reactions and Potential Fluxes
Paolo Baldan1, Nicoletta Cocco2, Federica Giummol`e2, and Marta Simeoni2
1 Dipartimento di Matematica, Universit`a di Padova, Italy 2 DAIS, Universit`a Ca’ Foscari Venezia, Italy
Abstract. Comparison of metabolic pathways is useful in phylogenetic analysis and for understanding metabolic functions when studying dis-eases and in drugs engineering. In the literature many techniques have been proposed to compare metabolic pathways. Most of them focus on structural aspects, while behavioural or functional aspects are generally not considered. In this paper we propose a new method for comparing metabolic pathways of different organisms based on a similarity measure which considers both homology of reactions and functional aspects of the pathways. The latter are captured by relying on a Petri net repre-sentation of the pathways and comparing the corresponding T-invariant bases, which represent minimal subsets of reactions that can operate at a steady state. A prototype tool, CoMeta, implements this approach and allows us to test and validate our proposal. Some experiments with CoMetaare presented.
1
Introduction
The life of an organism depends on its metabolism, the chemical system which generates the essential components - amino acids, sugars, lipids and nucleic acids - and the energy necessary to synthesise and use them. Subsystems of metabolism dealing with some specific functions are called metabolic pathways. An example is the Glycolysis pathway, a fundamental pathway common to most organisms which converts glucose into pyruvate and releases energy. Comparing metabolic pathways of different species yields interesting information on their evolution and it may help in understanding metabolic functions, which is important when studying diseases and for drugs design. Differences in metabolic functions may be interesting for industrial processes as well, for example someArchaea and Bacteria, because of environmental constraints, have developed alternative sugar metabolic pathways, which use and transform different compounds with respect toGlycolysis and as a result they may behave as methanogens or denitrifying.
In the recent literature many techniques have been proposed for comparing metabolic pathways of different organisms. Each approach chooses a representa-tion of metabolic pathways which models the informarepresenta-tion of interest, proposes a similarity or a distance measure and possibly supplies a tool for performing the comparison.
M. Koutny et al. (Eds.): ToPNoC VIII, LNCS 8100, pp. 1–23, 2013. c
Representations of metabolic pathways at different degrees of abstraction have been considered. A pathway can be simply viewed as a set of components of inter-est, which can be reactions, enzymes or chemical compounds. In other approaches pathways are decomposed into sets of paths, leading from an initial metabolite to a final one. The most detailed representations model a metabolic pathway as a graph. Clearly, more detailed models produce more accurate comparison results, in general at the price of being more complex.
The distance measures in the literature generally focus on static, topological information of the pathways, disregarding the fact that they represent dynamic processes. We propose to take into account behavioural aspects: we represent the pathways as Petri nets (PNs) and compare aspects related to their behaviour as captured by T-invariants. PNs seem to be particularly natural for representing and modelling metabolic pathways (see, e.g., [10] and references therein). The graphical representations used by biologists for metabolic pathways and the ones used in PNs are similar; the stoichiometric matrix of a metabolic pathway is analogous to the incidence matrix of a PN; the flux modes and the conservation relations for metabolites correspond to specific properties of PNs. In particular minimal (semi-positive) T-invariants correspond to elementary flux modes [51] of a metabolic pathway, i.e., minimal sets of reactions that can operate at a steady state. The space of semi-positive invariants has a unique basis of minimal T-invariants which is characteristic of the net and we use it in the comparison. The similarity measure between pathways that we propose considers both homology of reactions, represented either by the Sørensen or by the Tanimoto index on the multisets of enzymes in the pathways, and similarity of behavioural aspects as captured by the corresponding T-invariant bases.
We developed a prototype tool,CoMeta, implementing our proposal. A first
version ofCoMeta, with some experiments, was presented in [12]. In this paper
we give a detailed description of the present extended version of the tool and report on further experiments for its validation. Given a set of organisms and a set of metabolic pathways, CoMeta automatically gets the corresponding
data from the KEGG database, which collects metabolic pathways for different species. Then it builds the corresponding PNs, computes the T-invariants and the similarity measures and gives the results of the comparison among organisms as a distance matrix. Such matrix can be visualised as a phylogenetic tree.
The tool CoMeta offers the possibility of representing a pathway either in
isolation or as an interactive subnet. Several experiments withCoMeta have
been performed and the approach viewing a pathway as an isolated subsys-tem, despite the fact that it excludes the input-output fluxes from the analysis, generally provides better results. This could be due to the fact that the com-pletely automatised approach to open subnetworks, which consists in taking as input/output all metabolites which are either only produced or only con-sumed by the pathway and all metabolites linking the pathway to the rest of the network, is probably too rough and needs to be refined.
A further interesting development of CoMeta would be to compare
organ-isms by considering their whole metabolic networks, thus identifying T-invariants corresponding to functional subunits in the entire metabolism. However, the complexity of determining the Hilbert basis and the average size of metabolic networks makes the computational cost of this approach prohibitive. We will further comment on this possibility along the paper and in the concluding section.
The paper is organised as follows. In Section 2 we introduce metabolic path-ways and we provide a classification of various proposals for the comparison of metabolic pathways in the literature. In Section 3 we show how a PN can model a metabolic pathway and present our comparison technique. In Section 4 we briefly illustrate the toolCoMeta and we present some experiments. A short
conclusion follows in Section 5.
2
Comparison of Metabolic Pathways
In this section we briefly introduce metabolic pathways and classify various proposals for the comparison of metabolic pathways in the literature.
2.1 Metabolic Pathways
Biologists usually represent a metabolic pathway as a network of chemical re-actions, catalysed by one or moreenzymes, where some molecules (reactants or substrates) are transformed into others (products). Enzymes are not consumed in a reaction, even if they are necessary and used while the reaction takes place. The product of a reaction is the substrate for other ones.
To characterise a metabolic pathway, it is necessary to identify its components (namely the reactions, enzymes, reactants and products) and their relations. Quantitative relations can be represented through astoichiometric matrix, where rows represent molecular species and columns represent reactions. An element of the matrix, a stoichiometric coefficient nij, represents the degree to which
Information on metabolic pathways are collected in databases. In particular the KEGG PATHWAY database [2] (KEGG stands forKyoto Encyclopedia of Genes and Genomes) contains metabolic, regulatory and genetic pathways for different species whose data are derived by genome sequencing. It integrates genomic, chemical and systemic functional information [29]. The pathways are manually drawn, curated and continuously updated from published materials. They are represented as maps which are linked to additional information on re-actions, enzymes and genes, which may be stored in other databases. Metabolic pathways are generally well conserved among most organisms. In KEGG a ref-erence pathway is manually built as the union of the corresponding pathways in the various organisms. Then, from the reference pathway, it is possible to extract the specific pathway for each single organism. This provides a uniform view of the same pathway in different organisms, a fact that can be useful for comparison purposes. KEGG pathways are coded using KGML (KEGG Markup Language) [1], a language based on XML.
2.2 Comparison Techniques for Metabolic Pathways
Many proposals exist in the literature for comparing metabolic pathways and whole metabolic networks of different organisms. Each proposal is based on some simplified representation of a metabolic pathway and on a related definition of similarity score (or distance measure) between two pathways. Hence we can group the various approaches in three classes, according to the structures they use for representing and comparing metabolic pathways. Such structures are:
– Sets.Most of the proposals in the literature represent a metabolic pathway (or the entire metabolic network) as the set of its main components, which can be reactions, enzymes or chemical compounds (for some approaches in this class see, e.g., [20,21,35,27,17,16,13,59,40]). This representation is simple and efficient and very useful when entire metabolic networks are compared. The comparison is based on suitable set operations.
– Sequences. A metabolic pathway is sometimes represented as a set of se-quences of reactions (enzymes, compounds), i.e., pathways are decomposed into a set of selected paths leading from an initial component to a final one (see, e.g., [60,36,14,33,61]). This representation may provide more informa-tion on the original pathways, but it can be computainforma-tionally more expensive. It requires methods both for identifying a suitable set of paths and for com-paring them.
The similarity measure (or distance) and the comparison technique strictly de-pend on the chosen representation. When using a set-based representation, the comparison between two pathways roughly consists in determining the number of common elements. A similarity measure commonly used in this case is the Jacard index [28] defined as:
J(X, Y) = |X∩Y|
|X∪Y|
whereXandY are the two sets to be compared. When pathways are represented by means of sequences, alignment techniques and sum of scores with gap penalty may be used for measuring similarity. In the case of graph representation, more complex algorithms forgraph homeomorphism or graph isomorphism are used and some approximations are introduced to reduce the computational costs.
In any case the definition of a similarity measure between two metabolic pathways relies on a similarity measure between their components. Reactions are generally identified with the enzymes which catalyse them, and the most used similarity measures between two reactions/enzymes are based on:
– Identity. The simplest similarity measure is just a boolean value: two enzymes can either be identical (similarity = 1) or different (similarity = 0).
– EC hierarchy. The similarity measure is based on comparing the uniqueEC number (Enzyme Commission number) associated with each enzyme, which represents its catalytic activity.
The EC number is a 4-level hierarchical scheme,d1.d2.d3.d4, developed by
the International Union of Biochemistry and Molecular Biology (IUBMB) [62]. For instance,arginase is numbered by EC:3.5.3.1, which indicates that the enzyme is a hydrolase (EC:3.∗.∗.∗), and acts on the “carbon nitrogen bonds, other than peptide bonds” (sub-class EC:3.5.∗.∗) in linear amidines (sub-sub-class EC:3.5.3.∗). Enzymes with similar EC classifications are functional ho-mologues, but do not necessarily have similar amino acid sequences.
Given two enzymese=d1.d2.d3.d4 ande′=d′1.d′2.d′3.d′4, their similarity
S(e, e′) depends on the length of the common prefix of their EC numbers:
S(e, e′) = max{i:d1.d2. . . di=d′1.d′2. . . . d′i}/4
For instance, the similarity between arginase (e = 3.5.3.1) and creatinase (e′= 3.5.3.3) is 0.75.
– Information content. The similarity measure is based on the EC numbers of enzymes together with the information content of the numbering scheme. This is intended to correct the large deviation in the distribution in the enzyme hierarchy. For example, the enzymes in the class 1.1.1 range from EC:1.1.1.1 to EC:1.1.1.254, whereas there is a single enzyme in the class 5.3.4. Given an enzyme class h, its information content can be defined as I(h) =−log2C(h),where C(h) denotes the number of enzymes inh(hence
large classes have a low information content). The similarity between two enzymesei andej is thenI(hij), wherehij is their smallest common upper
– Sequence alignment. The similarity measure is obtained by aligning the genes or the proteins corresponding to the two enzymes and by considering the resulting alignment score.
3
Behavioural Aspects in Metabolic Pathways
Comparison
In this section we briefly discuss how to represent a metabolic pathway as a PN. Then we define a similarity measure between two metabolic pathways modelled as PNs, which takes into account the behaviour of the pathways by comparing their minimal T-invariants. Such measure is combined with a simpler one which considers homology of reactions.
3.1 Metabolic Pathways as Petri Nets
PNs are a well known formalism originally introduced in computer science for modelling discrete concurrent systems. PNs have a sound theory and many ap-plications both in computer science and in real life systems (see [38] and [18] for surveys on PNs and their properties). A large number of tools have been developed for analysing properties of PNs. A quite comprehensive list can be found at thePetri Nets World site [4].
In some seminal papers Reddy et al. [45,43,44] and Hofest¨adt [26] proposed PNs for representing and analysing metabolic pathways. Since then, a wide range of literature has grown on the topic [10]. The structural representation of a metabolic pathway by means of a PN can be obtained by exploiting the natural correspondence between PNs and biochemical networks. In fact places are associated with molecular species, such as metabolites, proteins or enzymes; transitions correspond to chemical reactions; input places represent the substrate or reactants; output places represent reaction products. The incidence matrix of the PN is identical to the stoichiometric matrix of the system of chemical re-actions. The number of tokens in each place indicates the amount of substance associated with that place. Quantitative data can be added to refine the rep-resentation of the behaviour of the pathway. In particular, extended PNs may have an associated transition rate which depends on the kinetic law of the cor-responding reaction. Large and complex networks can be greatly simplified by avoiding an explicit representation of enzymes and by assuming that ubiquitous substances are in a constant amount. In this way, however, processes involving these substances, such as the energy balance, are not modelled.
a steady state. Therefore the presence of T-invariants in a metabolic pathway is biologically of great interest as it can reveal the presence of steady states, in which concentrations of substances have reached a possibly dynamic equilibrium. Although space limitations prevent us from a formal presentation of nets and invariants, it is useful to recall that the set of (semi-positive) T-invariants can be characterised finitely, by resorting to its Hilbert basis [48].
Remark 1. Unique basis The set of T-invariants of a (finite) PN N admits a unique basis which is given by the collectionB(N) of minimal T-invariants.
The above means that any T-invariant can be obtained as a linear combination (with positive in teger coefficient) of minimal T-invariants. Uniqueness of the basisB(N) allows us to take it as a characteristic feature of the net.
In a PN model of a metabolic pathway, a minimal T-invariant corresponds to an elementary flux mode, a term introduced in [51] to refer to a minimal set of reactions that can operate at a steady state. It can be interpreted as a minimal self-sufficient subsystem which is associated with a function. By assuming both the fluxes and the pool sizes constants the stoichiometry of the network restricts the space of all possible net fluxes to a rather small linear subspace. Such sub-space can be analysed in order to capture possible behaviours of the pathway and its functional subunits [46,47,49,50,51,52]. Minimal T-invariants have been used in Systems Biology as a fundamental tool in model validation techniques (see, e.g., [24,31]), moreover some analysis and decomposition techniques based on T-invariants have been proposed (see, e.g., [23,22]). In this paper we propose to use minimal T-invariants for metabolic pathways comparison.
The PNs corresponding to the metabolic pathways of an organism are subnets of a larger net representing its full metabolic network. The minimal T-invariants of these subnets have a clear relation with the (minimal) T-invariants of the full network. It can be easily seen that, considering the pathway as an isolated sub-system guarantees correctness: minimal T-invariant of the pathway are minimal T-invariant of the full network. If, instead, a pathway is considered as an inter-active subsystem (i.e., its input/output metabolites are taken as open places, where the environment can freely put/remove substances) then completeness is guaranteed: any invariant of the full network, once projected onto the pathway, is an invariant of the open pathway. The converse does not hold, i.e., there can be invariants of the open pathway which do not correspond to invariants of the full network. Hence, in the open approach, we may loose correctness, but, still, as shown in [41], minimal T-invariants of the full network can be obtained compositionally from those of the subnetworks.
3.2 A Combined Similarity Measure between Pathways
Metabolic pathways are complex networks of biochemical reactions describing fluxes of substances. Such fluxes arise as the composition of elementary fluxes, i.e., cyclic fluxes which cannot be further decomposed. Most of the techniques briefly discussed in Section 2 compare pathways on the basis of homology of their reactions, that is they determine a point to point functional correspondence. Some proposals consider the topology of the network, but still most techniques are eminently static and ignore the flow of metabolites in the pathway.
Here we propose a comparison between metabolic pathways based on the com-bination of two similarity scores derived from their PN representations. More precisely, we consider a “static” score,R score(reaction score), taking into ac-count the homology of reactions occurring in the pathways and a “behavioural” score,I score(invariant score), taking into account the dynamics of the pathway as expressed by the T-invariants.
Both R score and I score are based on a similarity index. We propose to use either the Sørensen index [56] or the Tanimoto index [58], in both cases extended to multisets. LetX1andX2be multisets and∩and| · |be intersection
and cardinality generalised to multisets1, then
– theSørensen index is given by
S index(X1, X2) =
2|X1∩X2| |X1|+|X2|
– theTanimoto index (extended Jacard index)is given by
T index(X1, X2) =
|X1∩X2| |X1|+|X2| − |X1∩X2|
Given two pathways represented by the PNsP1andP2, theR scoreis computed
by comparing their reactions. Each reaction is actually represented by the EC numbers of the associated enzymes. More precisely, if X1 and X2 denotes the
multisets of the EC numbers of the reactions inP1 andP2, respectively, we can
define theR scoreeither as
R score(X1, X2) =S index(X1, X2)
if we select the Sørensen index or as
R score(X1, X2) =T index(X1, X2)
if we select the Tanimoto index. We adopt a multiset representation since an EC number may occur more than once in a pathway. The Tanimoto index was
1 Formally, a multiset is a pair (X, m
X) where X is the underlying set and mX :
X →N+ is themultiplicity function, associating to each x∈X a positive natural number indicating the number of its occurrences. Then|(X, mX)|=z
used, for example, in [59], it fits multisets and it is normalised. The Sørensen index, instead, was not used previously in the literature for pathway comparison. Intuitively it captures what two multisets have in common and it is normalised. In the experiments none of the indexes proved to be definitively better than the other. Hence both indexes are currently offered inCoMeta, which leaves the
choice to the user.
Presently the similarity considered between enzymes is the identity, but finer similarity measures between enzymes, such as the one determined by the EC hierarchy, could be easily accommodated in this setting.
The distance based on reactions, or R-distance, is then defined as follows
dR(P1, P2) = 1−R score(X1, X2).
The behavioural component of the similarity is obtained by comparing the Hilbert bases of minimal T-invariants of the net representations, seen either as isolated or open subnets of the full metabolic network. Each invariant is repre-sented by a multiset of EC numbers, corresponding to the reactions occurring in the invariant, and the similarity between two invariants is given, as before, by a similarity index, either theS indexor theT index. Note that when T-invariants are sets of transitions (rather than proper multisets) they can be seen as subnets of the net at hand, and the similarity between two T-invariants coincides with theR score of the corresponding subnets.
A heuristic match between the two basesB(P1) andB(P2) is performed and
the similarity values corresponding to the indexes of the matching pairs are accumulated intoI Score(P1, P2) by the algorithm described in Fig. 1.
Again, the similarity between pathways based on minimal T-invariants induces a distance, the I-distance:
dI(P1, P2) = 1−I score(P1, P2)
The two distances are combined by taking a weighted sum, as shown below, whereα∈[0,1]:
dD(P1, P2) =α dR(P1, P2) + (1−α)dI(P1, P2)
The parameterαallows the analyst to move the focus between homology of reac-tions and similarity of functional components as represented by the T-invariants. Two organismsO1andO2can be compared by consideringnmetabolic
path-ways P1, . . . , Pn. In this case the distances between the two organisms with
respect to the various metabolic pathwaysPj, j ∈[1, n], need to be combined.
The simplest solution consists in taking the average distance:
dD(O1, O2) =
n
j=1dD(Pj1, Pj2)
n
When a pathwayPjoccurs in one of the two organisms but not in the other, the
corresponding pathway distancedD(Pj1, Pj2) in the formula above is assumed to
functionI Score(P1, P2);
input: two metabolic pathwaysP1andP2;
output: the similarity measure betweenB(P1) andB(P2); begin
I1=B(P1);I2=B(P2); score= 0;
card= max{|I1|,|I2|}; while(I1=∅ ∧ I2=∅)do begin
(X1, X2) =Find max Sim(I1, I2); {Returns a pair of T-invariants, (X1, X2), inI1×I2 such thatIndex(X1,X2) is maximum,
whereIndex(X1,X2) is the Sørensen or the Tanimoto index} score=score+Index(X1, X2);
I1=I1− {X1};
I2=I2− {X2}; end;
score=score/card; returnscore endI Score;
Fig. 1.Comparing bases of T-invariants
4
Experimenting with CoMeta
In this section we briefly illustrate the prototype tool CoMeta (Comparing Metabolic pathways) which implements our proposal, and we report on some
experiments.
4.1 CoMeta
CoMeta is a user-friendly tool written in Java and running under Linux and
Mac. It uses an external tool for computing the Hilbert basis called 4ti2 [6], a software package for algebraic, geometric and combinatorial problems on linear spaces2.
CoMetaoffers a set of integrated functionalities. We describe them with the
help of the graphical user interface, pictured in Figure 2. Looking at the main window in Figure 2(a), we can distinguish an upper part, which allows for the selection of the desired KEGG organisms and pathways from the complete lists on top of the window, and a lower part where a tabbed panel indicates the various commands which can be performed. The first tab of the tabbed panel is shown in the main window, while the others are in Figure 2(b), 2(c), and 2(d), respectively.
The main functionalities of the tool are the following:
2 A previous version of the tool uses INA (Integrated Tool Analyser) [57] as external
– Select organisms and pathways:CoMetaproposes the lists of KEGG
organ-isms and pathways (see the two lists on top of the main window, Figure 2(a)) and allows the user to select the ones to be compared by double-clicking them. In Figure 2(a) six organisms and one pathway have been selected. Such lists can be saved and then recovered for further processing by using the “File” menu.
– Retrieve KEGG information: by clicking on the “Download KEGG files” button in the first tab of the tabbed panel shown in Figure 2(a),CoMeta
downloads the information for the selected organisms and pathways from the KEGG database.
– Translate into PNs:by clicking the “Translate KEGG files into PNs” button in the second tab of the tabbed panel shown in Figure 2(b),CoMeta
trans-lates the selected organisms and pathways into corresponding PNs. Only pathways which are networks of biochemical reactions can be translated. The user can choose between a translation producing isolated or open net-works. For this purpose,CoMetaresorts to the toolMPath2PN[11] which
have been developed for transforming a metabolic pathway, expressed in one of the various existing DB formats, into a corresponding PN, expressed in one of the various PNs formats. In this case the translation is from KGML to PNML [3], a standard format for PNs tools. We refer to [11] for the detailed explanation of the translation. The resulting PNML files are available for further processing. Besides,CoMeta produces a text file representing the
stoichiometric matrix of the net, which is the input of 4ti2.
– Compute Distances: by using the third tab of the tabbed panel shown in Figure 2(c), the R-distance and the I-distance as defined in Section 3.2 are computed. The user can select either the Sørensen or the Tanimoto index. CoMeta uses the tool 4ti2 to compute the bases of semi-positive
T-invariants of the PN representations of the pathways.CoMetaallows the
user to inspect the details of the comparison between any pair of organisms (T-invariants bases, invariants matches, reactions and invariants scores, etc.) by clicking on the “Show details” button.
– Compute the combined distance:by using the fourth tab of the tabbed panel shown in Figure 2(d), the user can specify the parameterα for computing the combined distance. By clicking on the “Export matrices” button, the R-distance, I-distance and the combined distance matrices can be exported as text files to be inspected and for further analyses. By clicking the “Show tree(s)” button CoMeta builds and visualises a phylogenetic tree
corre-sponding to the chosen combined distance. Currently CoMeta offers the
UPGMA [55,53] and Neighbour Joining [39,53] methods3.
3 UPGMA (Unweighted Pair Group Method with Arithmetic Mean) is a hierarchical
(a)CoMeta main window
(b) Second tab: Generate PNs
(c) Third tab: Compute Distances
(d) Fourth tab: Combined Distance
4.2 Experiments
The comparison of metabolic pathways can be useful for studying some specific metabolic functions in a group of selected organisms. In this case the compari-son will be conducted on a single or few metabolic pathways. Alternatively, in the literature metabolic pathways comparison has been applied to phylogenetic inference (see e.g. [20,21,25,27,16,13,19,32]). For this purpose it could be appro-priate to compare all metabolic pathways (or, as mentioned in the introduction, the whole metabolic network) of the selected organisms. However, also in this context, it can be interesting to focus on the evolution of one or few relevant metabolic functions.
In order to validate our proposal we conducted various experiments with
CoMeta, some of which are briefly reported below. First, with the aim of
in-vestigating the relationships between the R-distance and the I-distance and of getting insights on the more appropriate values for the parameterα, we studied extensively the distributions of the R-distance and I-distance on the organisms stored in KEGG with respect to a single well documented pathway, the Glycol-ysis. Then we used our distances for classifying theGlycolysis of heterogeneous groups of bacteria and archaea. A further set of experiments, some of which were presented in [12], consisted in building phylogenetic trees for groups of organ-isms on the basis of some selected pathways. This allows for some comparison with analogous work in the literature. The first set of experiments is conducted considering both the isolated and the open variants of the pathways. The second and third experiments focus on the isolated approach which, in our experience, produces better results.
Exploring KEGG Pathways with CoMeta. In this first set of experiments
we explored the metabolic pathways of the organisms stored in KEGG with
CoMeta, in order to analyse the significance of the proposed distancesdR and
dI and their relationship in both the open and isolated approaches. We
consid-ered different pathways and different classes of organisms4. For each class we studied the distribution of the values of the proposed distances for all the pairs of different organisms in the class. For brevity we report here only some results regarding theGlycolysis pathway and the Sørensen index.
Each row in Figure 3 corresponds to a class of organisms and shows the his-tograms for the I-distance (open and isolated approaches) and the R-distance. The continuous lines represent estimates of the density of the considered dis-tances. Graphics with the same dimensions have been used for the same row, this makes it easier to compare histograms of the proposed distances for the same group of organisms.
4 A class is a taxonomic group consisting of organisms that share some common
The first row corresponds to experiments conducted on the class Archaea. The histograms show that the I-distance in the isolated approach and the R-distance behave in a rather similar way and that both their densities are mostly concentrated in [0,0.3].Instead, in the open approach the I-distance has a quite different distribution, ranging over the whole interval [0,1]. This suggests that, within the class of the Archaea, the Glycolysis pathway greatly differs on the potential fluxes involving the boundaries.
The second row corresponds to experiments conducted on the class Eukary-otes. The histograms show that the I-distance and the R-distance exhibit dif-ferent distributions. In fact, the I-distance, in both variants, shows a rather flat distribution ranging from 0 to 1 for the open approach and from 0 to 0.8 for the isolated approach, while the R-distance takes values only in the interval [0,0.6], with a unimodal distribution, mostly concentrated in [0.05,0.25]. This suggests that, within the class of theEukaryotesand with respect to theGlycolysis path-way, the I-distance, in both variants, discriminates more than the R-distance, for which most organisms are very similar.
Further experiments (rows three to five) focus on refinements of the class of Eukaryoteswhich, in KEGG, is rather heterogeneous. It contains 180 organisms organised in various subclasses. More precisely, the histograms in rows from three to five of Figure 3, represent respectively the subclasses Animals, Vertebrates andMammals, each included in the previous one. Let us focus on the subclass Animals, which in KEGG contains 59 still very heterogeneous organisms. The R-distance has a narrower range varying from 0 to 0.3, while I-distance ranges in the larger intervals [0,1] for the open approach and [0,0.75] for the isolated one. TheVertebrates in KEGG are a rather homogeneous subclass of the Animals, consisting of 26 organisms. The range of the distances remarkably decreases, meaning that our distances view theVertebratesas an homogeneous class within theAnimals, with respect to the Glycolysis pathway. The R-distance considers most of theVertebrates as equal (0 distance), while the I-distance, in particular in the open approach, is still able to discriminate between some of them. The Mammalsstored in KEGG form a homogeneous subclass of 17 organisms among theVertebrates and this is confirmed by the distribution of the distances which are mostly concentrated around 0.
This exploration seems to confirm that both the R-distance and the I-distance are meaningful and that, in some cases, the I-distance (especially in the open approach), is able to discriminate more than the R-distance.
Classifying Heterogeneous Organisms with Respect to Glycolysis. We
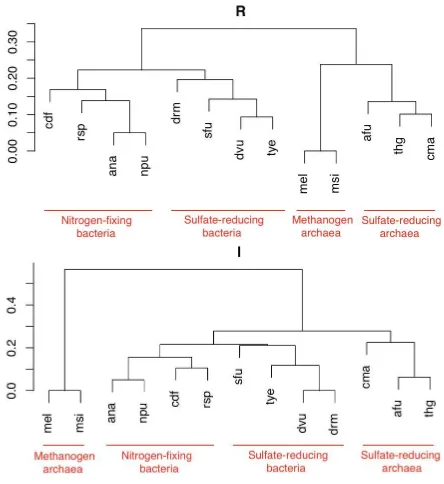
Fig. 4. Top: Clustering based on the R-distance. Bottom: Clustering based on the I-distance.
reducens(drm),Anabaena sp. PCC7120 (ana),Nostoc punctiforme(npu), Ther-modesulfovibrio yellowstonii (tye), Methanobrevibacter smithii ATCC 35061 (msi),Methanobacterium sp. AL-21 (mel), Archaeoglobus fulgidus (afu), Ther-mogladius sp. 1633 (thg),Caldivirga maquilingensis (cma).
They may be classified as nitrogen-fixing bacteria (ana, npu, cdf and rsp), methanogen archaea (msi and mel), sulfate-reducing bacteria (dvu, sfu, drm and tye) and sulfate-reducing archaea (afu, cma and thg).
We apply the UPGMA method for producing the classification. The results obtained by the R-distance and by the I-distance are reported in Figure 4. By choosing either the Sørensen index or the Tanimoto index we get the same clas-sifications. Both the distances classify well these organisms with respect to the Glycolysis. In fact, in both cases the classification perfectly distinguishes sulfate-reducing organisms from nitrogen-fixing and from methanogen ones. Note that the R-distance distinguishes first the two reigns, namelyBacteria andArchaea, and then, within them, the specific function. Differently, the I-distance considers the sulfate-reducing archaea closer to the sulfate-reducing bacteria (distance less than 0.3), i.e. it better recognises that the two groups share a common function.
Phylogenetic Reconstruction. This experiment considers a set of 16
Cod. Organism Reign afu A. fulgidus Archaea mja M. jannaschii Archaea cpn C. pneumoniae Bacteria mge M. genitalum Bacteria mpn M. pneumoniae Bacteria hin H. influenzae Bacteria syn Synechocystis Bacteria dra D. radiodurans Bacteria mtu M. tuberculosis Bacteria tpa T. pallidum Bacteria bsu B. subtilis Bacteria aae A. aeolicus Bacteria tma T. maritima Bacteria eco E. coli Bacteria hpy H. pylori Bacteria
sce Saccharomyces cerevisiae Eucaryotes
Fig. 5.Left: organisms for experiment 3. Right: reference NCBI taxonomy.
Glycolysis pathways. This experiment has been originally reported in [25] as a test case and then it has been considered in [13]. The organisms and their reference NCBI taxonomy [5] are show in Figure 5.
Focusing on an experiment already studied in the literature may help in com-paring our technique with other proposals, although, as clarified below, a pre-cise comparison is quite difficult for the variability of data sources and reference classifications.
We consider the Sørensen index, the value of αranges in [0,1], phylogenetic trees are built using the UPGMA method and they are compared with the reference NCBI classification of the 16 organisms. Following [25,13], in order to perform such a comparison we use the cousins tool [64,54] with threshold 2. The tool compares unordered trees with labelled leaves by counting the sets of common cousin pairs up to a certain cousin distance5. The outcome is reported
in the table in Figure 6 (left). Our best result, 0.3131313, corresponds to the phylogenetic tree in Figure 6 (right) and to our combined distance with α ∈
[0.45,0.63]. The same best result is obtained using the Tanimoto index, forα∈
[0.40,0.59].
Our results cannot be immediately compared with those in [25,13]. In fact, the reference NCBI classification of the 16 organisms and the corresponding KEGG data have been changing in the meantime. Nevertheless, the experiment suggests
5 Acousin pair is a triple consisting of a pair of leaves and their cousin distance: 0 if
α Similarity value 0.00 0.27 0.39 - 0.44 0.2828283 0.45 - 0.63 0.3131313 0.64 - 0.65 0.3092784 0.66 - 0.75 0.2673267 1.00 0.2427184
Fig. 6.Results for experiment 3. Left: similarity values of our phylogenetic trees with respect to the reference NCBI taxonomy computed withcousins. Right: UPGMA phy-logenetic tree inferred from theGlycolysis pathway forα∈[0.45,0.63].
that our technique produces results which are at least comparable with those in [25,13].
In [25] a pathway is represented as anenzyme graph and a distance is defined which takes into account both the structure of the graph and the similarity between corresponding nodes. A phylogenetic tree is built with the resulting distance matrix by using the Neighbour Joining method. The authors consider the 16 organisms wrt theGlycolysis pathway and cousins provides a similarity value of 0.26 between their phylogenetic tree and the reference NCBI taxonomy (this outperforms the results of the phylogenies obtained by NCE, 16SrRNA and [35]). As shown in Figure 6 our results improve those in [25]. Although space limitations prevent us to report the details here, this holds when we use Neighbour Joining trees too.
In [13] a heuristic comparison algorithm is proposed which computes the in-tersection and symmetric difference of the sets of compounds, enzymes, and re-actions in the metabolic pathways of different organisms. Their similarity matrix is supplied to a fuzzy equivalence relations-based (FER) hierarchical clustering method to compute the classification tree. The authors say that they were not able to recompute the same results obtained by [25] on the experiment of the 16 organisms. In thecousins comparison with respect to the reference NCBI tax-onomy their best result has a similarity value of 0.3195876, which is very close to our best result.
5
Conclusions
Biological questions related to evolution and to differences among organisms can be answered by comparing their metabolic pathways. In this paper we propose a new similarity measure for metabolic pathways which combines a similarity based on reactions and a similarity based on behavioural aspects as captured by minimal T-invariants of the PN representation of a pathway seen either as an isolated or an open subsystem.
We implemented a tool,CoMeta, to experiment with our proposal. It is not
available and the information in the databases are continuously updated. Nev-ertheless experiments made withCoMetashow that:
– Our combined measure produces meaningful classifications.
– Neither the comparison based on reactions nor the one based on T-invariants is always preferable. The refinement due to the introduction of the be-havioural measure can be useful, but further investigations are necessary to determine how to combine properly the two measures.
– Measures based on more sophisticated representations of a pathway (e.g., using graphs rather than sets, or considering compounds besides enzymes) do not necessarily give better results than our combined measure, as our last experiment shows.
The above considerations apply to the comparison of the pathways seen as iso-lated subsystems of the full metabolic network and, indeed, the experiments mainly focus on this approach. Results obtained when representing the path-ways as open, interactive, subsystems are less satisfactory. We believe this may be due to our completely automatised approach, which considers all metabolites which are only consumed or only produced by a pathway and all metabolites linking the pathway to the rest of the network as input/output places of the sub-net. This is probably too rough and needs to be refined. In addition, it must be remarked that KEGG indicates the connections among pathways in a very ab-stract way and these information are not sufficiently precise and complete to be safely used for building the open subnet. We are currently extendingCoMeta
to grant to the user the possibility of choosing, among the metabolites in the border of the pathway, those which should be considered as input/output places. Such a choice can be guided by making explicit which metabolites are sources, which are sinks and which are indicated by KEGG as links between pathways.
We are considering also other improvements for CoMeta. We would like to give the possibility of a more general clustering of organisms based on the com-bined distance. We also plan to add more refined reactions/enzymes similarity measures based, e.g., on the hierarchical similarity of EC numbers. Moreover, al-though the simple greedy algorithm for matching invariants bases in theI Score
computation seems to provide good results at a very low computational cost, we plan to investigate possible refinements improving the quality of the match, while keeping a reasonable efficiency. A further extension could be to introduce the possibility to associate weights to the pathways when considering sets of path-ways in the comparison. Weights could be decided by the user for putting more emphasis on some pathways of interest, or they could be derived on the basis of characteristics of the pathways, like their size.
Another interesting direction of development forCoMetawould be the
with the average size of metabolic networks (more than 1000 compounds and 1500 reactions) suggests that the computation is unfeasible in practice and this was confirmed by our experiments.
Different solutions for guaranteeing the scalability of the approach can be explored:
– incrementality: Instead of comparing the full metabolic network, it could be interesting to compare smaller networks obtaining by merging, in an in-cremental fashion, a number of metabolic pathways of interest. This would allow to control the complexity growth. A difficulty consists in obtaining from KEGG precise information on how different pathways should be joined and in identifying possible overlaps.
– network simplification: Techniques for detecting portions of the network which are not active under some specific context conditions could be devised. This would allow to crop the network and to eliminate some potential fluxes. Clearly this requires some knowledge of quantitative information, which is not supplied by KEGG.
CoMeta is part of a larger project to integrate various tools for representing
and analysing metabolic pathways through PNs.CoMetais freely available at:
http://www.dsi.unive.it/∼biolab.
Acknowledgements. We are grateful to Paolo Besenzon, Silvio Alaimo and
Alessandro Roncato for their contribution to the implementation of CoMeta.
We are indebted to the anonymous reviewers for their comments on the paper.
References
1. Kegg Markup Language manual,http://www.genome.ad.jp/kegg/docs/xml 2. KEGG pathway database - Kyoto University Bioinformatics Centre,
http://www.genome.jp/kegg/pathway.html 3. Petri Net Markup Language, http://www.pnml.org
4. Petri net tools, http://www.informatik.uni-hamburg.de/TGI/PetriNets/tools 5. Taxonomy - site guide - NCBI,http://www.ncbi.nlm.nih.gov/guide/taxonomy/ 6. 4ti2 team. 4ti2—a software package for algebraic, geometric and combinatorial
problems on linear spaces,http://www.4ti2.de
7. Ay, F., Dang, M., Kahveci, T.: Metabolic network alignment in large scale by network compression. BMC Bioinformatics 13(suppl. 3) (2012)
8. Ay, F., Kahveci, T., de Crecy-Lagard, V.: Consistent alignment of metabolic path-ways without abstraction. In: Int. Conf. on Computational Systems Bioinformatics (CSB), pp. 237–248 (2008)
9. Ay, F., Kellis, M., Kahveci, T.: SubMAP: Aligning metabolic pathways with sub-network mappings. Journal of Computational Biology 18(3), 219–235 (2011) 10. Baldan, P., Cocco, N., Marin, A.: M Simeoni. Petri nets for modelling metabolic
pathways: a survey. Natural Computing 9(4), 955–989 (2010)
12. Baldan, P., Cocco, N., Simeoni, M.: Comparison of metabolic pathways by con-sidering potential fluxes. In: Heiner, M., Hofest¨adt, R. (eds.) BioPPN2012 - 3rd International Workshop on Biological Processes and Petri Nets, Satellite Event of Petri Nets 2012, Hamburg, Germany, June 25. CEUR Workshop Proceedings, vol. 852, pp. 2–17. ceur-ws.org (2012),http://ceur-ws.org/Vol-852
13. Casasnovas, J., Clemente, J.C., Mir´o-Juli`a, J., Rossell´o, F., Satou, K., Valiente, G.: Fuzzy clustering improves phylogenetic relationships reconstruction from metabolic pathways. In: Proc. of the 11th Int. Conf. on Information Processing and Manage-ment of Uncertainty in Knowledge-Based Systems (2006)
14. Chen, M., Hofestadt, R.: Web-based information retrieval system for the prediction of metabolic pathways. IEEE Trans. on NanoBioscience 3(3), 192–199 (2004) 15. Cheng, Q., Harrison, R., Zelikovsky, A.: MetNetAligner: a web service tool for
metabolic network alignments. Bioinformatics 25(15), 1989–1990 (2009)
16. Clemente, J., Satou, K., Valiente, G.: Reconstruction of phylogenetic relationships from metabolic pathways based on the enzyme hierarchy and the gene ontology. Genome Informatics 16(2), 45–55 (2005)
17. Ebenh¨oh, O., Handorf, T., Heinrich, R.: A cross species comparison of metabolic network functions. Genome Informatics 16(1), 203–213 (2005)
18. Esparza, J., Nielsen, M.: Decidability issues for Petri Nets - a survey. Journal Inform. Process. Cybernet. EIK 30(3), 143–160 (1994)
19. Forst, C.V., Flamm, C., Hofacker, I.L., Stadler, P.F.: Algebraic comparison of metabolic networks, phylogenetic inference, and metabolic innovation. BMC Bioin-formatics 7(1), 1–11 (2006)
20. Forst, C.V., Schulten, K.: Evolution of metabolism: a new method for the compar-ison of metabolic pathways using genomics information. Journal of Computational Biology 6(3/4), 343–360 (1999)
21. Forst, C.V., Schulten, K.: Phylogenetic analysis of metabolic pathways. Journal of Molecular Evolution 52(16), 471–489 (2001)
22. Grafahrend-Belau, E., Schreiber, F., Heiner, M., Sackmann, A., Junker, B.H., Grunwald, S., Speer, A., Winder, K., Koch, I.: Modularization of biochemical net-works based on classification of Petri net t-invariants. BMC Bioinformatics 9(1), 1–17 (2008)
23. Hardy, S., Robillard, P.N.: Petri net-based method for the analysis of the dynamics of signal propagation in signaling pathways. Bioinformatics 24(2), 209–217 (2008) 24. Heiner, M., Koch, I.: Petri net based model validation in systems biology. In: Cortadella, J., Reisig, W. (eds.) ICATPN 2004. LNCS, vol. 3099, pp. 216–237. Springer, Heidelberg (2004)
25. Heymans, M., Singh, A.M.: Deriving phylogenetic trees from the similarity analysis of metabolic pathways. Bioinformatics 19(1), i138–i146 (2003)
26. Hofest¨adt, R.: A Petri net application of metabolic processes. Journal of System Analysis, Modelling and Simulation 16, 113–122 (1994)
27. Hong, S.H., Kim, T.Y., Lee, S.Y.: Phylogenetic analysis based on genome-scale metabolic pathway reaction content. Applied Microbiology and Biotechnol-ogy 65(2), 203–210 (2004)
28. Jaccard, P.: Distribution de la flore alpine dans le bassin des Dranses et dans quelques r´egions voisines. Bulletin del la Soci´et´e Vaudoise des Sciences Na-turelles 37, 241–272 (1901)
30. Klau, G.W.: A new graph-based method for pairwise global network alignment. BMC Bioinformatics 10(suppl. 1), 1–9 (2009)
31. Koch, I., Heiner, M.: Petri nets. In: Junker, B.H., Schreiber, F. (eds.) Analysis of Biological Networks. Book Series in Bioinformatics, pp. 139–179. Wiley & Sons (2008)
32. Kuchaiev, O., Milenkovic, T., Memisevic, V., Hayes, W., Przulj, N.: Topological network alignment uncovers biological function and phylogeny. Journal of the Royal Society Interface 7(50), 1341–1354 (2010)
33. Li, Y., de Ridder, D., de Groot, M.J.L., Reinders, M.J.T.: Metabolic pathway alignment between species using a comprehensive and flexible similarity measure. BMC Systems Biology 2(1), 1–15 (2008)
34. Li, Z., Zhang, S., Wang, Y., Zhang, X.S., Chen, L.: Alignment of molecular net-works by integer quadratic programming. Bioinformatics 23(13), 1631–1639 (2007) 35. Liao, L., Kim, S., Tomb, J.F.: Genome comparisons based on profiles of metabolic pathways. In: Proc. of the 6th Int. Conf. on Knowledge-Based Intelligent Informa-tion and Engineering Systems (KES 2002), pp. 469–476 (2002)
36. Lo, E., Yamada, T., Tanaka, M., Hattori, M., Goto, S., Chang, C., Kanehisa, M.: A method for customized cross-species metabolic pathway comparison. In: Proc. of Genome Informatics 2004. GIW 2004 Poster Abstract: P068 (2004)
37. Mithani, A., Preston, G.M., Hein, J.: Rahnuma: Hypergraph based tool for metabolic pathway prediction and network comparison. Bioinformatics 25(14), 1831–1832 (2009)
38. Murata, T.: Petri Nets: Properties, Analysis, and Applications. Proceedings of IEEE 77(4), 541–580 (1989)
39. Saitou, N., Nei, M.: The neighbor-joining method: a new method for reconstructing phylogenetic trees. Molecular Biology and Evolution 4(4), 406–425 (1987) 40. Oehm, S., Gilbert, D., Tauch, A., Stoye, J., Goessmann, A.: Comparative Pathway
Analyzer - a web server for comparative analysis, clustering and visualization of metabolic networks in multiple organisms. Nucleic Acids Research 36, 433–437 (2008)
41. Pedersen, M.: Compositional definitions of minimal flows in petri nets. In: Heiner, M., Uhrmacher, A.M. (eds.) CMSB 2008. LNCS (LNBI), vol. 5307, pp. 288–307. Springer, Heidelberg (2008)
42. Pinter, R.Y., Rokhlenko, O., Yeger-Lotem, E., Ziv-Ukelson, M.: Alignment of metabolic pathways. Bioinformatics 21(16), 3401–3408 (2005)
43. Reddy, V.N.: Modeling Biological Pathways: A Discrete Event Systems Approach. Master’s thesis, The Universisty of Maryland, M.S. 94-4 (1994)
44. Reddy, V.N., Liebman, M.N., Mavrovouniotis, M.L.: Qualitative Analysis of Bio-chemical Reaction Systems. Computers in Biology and Medicine 26(1), 9–24 (1996) 45. Reddy, V.N., Mavrovouniotis, M.L., Liebman, M.N.: Petri net representations in metabolic pathways. In: ISMB93: First Int. Conf. on Intelligent Systems for Molec-ular Biology, pp. 328–336. AAAI press (1993)
46. Schilling, C.H., Letscherer, D., Palsson, B.O.: Theory for the systemic definition of metabolic pathways and their use in interpreting metabolic function from a pathway-oriented perspective. Journal of Theoretical Biology 203, 229–248 (2000) 47. Schilling, C.H., Schuster, S., Palsson, B.O., Heinrich, R.: Metabolic pathway anal-ysis: basic concepts and scientific applications in the post-genomic era. Biotechnol-ogy Progress 15(3), 296–303 (1999)
49. Schuster, S., Dandekar, T., Fell, D.A.: Detection of elementary flux modes in bio-chemical networks: a promising tool for pathway analysis and metabolic engineer-ing. Trends Biotechnology, 53–60 (March 1999)
50. Schuster, S., Fell, D.A., Dandekar, T.: A general definition of metabolic pathway useful for systematic organization and analysis of complex metabolic networks. Nature Biotechnology 18, 326–332 (2000)
51. Schuster, S., Hilgetag, C.: On elementary flux modes in biochemical reaction sys-tems at steady state. Journal of Biological Syssys-tems 2, 165–182 (1994)
52. Schuster, S., Pfeiffer, T., Moldenhauer, F., Koch, I., Dandekar, T.: Exploring the pathway structure of metabolism: decomposition into subnetworks and application to Mycoplasma pneumoniae. Bioinformatics 18(2), 351–361 (2002)
53. Sestoft, P.: Programs for biosequence analysis, http://www.itu.dk/people/sestoft/bsa.html
54. Shasha, D., Wang, J.T.L., Zhang, S.: Unordered tree mining with applications to phylogeny. In: 20th Int. Conf. on Data Engineering, pp. 708–719. IEEE Computer Society (2004)
55. Sokal, R., Michener, C.: A statistical method for evaluating systematic relation-ships. University of Kansas Science Bulletin 38, 1409–1438 (1958)
56. Sørensen, T.: A method of establishing groups of equal amplitude in plant sociol-ogy based on similarity of species and its application to analyses of the vegetation on danish commons. Biologiske Skrifter / Kongelige Danske Videnskabernes Sel-skabg 5(4), 1–34 (1948)
57. Starke, P.H., Roch, S.: The Integrated Net Analyzer. Humbolt University Berlin (1999),http://www.informatik.hu-berlin.de/starke/ina.html
58. Tanimoto, T.T.: Technical report, IBM Internal Report, (November 17, 1957) 59. Tohsato, Y.: A method for species comparison of metabolic networks using reaction
profile. IPSJ Digital Courier 2(0), 685–690 (2006)
60. Tohsato, Y., Matsuda, H., Hashimoto, A.: A multiple alignment algorithm for metabolic pathway analysis using enzyme hierarchy. In: Proc. Int. Conf. Intell. Syst. Mol. Biol., pp. 376–383 (2000)
61. Tohsato, Y., Nishimura, Y.: Metabolic pathway alignment based on similarity be-tween chemical structures. IPSJ Digital Courier 3, 736–745 (2007)
62. Webb, E.C