SOLID CRYSTALLINE SUPERIONICS:
TWO DECADES OF RESEARCH AT BATAN
A. K. Jahja, N. Effendi, S. Purnama, P. Purwanto, E. Kartini and A. Widowati† Centre for Technology of Nuclear Industry Materials (PTBIN)
National Nuclear Energy Agency (BATAN) PUSPIPTEK, Tangerang, Banten 15314 †
Centre for Technology of Nuclear, Materials and Radiometry (PTNBR) National Nuclear Energy Agency (BATAN), Bandung, Jawa Barat 40132
e-mail: ay_khan@yahoo.com
ABSTRACT
Two decades of research works on solid crystalline superionic conductors at BATAN are reviewed. Recent progress in superionic conductors is widely attributed to rigorous advancements in ionic transport theory in solid crystals, physics and chemistry of crystalline superionic conductors and technically to inventions and innovations in solid state batteries, superionic capacitors, sensors and a multitude of other devices. The present authors have over a period of two decades, carried out a variety of research involving superionic conductors, covering many aspects of scientific investigation such as structural study using neutron diffraction, impedance and conductivity measurements and secondary battery cell measurements. Excerpts from these various activities are described and presented in this paper,and the future of superionic materials research at BATAN is briefly stated.
Keywords: Solid Crystalline, Superionics, BATAN
INTRODUCTION
Ionic solids have been a subject of study of physics for a long past, ever since Faraday noted the remarkable ionic properties of Ag2S and PbF at 177 °C and 500 °C respectively back in 1834. The transport in such materials is partly or wholly governed by ions. Such materials having high ionic conductivity are called fast ionic conductors and have found wide application in solid state devices such as batteries, capacitors, timers, pacemakers, etc. The history of solid State Ionics began formally when Ag3SI was found as a room temperature high conductivity solid Ag+ ion conductor and was applied to the electrolyte for Ag/I2 batteries around 1960. Innovations of new technologies invariably depend on the developments of new materials which facilitate also new technical inventions and discoveries.
20
IMPEDANCE AND CONDUCTIVITY STUDIES
Ionic conductivity of Rb4Cu16I7.2Cl12.8
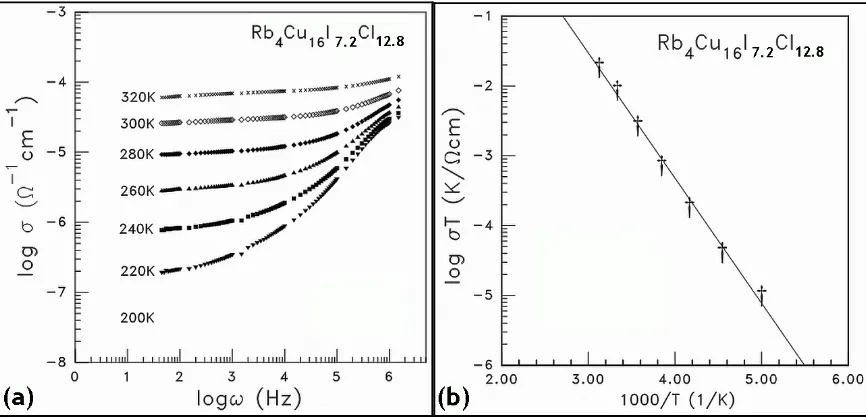
One of the technologically very important electrolyte materials for all solid state batteries is the Cu-based battery. This battery utilizes the Rb4Cu16I7.2Cl12.8 compound as solid electrolyte. The non-stoichiometric superionic conductor of Rb4Cu16I7.2Cl12.8, first synthesized by Takahashi et al [1]. The electrical and dielectric properties of Rb4Cu16I7.2Cl12.8 have been studied [2,3]. Experimental alternating current conductivity data measured at seven different temperatures, in the range between 200 and 320 K, show a higher frequency dispersion of conductivity caused by the effects of polarization on the electrode. The values of direct current conductivity, (0), are estimated from the graph in Figure 1(a), and then plotted using the Arrhenius format (0) vs. 1000 / T and presented in Figure 1(b).
Figure 1: (a). AC conductivity curve of Rb4Cu16I7.2Cl12.8 as a function of frequency and temperature. (b). Arrhenius plot of dc conductivity. The continuous line is the result of a least-squares analysis fitting to observed conductivity data. observations.
Copper-based ionic solids
Copper-based ionic solids, such as solid solutions, chemical compounds and composites have been a subject of study of physics for a long period of time [4,5,6,7].
CuS compound is one of the technologically very important electrolyte materials for all solid state batteries. CuS compounds have been used in metallic nano-wires, either formed in break-junctions or between a scanning tunnelling microscope tip and suitable substrates, and have been studied and used in molecular electronics and quantized conductance measurements. The conductivity of an ionic conductor is determined by the rate at which they are able to hop from site to site in the material. The a.c. conductivity () is found to vary with angular frequency as
( )
(0)
A
n (1)21 of materials that is related to the dynamics of hopping conduction. Almond et al have shown [10], that there is a simple relationship between (0) and A. From the theory of random walk, the d.c. conductivity (0) is related to the hopping rate p of ions as follows:
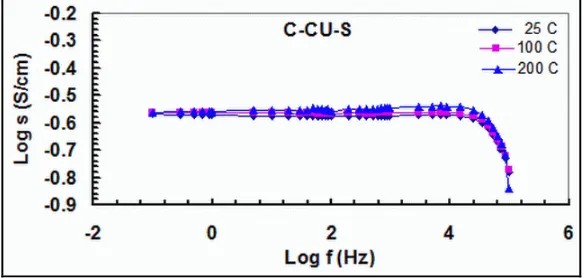
At BATAN composite sample CuS-C has been prepared and its conductivity data analyzed. The purpose of adding C to form the composite is in order to enhance the ionic conduction of the sample, since the presence of C may provide more pathways for the ionic conduction. CuS-C composite superionic conductor conductivity measured using the computerized RLC spectrometer located at the BKAN-PTBIN laboratory in the frequency range of 0.1 Hz – 0.1 MHz, at room temperature, 100 C and 200 C is shown in Figure 2.
Figure 2: Frequency dependent conductivity data for CuS-C composite at various temperatures.
The data is clearly divided into two segments, as shown in figure 2. For frequencies from 0.1 Hz to up to 9.0 kHz the curve is mainly flat and practically no frequency dispersion is observed, this is shown in figure 2 and the conductivity seems to converge to the steady-state value of 0.5708 (Scm-1). The experimental data for all temperatures shows a clear anomaly at frequencies of 9.0 kHz and higher, as shown in figure 2. The frequency dependent part clearly indicates the predominance of ionic hopping conduction mechanism at frequencies of 9.0 kHz and higher, and the ionic hopping rate p could then be calculated by
fitting the conductivity values to equation (1) and using equation (2).
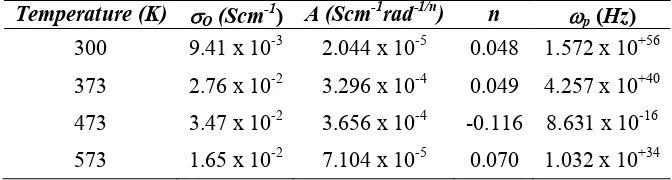
A.c. conductivity data at three temperatures were found to fit equations (1) and (2), providing the values of (0), A, n and p shown in table 1.
Table 1: Parameters obtained in fitting a.c. conductivity measurements of CuS-C composite to () = (0) + An.
Temperature (K) O (Scm-1) A (Scm-1rad-1/n) n p (Hz)
Room temperature 0.5708 0.847 0.0297 3,31 x 10⁷
100 0.5708 0.969 0.0414 7,22 x 10⁴
200 0.5708 1.0839 0.0518 3.52 x 10³
22
parameter n and ion hopping frequency p are also shown plotted as function of temperature
T in figure 3.
Figure 3: Plot of n (o) and ion hopping rates p (▲) versus temperature. The solid line is a guide to the eyes
The physical origin of this behaviour may be attributed to copper ion redistribution mechanism in the crystal lattice, as well as to conduction ions interaction in the samples. The results presented in this work seem to support the universal law of dielectric response in superionic conductors [9].
Alumina based superionic conductors
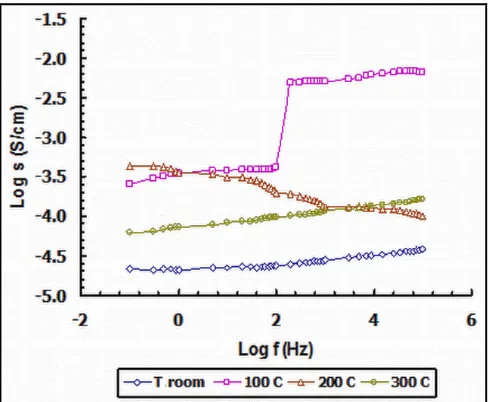
The physical properties of oxides-based and Li based superionics have been investigated extensively, because of their high ionic-conductivity and their potential as solid electrolytes in high-energy density batteries and fuel-cell [10]. Especially today, solid state electrochemical devices based on lithium and also magnesium have received much attention because of the low equivalent weight of these elements [11]. Results of a.c. conductivity measurements on Al2O3 with LiO and MgO prepared in composite morphology and isomorphic with conventional Na.Al2O3 are shown below in figure 4.
23 The data is clearly divided into four different behaviour for each temperature. The pattern for room temperature and 300 C shows an almost linear and increasing curve. The pattern for the 200 C curve consists of two distorted semicircles. The 100 C curve consists of two almost linear frequency dependent with a discontinuity at 100 Hz. This is understandable because since this is a composite, different component would show different frequency dependent conductivity behaviour at different temperatures. The frequency-independent conductivity ( at frequency 0) does not seem to converge to the same steady-state value, which means that the d.c. conductivity in this type of composite is temperature dependent.
The experimental data for all temperatures shows a clear anomaly at frequencies of 9.0 kHz and higher. For frequencies from 0.1 Hz to up to 9.0 kHz the curve is mainly flat and practically no frequency dispersion is observed, and the conductivity seems to converge to the steady-state value of 0.5708 (Scm-1).
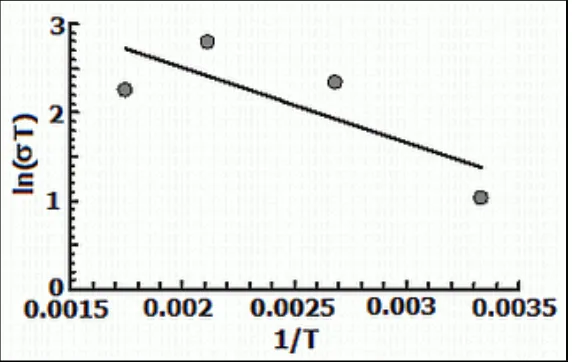
The values of d.c. conductivity, (0), as function of temperature are extrapolated from the frequency-dependent curves in figure 4 for the value of () when the angular frequency
approaches zero. The d.c. conductivity is then plotted in conventional Arrhenius format as ln((0)T) vs. 1/T in figure 5, where T is the absolute temperature. From the Arrhenius plot of the conductivity in figure 5, no smooth slope change or transition is observed. And the activation energy for conduction is found to be 0.021 eV.
Figure 5: Arrhenius plot of T vs. 1000/T at various frequencies.
AC conductivity data at four temperatures were fitted to equations (1), providing the values of (0), A, n and p shown in table 2. Conductivity dispersion at the higher
temperatures and higher frequencies is associated with electrode polarization effects
24
The strong temperature dependence of A and n values shown in table 2 indicates the predominance of hopping mechanism for ionic conduction in this sample [10]. The values of the exponential parameter n are also shown plotted as function of temperature T in figure 6. The values for ionic hopping frequencies p show a gross anomaly, which means that
equation (1) may not be valid for this type of materials. Also in another development research on other Li based compounds as cathode materials candidates have been started on compounds such as LiCoO2 and LiMnO4 [12].
Figure 6: Arrhenius plot of the d.c. conductivity
APPLICATIONS: SECONDARY BATTERY
Recycling Experiments of Secondary RbAg4I5 cell Battery with a C Cathode
Solid battery research activities can be divided into two parts: First the basic research that leads to the synthesis and study basic properties of pure materials, such as the structure and electrochemical properties. The second involves a complete battery cell systems research that leads to the possibility of fabrication of commercial batteries in the future. Synthesis and structural study is basically a problem that is quite clear (straightforward) and presents a relatively good solution, although completion of the problem itself is actually quite complicated. Conversely, for the type of the second study, a few difficulties or problems appear, such as those related to the interpretation of experimental electrochemical data for this type of secondary battery cell [12].
25 complete battery cells. A recycling trial is intended as part of an effort to optimize a system that had previously been known to function properly, or is specifically carried out with the intention of finding a new system. Cycling parameters should be selected in such a manner so that it can provide as much information as possible and are able to meet the expected requirements for a full-scale commercial battery. There are two kinds or types of recycling measurement (cycles). First is the galvanostatic recycling, and the second is the so called current-limited potentiostatic charge recycling. The second method was chosen because it is a better method. In this method the input current is deliberately kept below a certain maximum value, to avoid the problem of dendrite formation occurring at high current density [16]. Loss of capacity at the end of a charging cycle turns out to be far lower for the same values of charging time and galvanostatic current. The type of equipment used in this process is a controllable recycling unit. This instrument can be used for any combination pattern of a galvanostatic/ potentiostatic charging/ discharging cycle, while the electrostatic component could always be deactivated at certain preset time, charge and current.
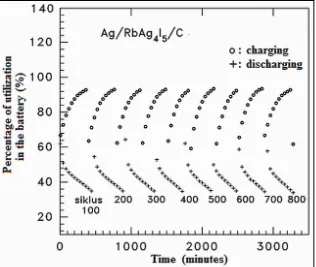
Figure 7: Utilization of discharging (+) and charging (o) cycle of a Ag/RbAg4I5/C composite cell for each 100, 200, 300,400,500,600,700 and 800 cycles.
The charging current is set to be 8 A and current discharge is determined to be 3 A and the upper limit voltage is set at 0.5 V. The open circuit voltage (OCV) parameter in this cell configuration has been measured, and an OCV of 0.163 V has been obtained.
Table 3.1. Technical characteristics and performance of secondary (Ag/RbAg4I5/ C) battery cell.
Electrolyte weight 1.996 gr.
Electrolyte thickness 2.00 cm.
Electrolyte diameter 1.74 cm.
discharge time (from 0,465 V to OCV) 5.5 minutes
26
In the discharge curve (Figure 7), the conversion efficiency of up to 800 cycles reached the figure of around 99.1% which indicates that the reversibility of secondary Ag/RbAg4I5/C battery cells can be considered as high. Furthermore, in the 800 cycle, besides a good reversibility, iodide corrosion degradation has not yet set in, as previously feared is going to be the case when the battery cell is stored away for a longer period of time [17].
Secondary Cu/Rb4Cu16I7.2Cl12.8/Cu2Se and Cu/Rb4Cu16I7.2Cl12.8/Cu1.75Se tryout battery cells.
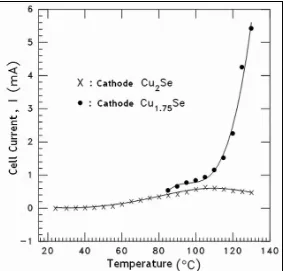
In the construction of a special cell type secondary battery anode / electrolyte / cathode, copper (Cu) is used as the anode materials, because the charge carrier in the electrolyte ion is Cu+. Preparation of cathode materials Cu1.75Se and Cu2Se has also been carried out separately. These three components are subsequently pressed together in pellet form, and then sealed in a pyrex cylinder. The average diameter size of the cathode and anode is 20 mm, with a 5.0 mm thickness. This composite is then characterized by measuring the polarization and the discharge profiles. In figure 8, the cell-current variation with temperature for two different cathodes stoichiometry, are presented. It appears that the non-stoichiometric cathode Cu1.75Se is superior in producing cell currents at higher temperatures; it also opens up opportunities for the use of the cell in the high temperature operation.
Figure 8: The curve of the cell current I versus temperature for different types of cathode stoichiometry.
27 a cell to be stored (in a state of non-operation) during a certain period of time and afterward the cell should loose only some 10 percent or less than ten percent of its initial OCV (open circuit voltage) during that period [16].
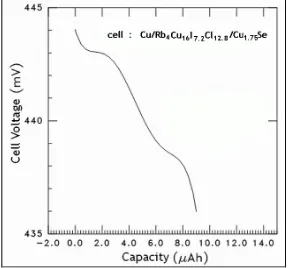
Figure 9: Dischargecurve of a tryout Cu/Rb4Cu16I7.2Cl12.8/Cu1.75Se secondary battery cell
The first drop in voltage is caused by ohmic polarization, and it gradually declines which is caused by discharge. Discharge capacity of the cells has been calculated for the expenditure of 315 A/cm2 from OCV to 0.436 V to be 9.0 Ah, smaller than the theoretical value of about 35 Ah [6]. It can be concluded that the stoichiometric electrode was influential in the performance of the cell, and that the Cu/Rb4Cu16I7.2Cl12.8/Cu1.75Se cell configuration can operate as a secondary battery with a discharge capacity for current expenditures of 315 A/cm2 from OCV to 0.436 V by 9.0 Ah in the first cycle and at room temperature [18].
STRUCTURAL STUDIES
Diffuse neutron scattering from disordered phase of Ag3SI
Neutron diffuse scattering from powder sample of disordered phase of Ag3SI were measured using a Triple Axis Spectrometer at 538 K. The first, second and third peaks of the diffuse scattering appear at Q 2.5, 4.8 and 6.7 Å-1, as shown in figure 10. Numerical analysis of the diffuse background was carried out assuming strong correlation between the thermal displacements of and short-range-disorder in Ag+ cations [19].
28
Figure 10: Observed neutron powder diffraction intensity (solid lines) and diffuse background intensity obtained (broken lines) for -Ag3SI at 538 K.
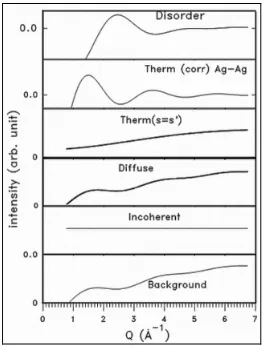
Figure 11: Calculated neutron diffuse scattering of -Ag3SI at 538 K. (IBackground: diffuse background,
Iincoherent : incoherent scattering intensity, IDiffuse : Diffuse scattering, ITherm(s=s) : s=s term in Eq. (3),
29 The calculated neutron diffuse scattering of -Ag3SI at 538 K is shown in figure 11. The contribution to the second oscillatory peak was from Ag-Ag thermal displacements correlation, while the origin of the third oscillatory peak is yet unclear. The positions of the first and second oscillatory peaks in the calculated result do not match the observed experimental positions. It is suggested that strong anion-anion and anion-cation thermal displacement correlation and short-range-disorder should be included in the theoretical treatment to obtain better match in the peak positions.
Neutron Diffuse scattering in disordered Rb4Cu16I7.2Cl12.8 Superionic Conductor
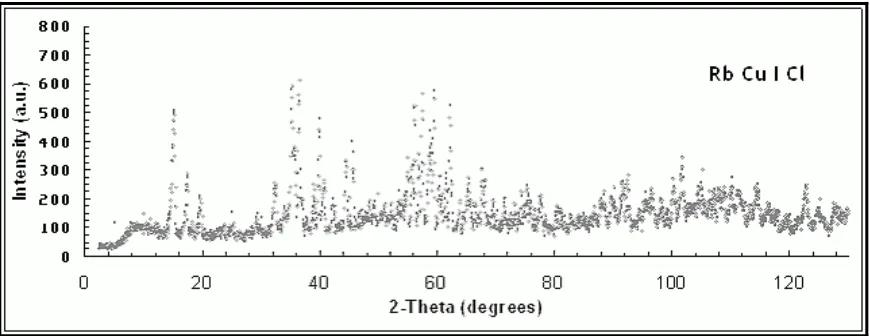
The appearance of a comparatively strong diffuse background in the neutron scattering intensity from both ordered phase due to the correlation effects between the thermal displacements of atoms and from disordered phase of Ag- and Cu-based superionic crystals due to the disordered arrangement of cations have been previously discussed by several authors [20]. The present authors carried out measurements of Rb4Cu16I7.2Cl12.8 neutron diffraction intensity at ambient temperature by a step-scan mode. The incident neutron wavelength of 1.822 Å was chosen. The 2 range covered was 0 - 160°, and the step-scan was 0.05°. In figure 12, neutron HRPD intensity of Rb4Cu16I7.2Cl12.8 superionic conductor is presented.
Figure 12: Observed neutron powder diffraction intensity for Rb4Cu16I7.2Cl12.8 Superionic Conductor
The expression for the incoherent scattering intensity Iincoherent is [21],
( ) 4 ( ) 4 ( ) 4
The space group P4332 has been suggested to be feasible for the crystal structure of Rb4Cu16I7.2Cl12.8 [20], with a unit-cell dimension a = 10.032 Å.
30
Figure 13: Observed diffuse background intensity (broken lines) for Rb4Cu16I7.2Cl12.8 superionic conductor as function of reciprocal space Q =4sin /.
Two diffuse peaks are observed at Q equal to 3.0 and 6.8 Å-1 respectively.
CONCLUSIONS
Two decades of superionic crystals research at BATAN have been described and discussed in this abridged review paper. A lot of grounds have been covered; nevertheless a more focused direction should be undertaken if an optimized research goal is to be achieved at all. In this respect, the attainment of a commercially viable and technologically superior rechargeable secondary battery should be the final uncompromised goal of this long research effort. As far as this goal is concerned, some of the present authors are still pursuing these particular objectives, by also considering and taking into account the appearance of new and more challenging materials such as those based on nanotechnology. In other parallel developments, other group at BATAN namely the renewable battery group led by Professor E. Kartini is actively pursuing research in superionic conductors based upon glassy electrolytes, in thin film as well as in nano scale morphology. Again the final goal is a commercially viable device based on this type of materials.
ACKNOWLEDGEMENT
Our most sincere gratitude goes posthumously to the late Prof. DR. Marsongkohadi (1932-2009) for much of this work was carried out either fully or partially under his supervision and instigation, during his tenure as director of PPSM (1987-2002), as doctoral supervisor of AKJ (1992-1998) and Magistrate supervisor to NE, SP and AW., and also during his tenure as member of the RUT.V Nasional advisory panel in materials science (1997-2000). We also acknowledge the support of Drs. Gunanjar, SU as the head of P3IB-BATAN (2002-2006), DR. Ridwan as head of PTBIN (2006-2008) and also to Ir. Iman Koentoro as head of PTBIN.
REFERENCES
31 [2]. K. TAKADA, T. KANBARA, T. SOTOMURA and S. KONDO, Proc. Symposium on
Solid State Ionics, Tottory Japan (1987) 93
[3]. R. KANNO,K. OHNO, Y. KAWAMOTO, Y. TAKEDA, O. YAMAMOTO, T. KAMIYAMA, H. ASANO, F. IZUMI and S. KONDO, J. Sol. St. Chem. 102 (1993) 79-92
[4]. D.S. BOYLE, K. GOVENDER and P.O. O’BRIEN, Chem. Commun. 1 (2002) 80-86. [5]. R.S MANNE and C.D. LOKHANDE, Materials Chemistry and Physics, 62 (2000)
1-7
[6]. http://www.electrochem.org/dl/ma/206/pdfs/2575.pdf/ M. TABIB-AZAR
EECS Department, Case Western Reserve University, Cleveland, Ohio 44106 (2007) [7]. http://www.electrochem.org/dl/ma/206/pdfs/2297.pdf/ C. MUNCE et al, Griffith
Univ. and CRC for micro technology, Nathan 4111, Qld, Australia (2007 [8]. V.N. BONDAREV and P.V. PIKHITSA, Phys. Rev 54(6) (1996) 3932-3945
[9]. M. MOROOKA, H. OHKI, K. YAMADA and T. OKUDA, Bull. Chem. Soc. Jpn. 76 (2003), 2111-2115
[10]. S.W. GOH, A.N. BUCKLEY, R.N. LAMB, Min. Eng. 19 (2006) 204
[11]. Y. SHAO-HORN, S.A HACKNEY, A.J KAHAIAN, M.M THACKERAY, J. Sol. St. Chem, 168 (2002) 60-68; G. AMATUCCI, J.M. TARASCON, J. Electrochem. Soc, 149 (2002) K31; SAFEI PURNAMA, ANTHONIUS S., P. PURWANTO, AZIS K. JAHJA dan SANTIANI, Pembuatan tabung Elektrolit Padat Superionik Al2O3
Untuk Sistem Sel Ionik, Prosiding Pertemuan Ilmiah Ilmu Pengetahuan dan Teknologi Bahan, Serpong (2002) 179-183; A. K. JAHJA, SAFEI PURNAMA and P. PURWANTO, Studies on Electrical properties of 2%MgO-49%Li2O-49%Al2O3
Composite Superionic Conductor, Prosiding Seminar Nasional Pengembangan Energi Nuklir, P2EN-BATAN (2008) 395-401; N. KUWATA, N. IWAGAMI, Y. TANJI, Y. MATSUDA and J. KAWAMURA, J. Electrochem. Soc. 157 (4) (2010) A521-A527
[12]. S.Y. CHEW, J.Z. SUN, J.Z. WANG, H.K. LIU, M. FORSYTH, D.R. MacFARLANE, Electrochimica Acta 53 (2008) 6460; P.PURWANTO, SAFEI PURNAMA, E. KARTINI, J. Sains Mat. Ind., 5(2) (2004) 14-18; A. K. JAHJA, T. NUGRAHA, A. FAJAR AND E. KARTINI, J. Sains Mat. Ind, Edisi Khusus (Desember 2009) 123-126 ; T. NUGRAHA, E. KARTINI, S. SUMINTA, A. DIMYATI, M. IKHSAN, A. SUDJATNO, R. SALAM, “Research and Development of Battery Materials for Energy Sources”, DIPA Technical Report PTBIN-BATAN Serpong (2008)
[13]. JH KENNEDY, Solid Electrolytes, Topics in Applied Physics, Chapter 5, ed. S. Geller, Springer Verlag, New York (1977)
[14]. SARMA RVGK dan RADHAKRISHNA S., Materials for Solid State Batteries, World Scientific Publ., Singapore, (1988)
[15]. A. K. JAHJA, N. EFFENDI dan S. PURNAMA, Ind J Phys-Kontribusi Fisika Indonesia, 14(2) 2003 51-55 (in Indonesian)
[16]. A. M. BERNARDES, D. C. R. ESPINOSA, J. A. S. TENORIO, Journal of Power Sources 130(1-2) (2003) 291-298
[17]. A.K.JAHJA, NURDIN EFFENDI, dan S. PURNAMA, Karakteristik Pengisian-peluwahan Sel Baterai Sekunder Berbasis RbAg4I5 Dengan Anoda Zn, Prosiding
Simposium Fisika Nasional, Serpong (2000) (in Indonesian)
[18]. N. EFFENDI, S. PURNAMA, A. K. JAHJA, J. Sains Mat. Ind. 1(3) Juni 2000 11-14 [19]. A. K. JAHJA, Doctoral dissertation (Bandung Institute of Technology), 1998
(unpublished works); A.K. JAHJA, J. Kond. Pdt, 3(2) (2002) 27-33; S.A. DANILKIN,
32
[20]. S. HOSHINO, T. SAKUMA and Y. FUJII, J. Phys. Soc. Jpn., 47(4), 1252 (1979). [21]. T. SAKUMA, J. Phys. Soc. Jpn., 62 (1993) 4150; A.K. JAHJA,
MARSONGKOHADI, Y. ISHII, Y. MORII, and Y. HAMAGUCHI, J. Phys. Chem. Solids 60 (1999) 272-276