TOWARDS PURCHASE INTENTION OF PCC CEMENT
PT. SEMEN PADANG IN DUMAI CITY
Dabitha Wise Maliha1, Yasri2, Rini Sariati3
Departmentof Economics, Faculty of Economics, State Uiversity of Padang, Indonesia 1
Abstract
This research aims to analyze the effects of trust and perceived value towards purchase intention of PCC Cement of PT. Semen Padang in Dumai city. Populations in the research are the consumer who experiences purchase PCC Cement in Dumai. The sampling has been developed through the accidentall sampling with Cochran, resulting in 100 respondents. The data is collected by using questionnaire. Technical data analysis has been done by multiple regression and t-test. The result of the research indicate that trust, perceived value has a significant efect on purchase intention of PCC Cement of PT. Semen Padang in Dumai city.
Keywords: TRust, Perceived Value and Trust
I. Introduction
The accelaration of development has been increased, causes purchase intention of society towards cement consumption in domestic market became higher.
Table 1. The Growth of Cement Domestic in Indonesia
Year Cement Sales emissions worldwide.According World Business Council for Sustainable Development (WBCSD) survey, cement production accounts for approximately 5% of worldwide man made CO2 emissions. Therefore, since 2009, PT. Semen Padang produced green cement called PCC Cement (Portland Composite Cement) which can reduce theCO2 emissions.
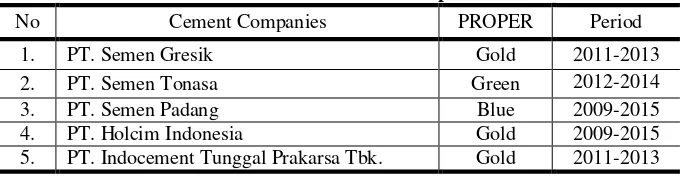
Table 2. PROPER Results of Cement Companies in Indonesia
No Cement Companies PROPER Period
1. PT. Semen Gresik Gold 2011-2013
2. PT. Semen Tonasa Green 2012-2014
3. PT. Semen Padang Blue 2009-2015
4. PT. Holcim Indonesia Gold 2009-2015
5. PT. Indocement Tunggal Prakarsa Tbk. Gold 2011-2013
Source: The Ministry of Environmental Website (http://www.menlh.go.id/)
This program measuredcompany’s environmental performance using colors rates which is ranging from gold as the best; green, blue, red, and black as the worst.
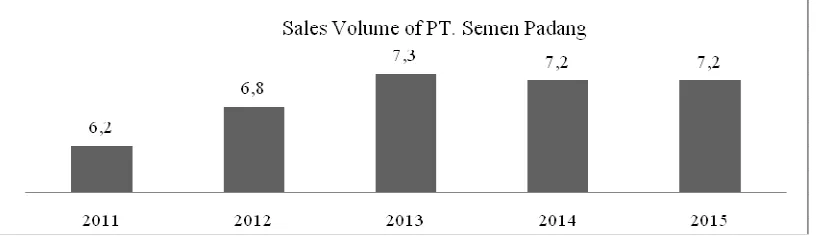
Table 2 shows PT. Semen Padang performances that get blue rate, means that the competitor environmental performances is better than PT. Semen Padang. In 2014, the consumer purchase intention of Semen Padang’s products is decreased. Figure 1.1 shows the sales volume of PT. Semen Padang keep increased, except in 2014. Therefore, at this condition, PT. Semen Padang have to increases the purchase intention of PCC Cement as featured product.
Source: Annual Report PT. Semen Padang, 2015
Figure 1.1 Sales volume PT. Semen Padang
Dumai city is one of the potential market target for PT. Semen Padang. It proven in 2015, the data of Semen Indonesia Association (ASI) showed market share of Semen Padang in Dumai and several Riau states approximately at 43% to 45%. At this period, PT. Semen Padang keep increased the PCC Cement production target 1.400 ton per day. Table 3 shows the monthly production report of PCC Cement in 2015.
Table 3 Monthly Production Report of PCC Cement at Cement Mill Dumai in 2015
Period Cement Mill
Source: Bureau of Cement Production & Packing Plant Dumai PT. Semen Padang (2015).
Table 3 shows PCC Cement production expenditures are not stable every month. It causes the high level competition market to increased the purchase intention of PCC Cement in Dumai. Trust and perceived value are alternatives to improving the consumer purchase interest of PCC cement. Previous studies proven there is positive and significant relationship between trust and perceived value towards purchase intention, which means if trust and perceived value are high, it also increasing the purchase intention.
Table.4 Survey Results CSI PCC Cement
CSI 2012 2013 2014
Distribution Channel 78,98 78,05 79,47
End User 79,84 74,32 76,4
Influencer 73,32 73,47 74,85
CSI Overall 77,38 75,28 76,9
Source: Bureau Sales Region I, 2014
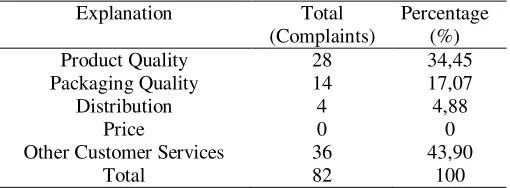
The consumers can feel the lack value of products. Therefore, PT. Semen Padang provides Call Center facility to accomodate solution alternatives which is related to products, packaging, distributions and prices.
Table 5. Customer Complaints of PCC Cement in 2014
Explanation Total
Other Customer Services 36 43,90
Total 82 100
Source: Bureau Sales Region I, 2014
During 2014, there were 82 customers complaint about PCC Cement. It proves that PCC Cement still had shortcomings in terms of perceived value.
II. Teoritical Framework Purchase Intention
Purchase intention represents the possibility that consumers will plan or be willing to purchase a certain product or service in the future. (Chinomona et al., 2013). Besides, purchase intention is defined in the context of this study as the willingness of consumers to plan the purchase of a particular product (Carrillat et al., 2009). Therefore, an increase in purchase intention means an increase in the possibility of purchasing (Dodds, Monroe, & Grewal, 1991; Schiffman & Kanuk, 2007; Carrillat et al., 2009). Purchase intention indicates an emotional reaction resulting from consumer’s overall evaluation of a product, and also indicates possibility that consumers would like to purchase the product (Grewal, Monroe, & Krishnan, 1998). So, purchase intention is the most precise predictor of purchase behavior (Morwitz & Schmittlen, 1992).
The indicators of purchase intention refers to Pavlou (2003) and Chen and Chang (2008), and its includes three items: 1) Consumers intend to purchase more of this product. 2) Consumers expect to keep purchase this product in the future. 3) Consumers prefer to purchase this product than others.
Besides trust dan perceived value, Chinomona et al., (2013) explain that product quality is one of factors influencing purchase intention. Lai (2015) also said that commitment as one of influencing purchase intention.
Trust
long-term consumer behavior (Lee et al., 2011). However, trust is a level of the assurance that another party would behave as expected (Hart and Saunders, 1997). According to Moorman, Deshpande, and Zaltman (1992), trust is defined as a a willingness to rely on an exchange partner in whom one has confidence.
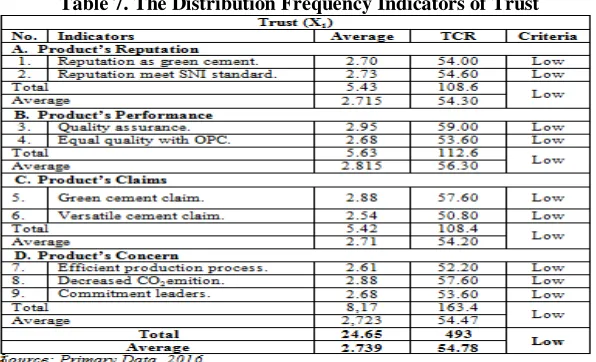
The indicators of trust refers to Chen (2010) and its includes fourth items: (1) Product’s reputation. It consists of 2 sub indicators: (a) Product reputation as green product. (b) Product reputation meet SNI standard. (2) Product’s performance. It consists of 2 sub indicators: (a) Product’s quality assurance in general. (b) The quality of green product same with conventional product. (3) Product’s claims.It consists of 2 sub indicators: (a) The claim as green product. (b) The claim as versatile product. (4) Product’s concern. It consists of 3 sub indicators: (a) The production process’s more efficient energy. (b) The production process able to decrease CO2 emition. (c) The leaders of company commit to decrease negative impact to environment.
Trust plays a critical role in determining consumer’s purchase decisions (Wu, 2013) in that a perception of trustfulness that a specific product or item has in the consumer’s mind may provide the confidence of it sound performance and therefore motivate it purchase (Chinomona et al ., 2013). According to Chen (2010), consumer trust would positively influence consumer purchase intention. Meanwhile, Schlosser et al., (2006) also added that purchase intention determined trust by consumers.
Perceived Value
Mantz and Mantz (2014) defined perceived value as a consumer’s overall assesment of the utility of a product or service based on perceptions of what it received and what is given. Zeithaml (1988) alsodiscussed that perceived value can be regarded as the overall evaluation consumers made of a product based on their gains and what they paid.
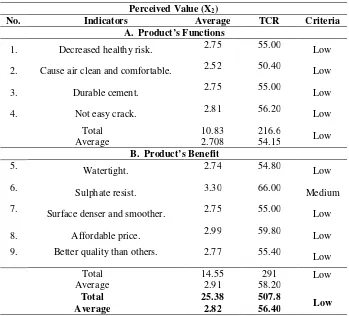
The indicators of perceived value refers Patterson and Spreng (1997) and its includes two items: (1) Product’s functions. It consists of 4 sub indicators: (a) Product can decrease negative impact to healthy. (b) Product can cause the air clean and comfortable. (c) Long lasting product. (d) Product isn’t easy to crack. (2) Product’s benefits. It consists of 5 sub indicators: (a) Product’s more watertight. (b) Product’s more resistant to sulphate. (c) The concrete surface denser and smoother. (d) Product’s more affordable price. (e) Product has better quality than others.
Perceived value is the most important element motivating customers towards purchase intention (Zeithaml, 1988). It means poor perceived value can result in loss of consumer purchase intention (Sweeney dan Soutar, 2001) and if consumers perceive that the value of a product is higher, they are more likely to purchase a product (Chen dan Chang, 2012). Therefore, perceived value is very important today because different companies are improving purchase intention by emphasizing their product value (Steenkamp & Geyskens, 2006).
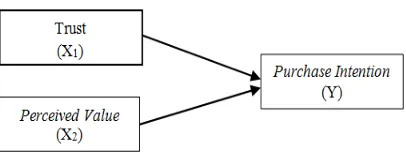
Research Framework
To summarize the literature review and research hypothesis, this study establishes the research framework depicted in Figure 2.1. This study is to explore two independent variables – trust and perceived value; and further how to affect the dependent variable, purchase intention.
III. Research Methods
The type of this research is quantitative associatif and the following hypotheses is tested used a statistical test which shown the influence of variables trust and perceived value to purchase intention. The population were all the consumers who experiences purchase PCC Cement in Dumai. The sampling has been developed through accidentall sampling with Cochran, resulting in 100 respondents
The current study utilizes a non-probability sampling technique which is accidental sampling. It consists of primary data and secondary data. Primary data obtained by questionnaires which were collected by the respondents from different categories and secondary data is taken from publications.
The validity and reliability is tested through collected questionnaires. This study found that all of the items are valid and reliable. Technical data analysis with multiple regression used to found the relation of trust and perceived value towards purchase intention. The testing of hypothesis was analyzed through t-test.
IV. Results and Discussion
Table 6. The Distribution Frequency Indicators of Purchase Intention Purchase Intention (Y)
No Sub Indicators Average TCR Criteria
1. Consumers more purchase PCC. 2.76 55.2 Low
2. Consumers keep purchase PCC. 2.67 53.4 Low
3. Consumers prefer purchase PCC. 3.04 60.8 Medium
Total 8.47 169.4
Low
Average 2.82 56.47
Source: Primary Data, 2016
In this study, the purchase intention of PCC Cement consumers in Dumai are relatively low. Although consumers prefer to purchase PCC rather than purchase other cements, they are not really interested to purchase more of its product. They are also might not keep continuously purchase its product.
This study proves that consumers’ trust of PCC Cement in Dumai are relatively low. In addition, product’s performance is the most considered factor to increasing trust of consumers. Meanwhile, the claims of PCC Cement cannot be guaranteed to increase consumers trust, because the results of this study show that the product’s claims is the lowest criteria rather than other sub indicators
Table 8. The Distribution Frequency Indicators of Perceived Value
Perceived Value (X2)
No. Indicators Average TCR Criteria
A. Product’s Functions
Sulphate resist. 3.30 66.00 Medium
As indicated in table 9, the first hyphotesis indicates a significant relationship between trust (X1) towards purchase intention (Y). The first hypothesis obtaines t value = 4,716 and significancy 0,00 < 0,05. Thus, H0 has been rejected and Ha has been accepted.
At second hypothesis, perceived value (X2) has significant influence towards purchase intention (Y). Based on hypothesis test, t value = 3,825 and significancy 0,00 < 0,05. Thus, H0 has been rejected and Ha has been accepted.
According to table 9, determination coefficient is 0.685. It means trust and perceived value contributes approximately 68.5% towards purchase intention. Meanwhile, the other 31.5% is determined by other factors outside of this study. The other factors might been influenced by product quality and commitment.
Discussion
The Influence of Trust towards Purchase Intention
This study found that trust has positive and significantly influences on purchase intention. Therefore, trust directly influences the purchase intention of PCC Cement in Dumai city.
Table 9 shows that trust is 0.149 coefficient. It identifies that trust would increases approximately 0.149 influenced the purchase intention. Therefore, if the consumer trust to PCC Cement is intensify, their intention to purchase also higher. As Chen (2010) said, trust would give impact towards purchase intention of a products. Thus, this research is relevant with previous research by Kwok et al (2015), Chinomona et al (2013), and Lai (2015).
The Influence of Perceived Value towards Purchase Intention
This study proves that perceived value has positive coefficient and significantly influences towards purchase intention. It means, if PCC Cement offering better value to consumers, the consumer’s perception would positive and interested to purchase this product.
The results of multiple regression shows that perceived value has 0.137 coefficient. It identifies that perceived value would increases approximately 0.137 influenced purchase intention. Thus, this research is relevant with previous research by Kwok et al (2015) and Lai (2015), but it’s irrelevant with Chinomona et al (2013) which found that perceived value insignificantly influences purchase intention.
V. Conclusions
Trust has positive significant influence towards purchase intention of PCC Cement of PT. Semen Padang in Dumai city. Thus, trust is one of factors which determined purchase intention PCC Cement.
References
Annual Report PT. Semen Padang, Tahun 2010-2015. darisemenpadang.co.id.
Abbasi, M.U.H., Qureshi, Q.S., et al., (2013). Green Purchase Intention: an examination of customers towards Adoption of Green Products. Journal of Public Administration and Governance. Vol. 3, No. 3, pp. 244-263.
Akbar, W., Hassan, S., et al., (2014). Antecedents Affecting Customer’s Purchase Intentions towards Green Products. Journal of Sociological Research. Vol. 5, No. 1, pp. 273-289.
Bolton, R.N. and Drew, J.H. (1991), “A multistage model of consumers’ assessment of service quality and value.”Journal of Consumer Research, 17(4), 375-84.
Carrillat, F.A., Jaramillo, F., Mulki, J.P. 2009. Examining the impact of service quality: A meta-analysis of empirical evidence. Journal of Marketing Theory and Practice, 17 (2): 95–110. Chang, H.H. and Chen, S.W. (2008), “The impact of online store environment cues on purchase
intention: trust and perceived risk as a mediator”, Online Information Review, Vol. 32 No. 6, pp. 818-41.
Chen, Y.-S. (2010) “The drivers of green brand equity: green brand image, green satisfaction, and green trust”, Journal of Business Ethics, 93(2), 307-319.
Chen, Y.-S, & Chang, C.-H. (2012). Enhance Green Purchase Intentions: The Roles of Green Perceived Value, Green Perceived Risk, and Green Trust. Management Decision .Emerald Group Publishing. Vol 50(3) 502 520.
Chinomona, R., Okoumba, L., &Pooe, D. (2013). The Impact of Product Quality on Perceived Value, Trust and Students’ Intention to Purchase Electronic Gadgets. Mediterranean Journal Of Social Sciences, 4(14), 463.
Dodds, W.B., Monroe, K.B., Grewal, D. 1991. Effects of price, brand, and store information on buyers’ product evaluation. Journal of Marketing Research, 28 (3): 307–319.
DuniaIndustri. Januari 2016. “LampauiEstimasi, Konsumsi Semen Sepanjang 2015 Tumbuh 1,8% Jadi 61 Juta Ton”. Dikutipdarihttp://duniaindustri.com/ lampaui-estimasi-konsumsi-semen-sepanjang-2015-tumbuh-18-jadi-61-juta-ton.
Ganesan, S. (1994). Determinants of long-term orientation in buyer-seller relationships. Journal of Marketing, 58(2), 1-19.
Grewal, D., Monroe, K. B., & Krishnan R. (1998).The effects of price-comparison advertising on buyers’ perceptions of acquisition value, transaction value, and behavioral intentions. Journal of Marketing, 62(2), 46-59.
Hart, P. and Saunders, C. (1997), “Power and trust: critical factors in the adoption and use of electronic data interchange”, Organizational Science, Vol. 8 No. 1, pp. 23-42.
HasilPenilaian Proper KementerianLingkunganHidup. Tahun 2009-2014. Dikutip darihttp://www.menlh.go.id/
Hong, I.B., & Cho, H. 2011. The impact of consumer trust on attitudinal loyalty and purchase intentions in B2C e-marketplaces: Intermediary trust vs. seller trust. International Journal of Information Management, 31: 469– 479.
Kotler, Philip; Armstrong, Garry, 2008. Prinsip-prinsipPemasaran, Jilid 1, Erlangga, Jakarta. Kwok, M.L.J., Wong, M.C.M., Lau, M.M., (2015), Examining How Environmental Concern
Affects Purchase Intention: Mediating Role of Perceived Trust and Moderating Role of Perceived Risk, Contemporary Management Research, VOL 11, NO 2, 2015, pp. 143-152. Lai, Y.H. (2015), “Enhance Online Purchase Intentions: The Role of Perceived Value, Trust, and
Lee, J., Park, D.-H. and Han, I. (2011), “The different effects of online consumer reviews on consumers’ purchase intentions depending on trust in online shopping malls: an advertising perspective”, Internet Research, Vol. 21 No. 2, pp. 187-206.
Li, X., Hess, T.J., &Valacich, J.S. 2006. Using attitude and social influence to develop an extended trust model for information systems. Database for Advances in Information Systems, 37 (2–3): 108–124.
Lin, N.P., Weng, J.C.M. & Hsieh, Y.C. (2003). Relational bonds and customer's trust and commitment: A study on the moderating effects of web site usage. Service Industries Journal, 23(3), 103-124.
Mantz, T., Mantz, K. (2014). The Perceived Value of Green Products in the Context of Traditional Products: Which Products Hold the Most Perceived Value to the Consumer and Why. Global Waste Symposium, July 2014.
Moorman, Deshpande, &Zaltman. 1993. Factor Affecting Trust in Market Reasearch Relationship. Journal of Marketing. January Vol 57. PP 81- 101.
Morwitz, V. G., &Schmittlein, D. (1992). Using segmentation to improve sales forecasts based on purchase intent: which interders actually buy? Journal of Marketing Research, 29(4), 391-405. Nik Abdul Rashid, NR, 2009. “Awareness Of Eco-label In Malaysia's Green Marketing Initiative,”
International Journal of Business and Management, 4(8), 132- 141.
Pavlou, P.A. (2003), “Consumer acceptance of electronic commerce: integrating trust and risk with the technology acceptance model”, International Journal of Electronic Commerce, Vol. 7 No. 3, pp. 101-34.
Rehman, Z., Khyzer, M., & Dost, B. (2013). Conceptualizing Green Purchase Intention in Emerging Markets: An Empirical Analysis on Pakistan. In International Academic Conference Proceddings.
Rotter, J.B. (1971), “Generalized expectancies for interpersonal trust”, American Psychologist, Vol. 26 No. 5, pp. 443-50.
Rousseau, D.M., Sitkin, S.B., Burt, R.S. &Camerer, C. (1998). Not so different after all: A cross-discipline view of trust. Academy of Management Review, 23(3), 393-404.
Schiffman, L.G., Kanuk, L.L. 2007. Consumer Behavior, ninth ed. Prentice-Hall Inc, NJ.
Schlosser, A.E., White, T.B. and Lloyd, S.M. (2006), “Converting web site visitors into buyers: how web site investment increases consumer trusting beliefs and online purchase intentions”, Journal of Marketing, Vol. 70 No. 2, pp. 133-48.
Schurr, P.H. and Ozanne, J.L. (1985), “Influences on exchange processes: buyers’ preconceptions of a seller’s trustworthiness and bargaining toughness”, Journal of Consumer Research, Vol. 11 No. 4, pp. 939-53.
Steenkamp, J.B.E.M. and Geyskens, I. (2006). How country characteristics affect the perceived value of web stes. Journal of Marketing, 70(3): 136-150.
Sweeney, J.C., Soutar, G.N. and Johnson, L.W. (1999), “The role of perceived risk in the quality-value relationship: a study in a retail environment”, Journal of Retailing, Vol. 75No. 1, pp. 77-105.
Sugiyono, 2014. MetodePenelitianManajemen, Alfabeta, Bandung.
World Business Council for Sustainable Development. (2015, December 8). Cement industry calls for long-term policy certainty as it aspires to reduce CO2 emissions by 20-25% by 2030. Retrieved from http://www.wbcsd.org/cement-industry-calls-for-long-term-policy-certainty-as-it-aspires-to-reduce-co.aspx.