Volume 24, Number 3, 2009, 337 – 346
HALVING POVERTY IN INDONESIA
1Ilmiawan Auwalin
Indonesia Regional Economic Development Institute, (alin@redi.or.id)
Abstract
This study extends the literature on relationship between economic growth, income inequalities, and poverty reduction. We discuss poverty reduction, using the case of Indonesia, as one of the Millennium Development Goals declared by the United Nations General Assembly in September 2000. Using provincial level data of Indonesia from 1993 to 2000, we examine the required conditions in order to halve the poverty in Indonesia by 2015. The result of analysis shows that Indonesia would need to achieve constantly 8 percent economic growth in order to halve the poverty rate by 2015. In addition, analysis on the relationship of income inequalities and poverty reduction in Indonesia also shows that improvement on income distribution will have fairly significant impact in poverty reduction.
Keywords: economicgrowth, income inequalities, and poverty reduction
INTRODUCTION1
Poverty is one of the most common pro-blems in the world, especially in developing countries. It is not surprising that halving poverty headcounts is the first of the eight Millennium Development Goals for improving human welfare declared by the United Nations General Assembly in September 2000. The goals, including halving the proportion of poor people, are expected to be achieved by 2015 (UNDP, 2004). In the case of Indonesia, as one of the countries participating in the declaration, poverty is also one of the major concerns that need to be resolved. Therefore, it is particularly interesting to identify what conditions needs to be satisfied by this country in order to be able to reduce the proportion of the poor by half. As some empirical studies have identified the important role of economic
1 This Paper was presented in the 2nd IRSA (Indonesia Regional Science Association) International Institute, Bogor, 22-23 July 2009.
growth and income inequality in poverty reduction, this paper discusses the conditions to be satisfied in both economic growth and income inequalities terms, specifically in the case of Indonesia.
We begin the discussion of this paper with general overview of Indonesia, including the poverty problem in this country. Then we discuss the relation of economic growth, income equality and poverty reduction by reviewing some theories and empirical studies. Finally we discuss the requirements to be fulfilled in order to halve poverty in the case of Indonesia in terms of economic growth and income inequality.
General Overview of Indonesia
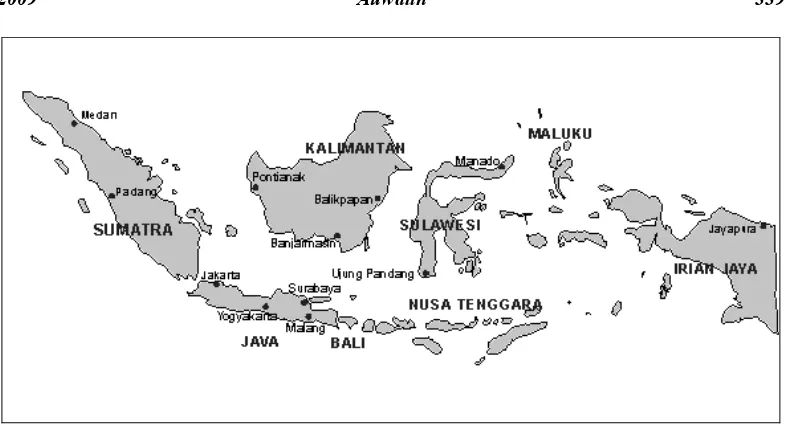
groups of islands, they are Sumatera, Java, Bali and Nusa Tenggara, Kalimantan, Sulawesi, and Maluku and Papua (Irian Jaya). These groups of islands are significant in terms size and each group has similar charac-teristics in terms population. The following Figure 1 shows the map of the main islands in Indonesia.
As an archipelagic country, the population of Indonesia is spreading over its islands. Nevertheless, most population is concentrated mainly in the Java Island, followed by Sumatera Island. We can see from Table 1, in 1995 and 2000, more than 59 per cent of popu-lation lived in Java Island. This percentage slightly decreased in 2005. Meanwhile, around 21 per cent of population lived in Sumatera Island during 1995 until 2005. This population concentration does not imply that the poverty is also concentrated in the Java and Sumatera Island as we will see in the Table 2 on poverty rate.
Poverty in Indonesia
In discussing poverty, first, we need to define who the poor are. The World Bank (2001) defined to be poor as the case of deprivation in well-being that includes being hungry, being lack of shelter and clothing, being sick and not cared for, being illiterate and having no education. This is a fairly broad and descriptive definition that would be difficult to be applied as a measurement of poverty in practical terms. Therefore, practical poverty measurement is an important aspect in poverty alleviation effort as it will define between the poor and non poor. The common practical measurement uses either the absolute poverty definition or the relative poverty definition. One of the examples of the absolute poverty definition is the definition of the poor by the World Bank that defines the poor as the individuals whose income are below the “dollar-a-day” fixed poverty line (Dollar & Kraay, 2002: 221). The example of the application of relative poverty definition is the
definition of the poor as the poorest 20 per cent, in terms of income, of the population that we can find in some empirical studies such as by Dollar & Kraay (2002), Roemer & Gugerty (1997), and Bourguignon (2000).
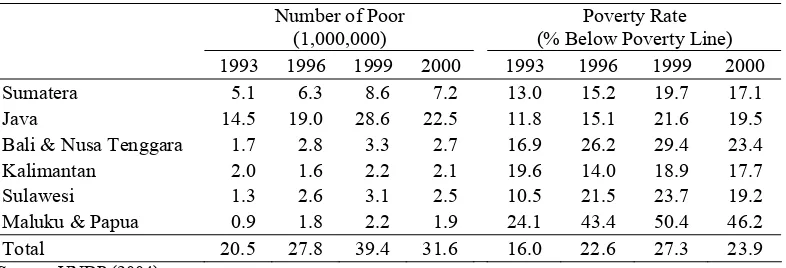
In the case of Indonesia, poverty is officially measured using the absolute poverty definition where an official poverty line is used a benchmark. The Indonesian statistics bureau (BPS) defined the poor as individuals whose monthly expenditure below poverty line, which is the amount of money needed to purchase minimum basic essentials to sustain life (Maksum, 2004: 3). BPS translated this poverty line into operational terms as the Rupiah –Indonesian currency– value needed by an individual in order to fulfill his or her daily minimum requirement for food of 2,100 kilocalories (kcal), plus non-food minimum needs, such as housing, clothing, health, education and transportation (UNDP, 2004). People whose expenditures are less than the Poverty Line are classified as living below the Poverty Line, or as poor population. Further-more, as the living costs across provinces are different, in addition to the national poverty line, each province has their own poverty line. Table 1 below describes the poverty figures in Indonesia across group of islands using the provincial poverty line officially determined by the government.
fairly large effort in order to be able to cut in half the proportion of the poor.
Looking at the proportion of the poor compared to the population in each group of islands, it appears that Java and Sumatera, two of the most populated islands, are not the one that suffering high poverty. Meanwhile, the islands located in the eastern part of Indonesia, including Bali and Nusa Tenggara and Maluku and Papua, are the one with fairly high percentage of population living below the
poverty line. Maluku and Papua have the highest proportion of the poor with 46.2 per cent population living below the poverty line in 2000. In the contrary, as we have seen in Table 1, this group only contributes 2.1 per cent population nationally. Furthermore, later in the regression result we will see that this group requires fairly large economic growth in order to halve the proportion of the poor.
Source: www.seasite.niu.edu
Figure 1. Map of Indonesia
Table 1. Distribution of Population in Indonesia by Group of Islands
Population (1,000,000) % Distribution
1995 2000 2005 1995 2000 2005
Sumatera 40.8 42.7 46.3 21.1% 21.0% 21.1%
Java 114.7 120.4 127.8 59.2% 59.2% 58.3%
Bali, Nusa Tenggara 10.1 10.9 11.9 5.2% 5.3% 5.4%
Kalimantan 10.5 10.9 12.6 5.4% 5.4% 5.7%
Sulawesi 13.7 14.4 16.0 7.1% 7.1% 7.3%
Maluku & Papua 4.0 4.1 4.7 2.1% 2.0% 2.1%
Total 193.9 203.5 219.2 100.0% 100.0% 100.0%
Table 2. Number and Percentage of Population below the Poverty Line by Group of Islands
Number of Poor (1,000,000)
Poverty Rate (% Below Poverty Line)
1993 1996 1999 2000 1993 1996 1999 2000
Sumatera 5.1 6.3 8.6 7.2 13.0 15.2 19.7 17.1
Java 14.5 19.0 28.6 22.5 11.8 15.1 21.6 19.5
Bali & Nusa Tenggara 1.7 2.8 3.3 2.7 16.9 26.2 29.4 23.4 Kalimantan 2.0 1.6 2.2 2.1 19.6 14.0 18.9 17.7
Sulawesi 1.3 2.6 3.1 2.5 10.5 21.5 23.7 19.2
Maluku & Papua 0.9 1.8 2.2 1.9 24.1 43.4 50.4 46.2
Total 20.5 27.8 39.4 31.6 16.0 22.6 27.3 23.9
Source: UNDP (2004)
LITERATURE REVIEW
There has been a long debate on the relation of economic growth and poverty reduction. One of the most important issues in this regards is the question on the significance of economic development as a mean to reduce poverty or, in other word, what is the benefit of economic growth for the poor. In normal condition, when there is no economic crisis, economic growth would benefit all part of the society, including the poor and thus it decreases poverty. Some studies have tried to measure the relation of economic growth and poverty reduction. Dollar & Kraay (2002: 195) show that economic growth is important in poverty alleviation. Using the data of 92 countries, they found that the average incomes of the poorest 20 per cent of a country increases proportionally at the same rate as the increase of average incomes in the country. In this case, the poverty decreases when the mean real income of the bottom 20 percent increases. Though they found significant relation of growth and poverty reduction, Dollar & Kraay (2002: 219), point out that economic growth is not everything that is required to alleviate poverty. Nevertheless, as the economic growth benefits the poor as much as the non poor do, they suggest that growth-promoting policies should be the main part of an effective poverty alleviation scheme.
Another study on the relation of poverty and growth using relative poverty definition is carried out by Roemer & Gugerty (1997). Using the data of 26 developing countries, they examine the question of whether econo-mic growth would tend to reduce poverty, in which poverty is measured by the average incomes of the poorest 20% and 40% of the population. Their analysis shows that an increase in the rate of per capita GDP growth increases the average income of the poorest 40% in the same proportion. While for the poorest 20% has the response elasticity of 0.921; so per capita GDP growth of 10% means income growth of 9.21%. These results show that on average the poor benefits from economic growth and therefore growth in per capita GDP could be an influential means in poverty reducing efforts.
countries need a GDP per capita growth rate of 3.8 per cent, which is more than twice of the 1.6 per cent average growth achieved from 1960 to 1990. Furthermore, Besley and Burgess also analysed that a decline in the Gini coefficient of inequality by one standard deviation should cut poverty in developing countries by 67 per cent. The study result of this study confirms that both economic growth and income equality are important means in poverty reduction.
The discussion on the relation of poverty and income inequality, as what Besley and Burgess partially discussed in their paper, is another important issue in poverty alleviation studies. The importance of income equality in poverty reduction is due to the fact that some countries have achieved fairly high economic growth performance but only experienced relatively insignificant poverty reduction. In contrast, some other countries with fairly low economic growth were able significantly reducing poverty (Pasha and Palanivel, 2004). In a detailed study, Kalwij and Verschoor (2007) examine the role of income distribution in determining the capacity of income growth in reducing poverty and changing in income inequality. They use panel data of 58 developing countries for the period 1980 until 1998. They found out that the variation in the income elasticity that able to increase the income of the poor is primarily explained by differences in the initial distribution of income and present region and time specific estimates of the income and Gini elasticities of poverty. This study verifies that economic growth without promoting income improvement of the poor would not be sufficient to reduce poverty significantly.
As we discuss the relationship of econo-mic growth and poverty reduction in the case of Indonesia, it is necessary to consider the existing similar study for Indonesian case. Suharyadi et al. (2006) analyse the relation-ship between economic growth and poverty reduction by considering sectoral
compo-sitions and locations of economic growth and poverty. They found that, in terms of poverty elasticity, growth in rural agriculture signifi-cantly reduces poverty in the rural agriculture sector and growth in urban services decreases poverty both in services and manufacturing sector in urban areas. Based on these findings, they suggest that the effective approach to reduce poverty is by focusing growth in rural agriculture and urban services sector. Their findings and suggestions confirm that econo-mic growth is important in poverty alleviation in Indonesia.
Based on various existing studies discussed above, one can see that economic growth and improvement on income inequality can have significant impact on poverty. In relation to poverty reduction strategy, econo-mic growth should be an important aspect to be considered, as well as reducing income equality. With regards to the case of this paper, measuring the impact of economic growth and income inequality improvement in Indonesia would provide an insight on one the importance of the two aspects in poverty reduction in Indonesia.
DISCUSSION
The data we use is mainly from the BPS. The BPS calculated the poverty data from the result of Susenas (the National Socioeconomic Survey). Susenas is a nationally representative household survey conducted by the BPS covering all areas of the country (Suryahadi et al., 2006). We use the provincial level data from 1993 to 2000 and analyzed the data into six groups of islands. In this paper, we define the poor as the population living below the poverty line. The proportion of the poor forms the headcount rate which we use in the analysis. Furthermore, as we analyze the effect of economic growth on poverty, the economic condition in each province is represented by the real Gross Regional Domestic Product (GRDP) per capita. In this case, we use the real GRDP per capita that excluding oil and gas in order to minimize the bias caused by the large effect of income from oil and gas.
The Effect of Economic Growth on Poverty Rate
We have noted in the reviewed empirical studies that the poor can benefit from economic growth and therefore they will be able to exit from poverty. In this regards, in order to estimate the efficacy of economic
growth on alleviating the poor from poverty, the key point is the elasticity of poverty with respect to income per capita (Besley & Burgess, 2007: 7). The model we use in the regression to generate the elasticity of poverty is similar with the one developed by Besley and Burgess.
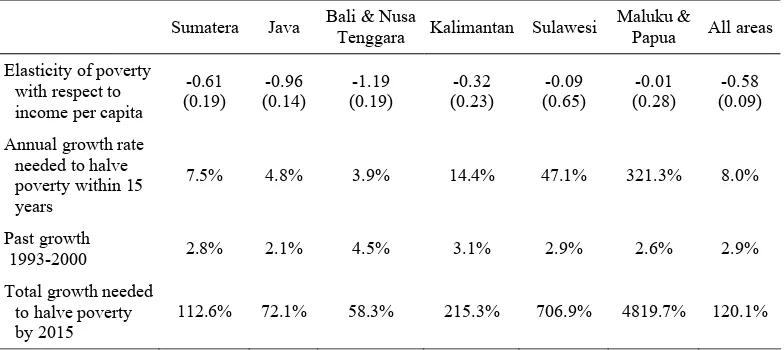
Where Pit is percentage of people below poverty line of province i at time t based on poverty line determined by government, δi is fixed province effect, β is the elasticity of poverty with respect to GRDP per capita, Yitis real per capita Gross Domestic Regional Product (GRDP) of province i at time t, and uit is the error term. In particular, the parameter of interest is β, which we use for analysing the effect of economic growth on poverty. Table 3 shows the result of the regression and the implication on poverty rate. The second row in the table shows the estimate β, which is the coefficient on the variable of log GRDP per capita, that represent the elasticity of poverty with respect to income per capita. For all areas, the coefficient is equal to -0.58 which verifies that growth in income per capita are correlated with decrease in poverty rate.
Table 3. Growth and Poverty in Indonesia, 2000-2015
Sumatera Java Bali & Nusa
Tenggara Kalimantan Sulawesi
Maluku &
Papua All areas
Elasticity of poverty with respect to income per capita
-0.61
Annual growth rate needed to halve poverty within 15 years
7.5% 4.8% 3.9% 14.4% 47.1% 321.3% 8.0%
Past growth
1993-2000 2.8% 2.1% 4.5% 3.1% 2.9% 2.6% 2.9%
Total growth needed to halve poverty by 2015
112.6% 72.1% 58.3% 215.3% 706.9% 4819.7% 120.1%
In the second row of Table 3, it is interesting to note that the poverty elasticity with respect to income per capita for Sulawesi is fairly small and even smaller for Maluku and Papua, though the past growth in 1993 to 2000 of these groups are almost similar with national growth. In this case, we can infer that most of the growth was not going to the poor, or in other words, that the poor in this area do not get much benefit from the economic growth. In this regards, we check the sectoral GRDP of the group, especially Papua, and we get an interesting finding. Though, as we noted earlier that we exclude oil and gas in GRDP per capita for the analysis, it appears that the GRDP still include other mining. In the case of Papua, mining sector, excluding oil and gas, still have significant proportion in the GRDP. In 2002, in the sectoral GRDP of Papua, the mining and quarrying sector is accounted for 63.10 per cent of total GRDP. Out of this figure, mining -excluding oil and gas- has the biggest share of 58.21 per cent (BPS Papua, 2003: 480). This is also the case for Sulawesi, where the non oil and gas mining also has large proportion in the GRDP. It is common knowledge that the mining sector does not involved the poor directly in their production activities. Therefore, it is not surprising that the poor do not get much benefit from the economic growth dominated by mining sector contribution.
We use the estimated β to derive the annual economic growth per capita rate required to cut in half the proportion of the poor in all areas and in each group of islands in 15 years period from 2000 until 2015, as targeted in the Millennium Development Goals. The third row of Table 3 shows the result of the calculation. For all areas, with poverty elasticity of -0.58, it means that 8 per cent annual growth nationally within 15 years would be needed to halve the poverty rate. It is a fairly high economic growth, almost tripled the past economic growth. With 8 per cent
annual growth within 15 years, the total growth needed would be 120 per cent.
If we compare among group of islands, it appears that Java has the smallest required annual growth. It is not surprising as Java is the centre of economic growth in Indonesia. Nevertheless, the past growth of Java is only half of the annual growth needed and it is only Bali and Nusa Tenggara group has the past growth that exceeds the required growth rate. It appears that the poor benefited the tourism sector that dominating the tourism industries in these areas. Once again, Sulawesi and Maluku and Papua as special cases have the largest required annual growth. In these areas, economic growth has fairly low impact on the poor, and it is not surprising that the past growth rate in these areas is far from the needed economic growth to halve poverty there.
The result of the analysis, both in all and individual areas, confirm the findings of other various empirical studies that economic growth has significant role in alleviating the poor from poverty. However, the calculation result also shows that for all groups of islands, except Bali and Nusa Tenggara, the amount of growth required to reduce the poverty by half is larger than the past growth of the areas. The implication of this result is that the economic growth solely will not be enough to reduce the poverty in fairly short term. In this case, pro poor economic growth in which the poor can get most benefit of the growth would be more effective in poverty reduction. Nevertheless, designing pro poor economic growth is not an easy task as it will influence the whole economic growth as well. In addition, as we will see in the next section that the impro-vement on income inequalities through income redistribution is also important to reduce the absolute poverty.
Inequality and Poverty
is not surprising that in poverty reduction discussion, inequality is frequently appears as an indicator of poverty. One of the widely used inequality indicator is the Gini coefficient that measure income distribution calculated based on income classes (BPS, 2007). The Gini ratio represents perfect equality at zero and perfect inequality at one. Changes in inequality is particularly important as the previous section has shown that solely counting on economic growth represented by increase in income per capita to reduce poverty is not enough. In this part, improving income inequalities will play the important role.
In order to measure the variations in inequality related to poverty reduction in Indonesia by controlling income per capita, we also use the approach developed by Besley and Burgess. In this regard the model in the regression is the following.
it
Where Pit is percentage of people below poverty line of province I at time t based on poverty line determined by government, δi is fixed province effect, β is the elasticity of poverty with respect to GRDP per capita, Yit is real per capita Gross Domestic Regional Product (GRDP) of province I at time t, σitis income inequality (Gini coefficient) for province I at time t measured by the standard deviation of the income distribution in log form, and uit is the error term. In the regression, γ which is the coefficient of the
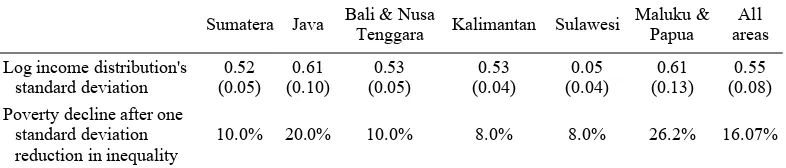
income inequality variable is equal to 2.01 that indicate positive and significant relationship of income inequality and the poverty level of certain province.
The third row of Table 4 describes the result of reduction in poverty level after lowering the income inequality by one standard deviation. In this case, the meaning of by one standard deviation is by the amount of the standard deviation in parenthesis in the second row of Table 4. The result in the table confirms that Indonesia still have relatively high inequalities across provinces. For all areas, one standard deviation decrease in level of inequality (measured with GINI ratio) would reduce poverty by 16 per cent nationally. This means that to reduce poverty by half, we need to lower the level of income inequality at least by three standard deviations. The result also shows that as the inequality in Maluku and Papua is relatively high, lowering one standard deviation of income inequalities in this region would reduce poverty by 26.2 per cent which is a fairly high impact on poverty reduction.
The implication of the result is that focusing in improving income distribution will also useful in reducing poverty. Furthermore, combining the effort on reducing income inequalities with the economic growth would give larger impact on poverty reduction. In this regards, Besley and Burgess (2002, p. 11) point out that economic growth that reduces income inequality would be more effective in reducing poverty.
Table 4. Inequality and Poverty Reduction in Indonesia
Sumatera Java Bali & Nusa
Tenggara Kalimantan Sulawesi
Maluku & Papua
All areas
Log income distribution's standard deviation
0.52 Poverty decline after one
standard deviation reduction in inequality
10.0% 20.0% 10.0% 8.0% 8.0% 26.2% 16.07%
CONCLUSION
In this study we contribute to the literature on the relationship between economic growth, income inequality, and poverty reduction, especially in the case of Indonesia. The result of the analysis shows that economic growth does matter in the poverty reduction. How-ever, when we analysed by group of islands, in Sulawesi and Maluku & Papua, economic growth does not have fairly significant impact on poverty reduction. In addition, the analysis on the relationship of income inequalities and poverty reduction in Indonesia also show that improvement in income distributions that will help the poor to increase their income has a fairly significant impact on poverty reduction.
Based on the findings, using economic growth as main part of poverty reduction strategy is reasonable. The poverty reduction strategy would be even better when focus in economic growth is combined with the effort in reducing income inequality so that the economic growth will become a pro poor economic growth. In the pro poor economic growth, the poor can get most benefit of the growth and this way they will be able to exit the poverty. Of course, all of these could happen if there is strong commitment of the stakeholders in development, especially the government.
In relation to further study, as this study does not include further analysis on the sectoral contribution on GRDP, the results of this study is only general illustration of the required economic growth to halve poverty in Indonesia by 2015. Further study using desegregated data by sectoral contribution would be useful in analysing the contribution and therefore would be able to identify the sectors that are beneficial to the poor. Then further ahead, the policy implication would be designing pro poor growth policies by focusing on the sector that has large impact on poverty reduction.
REFERENCES
Badan Pusat Statistik (BPS), 2000, Statistical Pocketbook of Indonesia, BPS, Jakarta. Badan Pusat Statistik (BPS), 2007. Selected
Socio – Economic Indicators of Indonesia March. BPS, Jakarta.
Badan Pusat Statistik Papua, 2002. Papua in Figures 2002. Jayapura: BPS Papua. Besley, T., & Burgess, R., 2003. “Halving
Global Poverty”, Journal of Economic Perspectives, 17, 3, Summer 2003, 3-22. Bourguignon, F., 2000. The Pace of Economic
Growth and Poverty Reduction. Avalaible at:http://www.niplac.org/programs_lacea/ Bourguignon.pdf. Accessed on September 26, 2007.
Center for Southeast Asian Studies Northern Illinois University, 2008. Map of Indonesia. Avalaible at www.seasite. niu.edu, accessed January May 2008.
Dollar, D., & Kraay, A., 2002. “Growth is Good for the Poor”, Journal of Economic Growth, (7), 195-225.
Kuncoro, M., 2005. “Mampukah KAPET Mempercepat Pembangunan Kawasan Timur Indonesia?” [Does KAPET is Capable to Accelerate the Development in East Indonesia?] , Lintasan Ekonomi, 21, 1 Januari 2005.
Maksum, C., 2004. Development of Poverty Statistics in Indonesia: Some Notes on BPS Contributions in Poverty Alleviation. Avalaible at: http://www.nscb.gov.ph/ poverty/conference/papers/. Accesed on October 8, 2007.
Pasha, H., Palanivel, T., 2004. Pro-Poor
Growth and Policies: The Asian
Experience, UNDP.
Roemer, M., Gugerty, MK., 1997. “Does Economic Growth Reduce Poverty?”,
Suryahadi, A., Suryadarma, D., & Sumarto, S., 2006. Economic Growth and Poverty Reduction in Indonesia: The Effects of Location and Sectoral Components of Growth. Avalaible at: http://ideas.repec. org/p/eab/develo/692.html. Accesed on October 6. 2005.
United Nation Development Programme (UNDP), 2004. Indonesia: Progress Report on the Millennium Development
Goals. Avalaible at: http://www.undp. or.id. Accesed on September 27, 2005. United Nation Development Programme
(UNDP), 2004. Indonesia in Brief. Avalaible at: http://www.undp.or.id. Accesed on October 7, 2007.