Bakuteria genomu ni okeru senshokutai kozo kanren hairetsu no hikaku kaiseki
Bebas
135
0
0
Teks penuh
(2) ISBN. 978-4-87762-257-2. -SFC-DT2012-001. oCmparative Sequence with 2011年. Genomics Elements. Chromosome. of. Bacterial. Associated Structure. 度. 河野 暢明 政策・ メディア研究科 博士課程. 先 端 生命 科 学 プロジェクト. 慶應義 塾 大 学 湘 南 藤 沢 学 会.
(3) 推薦の ことば. ゲ ノ ムDNAは. 生 命 の 設 計 図 で あ る と 同 時 に 、 遺 伝 情 報 を次 世 代 へ 伝 え る媒 体 と して の 大. き な 役割 を担 っ て い る 。 しか し な が ら進 化 の過 程 に お い て この 媒 体 を維 持 す る た め の 物 理 構 造 的 な 制 約 に つ いて は 未 だ よ く解 明 され て い な い 。 本 論 文 は 、 生 体 内 機 構 に よ っ て 構 造 的 な 制 約 を 受 け て 来 た 遺 伝 情 報 の 媒 体 で あ るゲ ノ ム構 造 を 、 計 算 機 的 な ア プ ロー チ に よ っ て 解 析 した 、 極 め て 独 創 的 で 優 秀 な 博 士 論 文 で あ る。. 慶應義塾大学 環境情報学部教授 冨田. 勝.
(4) Comparative. Genomics. of Bacterial Sequence. Associated with Chromosome. Structure. Dissertation by Nobuaki Kono. Submitted. in partial fulfillment of the requirements. for. the degreeofDoctorof Philosophy in the Graduate Schoolof Media and Governance. Keio University Fujisawa, J apan February. 2012. Elements.
(5) Keio. University. n I. y S G 1858 IADIO. 04. Copyright © 2012 Nobuaki Kono All rights reserved.
(6) To my family..
(7) Abstract. The structural characteristics and properties that have been observed in various circular bacterial chromosomes have become increasingly clear based on the decipherment of the complete genome sequences of approximately three thousand bacteria. A consideration of chromosomestructure includes various symmetries at many scales, ranging from base composition to the gene strand bias, which are based on the replication origin and a terminal axis, and the supercoiling involved in the nucleoid structure. In this study, I focused on the chromosome structure and attempted to shed light on the mechanisms related to the formation and preservation of the chromosomes. First, I performed a comprehensiveprediction of replication termination sites based on sequence, and I determined that the sequence is widely conserved in almost all bacteria. Based on this result, I proposed a model of replication termination from the standpoint of bioinformatics. The use of this newlydefined symmetric structure made it possibleto investigate howstrongly symmetric structures have been maintained, and I analyzed the relationship between symmetric structures and insertion events. Furthermore, I found that the association of nucleoid binding sites with protein was controlled by cod onusage in the host bacterial genomes. Finally, I designed and implemented a versatile browser to facilitate the visualization of symmetric structures that cannot be fully captured by purely numeric information, allowingan intuitive grasp of these structures. Throughout this dissertation, I performed comprehensive analyses of the genomic functionality, characteristics, and structural evolution of bacterial chromosome, which serves as a medium of living systems. Based on these analyses, I discuss the means by which chromosomecomposition and structure have adapted to biological mechanisms in the course of evolution. Keywords: Bacterial circular chromosome, Genome replication, Genomic/chromosomal structure, Nucleoid, Bioinformatics, Comparative genomics.
(8) 論文題目. 「 バ クテ リア ゲ ノム にお け る染色体 構 造 関連配 列 の比較 解析 」. 論 文要 旨. ハ イス ルー プ ッ トな ゲ ノム解 読 技術 の発展 に よ り約3,000に も及 ぶバ クテ リアの コ ンプ リー トゲ ノムが解 読 され て きた近 年,多 種 多様 なバ クテ リァの環 状 染色体 に見 られ る構 造 の特 徴 とその性 質 が 明 らか にな って きた.染 色 体 上 に あ る構 造 に は,複 製 開始 ・終結 点 を軸 とす る塩 基組 成 か ら遺伝 子座 に至 るスケ ー ルで観 察 され る対称構 造 や, 核様 体 に関 わ る超 螺 旋形 成 な どが 知 られ て い る.そ こで 本研 究 で はバ クテ リァの持 つ環 状 染色 体 に お いて,こ れ ら染色 体構 造 に着 目 し,そ の誕 生 か ら維持 に関 す るメ カニ ズ ムの解 明 を行 うこ とを 目的 とした.ま ず 対 称構 造 の 起 点 とな る複 製終 結 関連 因 子 の網 羅 的 な予 測 を行 い,ほ ぼ すべ て のバ クテ リア で共 通 して保 存 され て い る こ とを 解 明 した.そ して この結 果 を元 に,計 算機 的 な ァ プロー チか ら複 製 終結 機構 モ デル の提 唱 を行 い,対 称構 造 の中 心 とな る複 製 開始 ・終 結 点 の定 義 を改 めて行 った.こ の様 に定 義 され た ゲ ノム の対 称構 造 を用 い る こ とで,対 称 構 造 と水平 伝播 との 関係 性 の解 析 が可 能 に なっ たた め,バ クテ リァが如 何 に これ まで染 色体 の構 造 を維 持 して き たか の観 察 を行 った.さ らに,核 様 体 関連 タ ンパ ク質 の結 合 部位 が ホス トバ クテ リアに よっ て コ ン トロー ル され てい る事 を解 明 した.ま た,こ れ まで 議論 されて きた配 列要 素や 対 称構 造 を視 覚 的 な理 解 に支 え られ た 直感 的な 着 想で 捉 え る事 を可 能 にす るた め,汎 用 的 な ブラ ウザ の設計 と実装 を行 った.本 学 位 論文 にお いて は,上 に挙 げ た多次 元 的 な アプ ロー チか ら得 られた 解析 結 果 を も とに,生 命 活動 が遺 伝 情報 の媒体 で あ る染 色体 へ 与 え る影 響 を議 論 す る. キ ー ワ ー ド:バ ク テ リァ 環 状 染 色 体,ゲ 較 ゲ ノ ム解 析. ノ ム複 製,ゲ. ノ ム ・染 色 体 構 造,核. 様 体,バ. イ オ イ ン フ ォ マ テ ィ ク ス,比.
(9) CONTENTS. 1. 2. Introduction. 1. 1.1. Definition of life ........................................... 2. 1.2. Exponential growth of biological knowledge ............................ 3. 1.3. Structures of bacterial chromosomes and genomes ......................... 5. 1.4. Organization ............................................. 7. Comprehensive. prediction. of chromosome. dimer resolution. sites in bacterial. 9. genomes. 2.1. Background .............................................. •. 2.2. Materials and Methods ........................................ •. 2.3. 2.2.1. Software and sequences ................................... 2.2.2. Iterated hidden Markov modeling ............................. 2.2.3. Calculation of the conservation quantity of dif sequences ................. Results ................................................ 2.3.1 Overview of dif sequence prediction ............................ 2.3.2. Prediction results of each phylum .............................. 2.3.3. Correlation of the dif sequence position and the GC skew shift-points ......... 2.4 Discussion .............................................. 10 11 11. •. 12 14. •. 15. •. 15. •. •. 15 19. •. 20.
(10) 2.5. 3. Conclusion ................................................27. Validation tions. replication. termination. 3.1. Introduction ................................................. 3.2. Materials. 3.3. Software. and sequences ...................................... 3.2.2. Selection. of bacteria. 3.2.3. Simulation. of GC skew formation ................................. 3.2.4. Replication. termination. and. simulation. of genomic. muta-. plasmids ................................ models .................................. Results ................................................... GC skew formation. 3.3.2. Construction. 3.3.3. Evaluation. 3.3.4. Simulations. simulation .................................. of three. replication. of the replication in species. The. relationship. 4.1. Introduction ................................................. 4.2. Materials. between. the. termination. termination. lacking. Discussion .................................................. 4.4. using. and Methods ........................................... 3.4. 4.3. models. 3.2.1. 3.3.1. 4. of bacterial. models ........................ fork-trap. symmetry. machinery ....................... of bacterial. Genome. sequences. 4.2.2. Dataset .................. 4.2.3. The. 4.2.4. Random. calculation. and software. . ... genomes. and. genomic. islands. 50 50. of asymmetries. 50. . ... deletions ............ 50 51. Results ...................... 4.3.1. Assessment. of the effects. 4.3.2. GEIs. base composition ...... 4.3.3. Improvement. affect. circular. 50. and Methods .............. 4.2.1. models ...................... rates. of GEIs. from GEIs. ... 51 51. deletion. 51 55. Discussion ..................... il.
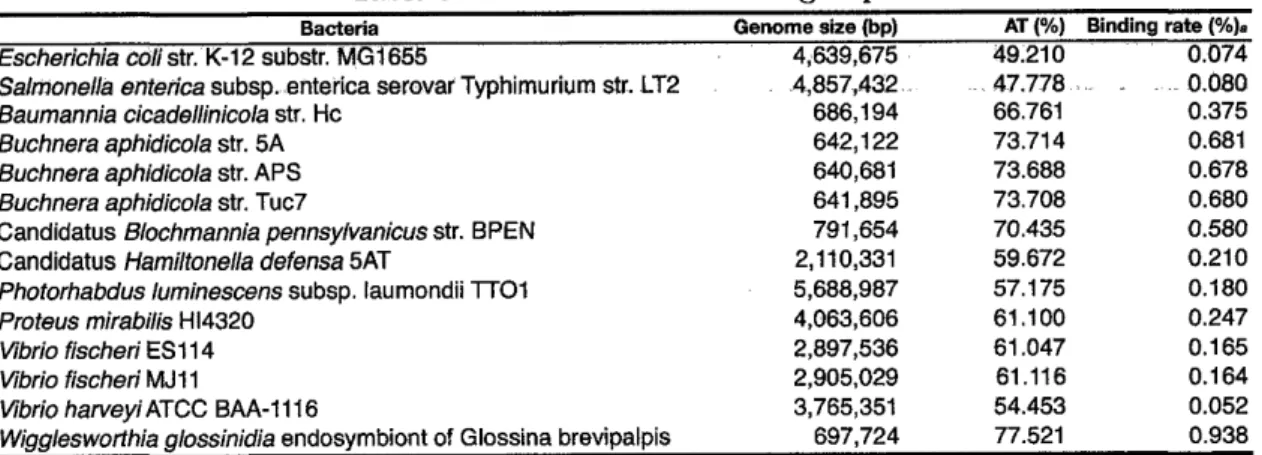
(11) 5. Cod on usage is a selection. pressure. for the H-NS binding. 56. sites. 5.1. Introduction ........................................ 57. 5.2. Materials and Methods .................................. 57. 5.2.1. Software and genome sequences ......................... 5.2.2. Discovering motifs and prediction of binding sites from ChIP data. 5.2.3. The cod on usages among horizontally-acquired genes and core genes . . .. 5.2.4. The binding ratio in each region ........................ 5.2.5. Phylogenetic analysis ............................... . . ... 59 59 59. •. 5.3.2. The motif conservation in related bacteria ................... 5.3.3. Index to recognize the binding target ...................... 59. •. 59 •. Discussion ......................................... Pathway 6.1. 58. •. •. 5.3.1 Discovering H-NS targeting motifs ....................... 6. 58. •. •. 5.3 Results ........................................... 5.4. 57. •. Projector:. Web-based. Zoomable. •. Browser. 73 73. 6.1.1 Individual pathway map ............................. 6.2. 76. Integrated pathway map ............................. Materials and Methods .................................. 76. 6.2.1. 76. Requirement analysis .............................. 6.3 Implementation ...................................... •. 77 77. 6.3.1 Pathway map ................................... 6.4. 61. 72. using Google Maps API. Introduction ........................................ 6.1.2. 60. 6.3.2. Search and data retrieval ............................ 78. 6.3.3. Mapping and editing ............................... 78. Results and Discussion ................................. 6.4.1. Requirement analysis .............................. 6.4.2. System overview ................................. 6.4.3. Search and retrieval ............................... •. •. •. •. 78 78 80 83.
(12) 6.4.4. 7. Pathway. mapping. of experimental. data. . . .. 83 87. 6.5. Chromosome. map .................... 6.6. Limitations ........................ 89. 6.7. Conclusion ........................ 89. 90. Conclusions 7.1. The role of scientific structural. visualization ........... aspects. of bacterial. 91. 7.2. Chromosome. evolution. 7.3. Biological. validations ................... 92. 7.4. Concluding. remarks ................... 94. Bibliography. 92. 95. iv.
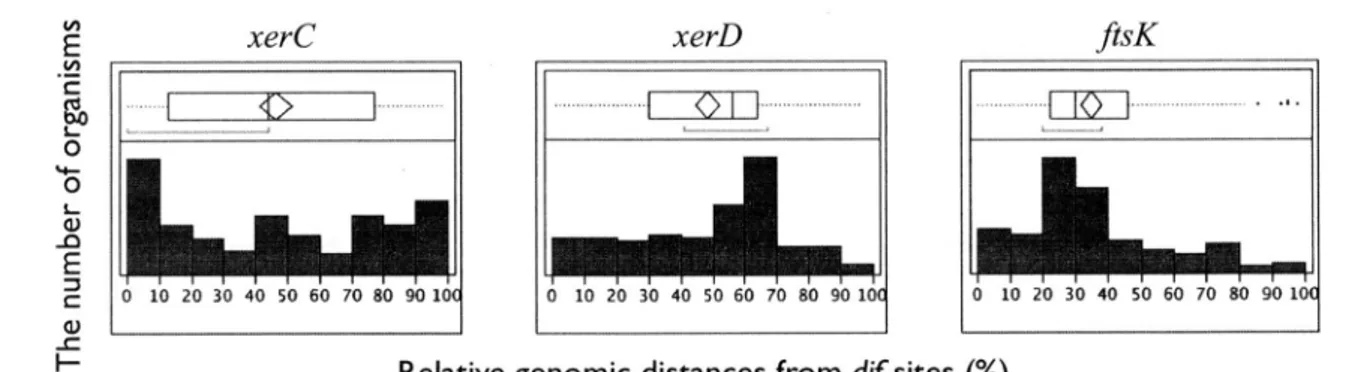
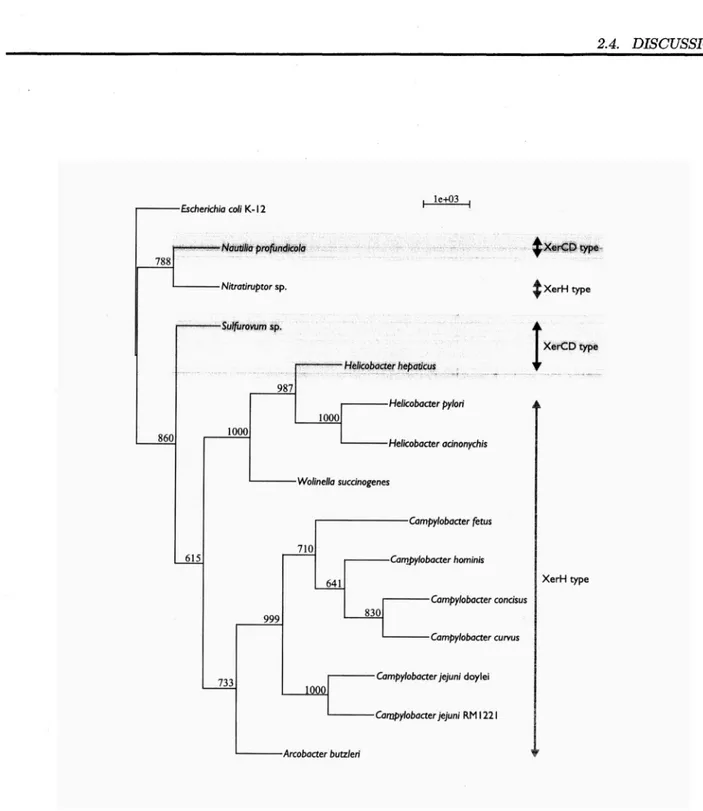
(13) LIST. role. OF. 1.1. The. 1.2. Symmetric/asymmetric. 2.1. Prediction. 2.2. The phylogenetic. 2.3. An example. 2.4. Distribution of the genomic distances dif sites. ................................................. FIGURES. of visualization........................................ 4. structure.................................. 6. strategy. ......................................... distance. of XerCD. 13. in each organism. ................... for the plot shown in Figure. between. 2.2. ......................... 20. The relationship. dif sites and GC skew. ....................... 2.6. The difference. 2.7. Phylogenetic tree based on rRNA for the comparison genomes. ................................................. dif and GC skew shift-point. 2.8. The conservation. 2.9. Variance. 3.1. Scheme of GC skew reconstruction. 3.2. Example. 3.3. Probabilistic. 3.4. Examples. positions................ distribution................................ of GC skew reconstruction. 22. 25 26 28. simulation. ........................ 32. simulation.................... 36. error rates....................................... of simulated. 21. of XerCD- and XerH-containing. of dif sequences.................................. of GC content. 17. of xerC, xerD and ftsK gene from predicted. 2.5. between. 15. GC skew. ................................ v. 37 39.
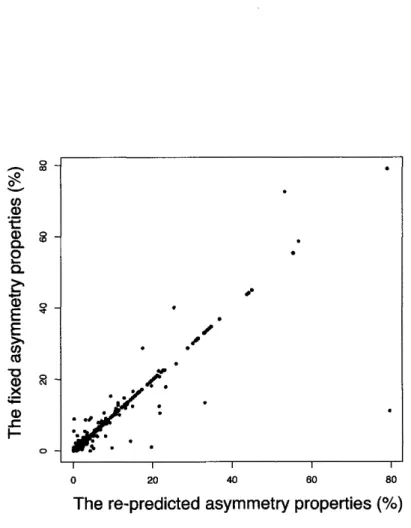
(14) 3.5. Comparison. of RMSE. 3.6. Heat. 3.7. Boxplot. of RMSE. of all. 3.8. Boxplot. of RMSE. of simulated. 3.9. Validation. map. scores. of RMSE. in four. scores. for probabilistic. simulated. of simulations. models. ..........................40 model. .............41. models. ...........................42 models. using. combination. only. in Firmicutes. ....................42 the. third. cod on. positions. and. non-coding. se-. quences. .................................................44. 4.1. Bacterial. asymmetries.........................................49. 4.2. The. 4.3. The correlation of between the asymmetries origins and termini...........................................53. 4.4. Improvement. 5.1. Sequence. 5.2. Synonymous. 5.3. Average. 5.4. The. average. of synonymous. 5.5. The. number. of H-NS. 5.6. The. frequency. 5.7. Binding. 5.8. Phylogenetic. 5.9. Alignment. 6.1. Output. 6.2. Reference. 6.3. User. interface. .............................................84. 6.4. Data. mapping. .............................................85. 6.5. Manual. 6.6. Chromosome. extent. of change. in asymmetry. rates. logo. in three. of H-NS cod on. tribasic. bind. usage. motif. rates. in several. size. ....................52. of the. re-predicted. of H-NS. example. motif. cod on. .......................64. usages................................65 usage. in 113. bacteria...................66. sites. ................................67. genes. ...............................69. editing. in dissimilar. group..........................71. of MEGU......................................75. pathway. and map. map. .......................................81. annotation. replication. 63. tree............................................70 result. fixed. sites................................... sites. ...................................68 type. and. 54. cod on. binding. genome. cases................................... of tribasic. cod on. of binding. with. of pathway. viewer.......................................88. vi. maps........................86.
(15) ●. ●. ●. ●. ●. ●. ●. O. ●. ●. ●. ●. ●. ●. ●. ●. ●. ■. ●. ●. ●. ●. ●. ■. ●. ●. vii. O. ●. O. ●. ●. map... ●. dif sites in a chromosome. ●. 7.1. 91.
(16) LIST. 2.1. Prediction. result. 5.1. List. dissimilar. 6.1. Comparison requirement. of the. OF TABLES. overview. .....................................16. group......................................60. of existing pathway-related analysis..........................................82. software. viii. and. databases. according. to. the.
(17) LIST. AIMS AJAX Ala B. subtilis CAI CDR ChIP E. coll F. alni GCSI GEIs H-NS HGT HMM KOPS Lew NAP Pro RMSE SOAP SVG Ser Val ZUI bp ssDNA tAI. OF ABBREVIATIO\S. Architecture-imparting sequences Asynchronous JavaScript + XML Alanine Bacillus subtilis Cod on Adaptation Index Chromosome dimer resolution Chromatin immunoprecipitation Escherichia coll Franlcia alni GC skew index Genomic islands Histone-like nucleoid structuring protein Horizontal gene transfer Hidden Markov model FtsK-orienting polar sequences Leucine Nucleoid-associated protein praline Root mean square error Simple Object Access Protocol Scalable Vector Graphics Seline Valine Zoomable user interface base pair single strand DNA tRNA Adaptation Index. lx.
(18) Acknowledgments First, I sincerely wish to express my great appreciation to Professor Masaru Tomita and Assistant Professor Kazuharu Arakawa. Professor Masaru Tomita, who provided an excellent entree to the beginning of life as a scientist and have always given me a great deal of freedom. Therefore, I was always able to conduct studies freely, and I came to think of science as the ultimate game. Assistant Professor Kazuharu Arakawa has not only been an adviser who gives valuable advice to me throughout my studies but has also become my role model as a scientist. My existence has centered around him, and I have adopted his scientific philosophy as my own. I owe a very important debt to the members of my dissertation committee, Professor Mitsuhiro Itaya, Associate Professor Yasuhiro Naito, Professor Akio Kanai, and Professor Tomoyoshi Saga, for their extremely helpful and scintillating comments regarding this dissertation. I also wish to express my gratitude to a number of respected people: Assistant Professor Rintaro Saito (University of California, USA), Dr. Yoshiaki Ohashi (Human Metabolome TechnologiesInc., Japan), Project Research Associate Katsuyuki Yugi, Assistant Professor Hitomi Sano-Itoh, Dr. Ayako Yachie-Kinoshita,Dr. NozomuYachie,Dr. YoshihiroToya, Dr. Kosuke Fujishima, Dr. Koshi Imami, Vincent Piras, Yoshiteru Negishi, Mikiko Hattori, Dr. Yuka Iwasaki-Watanabe, Dr. YukinoOgawa, Hikaru Taniguchi, Kousaku Shinoda, Dr. Junichi Sugahara, Motomu Matsui, Taiko Nishino, Chikako Arakawa-Oki,Saeka Tani, and Shinya Murata. I will never forget the wonderful time I spent with these individuals. I appreciate the cheerful days spent with several members of the Institute for Advanced Biosciences, Keio University during the seven years of my studies. Kahori Takane, Atsuko Shinhara, Kaoru Sugahara-Kikuta, Kentaro Hayashi, Haruna Imamura, Miho Tanaka, Keisuke Marita, Daiki Yamada, Seiya Fujimoto, Kazuki Oshita, Shinnosuke Murakami, Fujitaka Baba, Keiko lino, Takayuki Ebi, Mana Ogawa-Nakagawa, Yuriko Hasebe, Hitoshi Iuchi, Keisuke Wada, Mizuki Sata, Hanae Shimo, Yuka Hirose, Chikako Okubo, Shiori Komine, Seiko Nakatsuka, Tamami Toki, Jun Yamakubo, Gembu Maryu, Karyn Kawamoto, Kyoko Ishino, Taiyo Miyahara, Hidetoshi Itaya, and Shiori Hashimoto have served as tremendous emotional supports to me, and I am deeply grateful to each one of them. In particular, Kiyofumi Hamashima, Toshinori Tsuboi, Keita Ikegami, Tadasu Nozaki, Yuki Shindo and Norikazu Saiki have provided a stimulus-rich environment and witty conversations, friendships and meaningful discussions with them have been essential for my personal growth during my college life. My deepest appreciation goes to my peers, Ryu Ogawa, Satoshi Tamaki, Hiroyuki Nakamura, Ayaka Hiroe, Tsuyoshi Akuzawa, Hiroaki Suzumura, Maria Iga-Takeuchi, Mia Iwasaki, Akihito Kawasaki, Daiki Nakatsu, and Ryoji Yanashima, who entered the Graduate School of Media and Governance, Keio University, at the same time that I did, and who provided very precious experiences. We have talked about the future, science and life and passed the days happily. Mere words could never express my gratitude, yet I will try to explain how grateful I am for everything that they have done. I would like to express special thanks to several dear and irreplaceable people. Marika Nakai has contributed to my progress with a dedicated and thoughtful heart and has always emotionally supported and encouraged me throughout my doctoral program. Satoru Nishida and Shingo Iwata have been very understanding and close friends throughout all my college years, and they have supported me with their love and good humor. Finally, but most importantly, Kimie Kono. They have made gratitude. for their. genuine. love.. I would like to offer warm thanks to my dearest parents, Tetsuaki innumerable contributions to my well being throughout my life, and Their. thoughtfulness. and kindness. x. will always. be remembered.. Kono and I feel deep.
(19) CHAPTER. 1. Introduction. "Omnis. cellula. e cellula. .". -Rudolf. Virchow.
(20) 1.1.. 1.1. Definition. DEFINITION. OF LIFE. of life. answer but also the following answers for theproposition `definition'that and `recognition' life.aIs a symbiont What islife? This question isabiological classical andpractical requires notofonly philosophical. alive? Is a virus alive? Moreover,are cells or biomoleculesalive? The definition of life is an essential challenge in life science and serves as a fundamental pillar for the recognition of life. However,there is still no broadly accepted definition of life (Chyba and McDonald 1995). In 1944, the Nobel laureate and physicist Erwin Schrodinger wrote a book with this title, `What is Life?', and attempted to define life through physics and chemistry. In the famous chapter entitled `Order, disorder and entropy', he made the following statement about living organisms: "What an organismfeeds upon is negative entropy. Or, to put it less paradoxically, the essential thing in metabolism is that the organism succeedsin freeing itself from all the entropy it cannot help producing while alive.". He suggested that energy exchange, known as metabolism, in the living organism is important for avoiding decay (Schrodinger 1944). Another famous definition of life, which has been accepted within the origins-of-lifecommunity, is the `chemicalDarwinian' definition. The Darwinian definition states that "Life is a self-sustained chemicalsystem capable of undergoingDarwinian evolution" (Joyce 1994). Living things should be able to reproduce and evolve through natural selection. In addition to these two definitions, as discussed above, many other definitions of life have been proposed. Although Palyi et al. (Palyi et al. 2002) and papa (papa 2004) listed approximately 100 different definitions that have been proposed over many years, some of these lists have been refined to small categories using two approaches (Malaterre 2010). One approach lists the elements of a sufficient or necessary system for a living organism. Examples include dynamic low entropy systems (von Bertalanffy 1968), a hierarchical organization of open systems (Prigogine 1980;Prigogine and Stengers 1984), and an unformalizable or non-computational system; this approach is referred to `the listbased definition'. According to this approach, de Duve and Koshland propounded the followingseven pillars as the principle items for the definition of life: (1) program (DNA: deoxyribonucleic acid), (2) improvisation (response to environment), (3) compartmentalization, (4) energy, (5) regeneration, (6) adaptability, and (7) seclusion (chemicalcontrol and selectivity); these are abbreviated as PICERAS (de Duve 1991;Koshland 2002). The second approach defines life based on a model that describes the functions of living systems (Maturana and Varela 1980; Ganti 2003). Ruiz-Mirazo and coworkersascribed an autonomous system with open-ended evolutionary capacities to a living model and propounded that this system must have four properties: a semipermeable boundary (a membrane), an energy transduction or conversionapparatus (a set of energy currencies), and two types of interdependent macromolecular components, some of which perform and directly coordinate self-construction processes (catalysts), while others store and transmit information (records) (Ruiz-Mirazo et al. 2004). Given these definitionsof life from various perspectives, it would appear difficult to discover common traits to re definelife clearly. However,when I observe such definitionsat the molecularlevel, the genome actually underlies life, and the chromosome, which is the medium for the genome, meets an important requirement of life. For example, enzymes or proteins that are involved in energy transduction or compartmentalization, which are related to the self-construction process, are encoded by the genome as genes. Evolution, adaptation, or response to stimuli begins with mutations that occur within the protein coding regions or structures of the genome. Furthermore, all of these events occur on the chromosome, which is the medium for the genome. Heredity, growth, regeneration, and recording are performed by the replication system of the chromosome. This suggestion that the genome underlies life can also be observed in the context of the central dogma. The central dogma is a concept of molecular biological systems in living organism that was proposed in 1958 by Nobel laureate and molecular biologist Francis Crick (Crick 1958; Crick 1970), one of the co-discoverersof the structure of DNA in 1958 (Watson and Crick 1953). This dogma asserts that genetic information is transferred from DNA to RNA to proteins through several processes. These processesare `DNAreplication' (DNA to DNA), `transcription' (DNA to RNA) , and `translation' (protein production). DNA replication produces a copy of the original genome to transmit the information in the chromosome. According to this flow, the process of DNA replication, which is associated with the chromosome, plays a primary role for passing the genetic information on to the subsequent generations. Consequently,the chromosomehas a major responsibility as the medium for 2.
(21) 1.2.. EXPONENTIAL. GROWTH. the effective transmission of hereditary information to future generations of life. In other words, an understanding of the chromosome is necessary and this recognition leads to another aspect of `What is life?'.. 1.2. Exponential. growth. of biological. OF BIOLOGICAL. KNOWLEDGE. and is dense with the fundamentals for the primordial recognition of life,. knowledge. Because the chromosomehas a major responsibility as the medium of the genome, it is thought that evolutionary footprints are still evident in chromosomal structure. To observe the traces of evolution, genome sequencing is an essential step in molecular biology. More than a decade has passed since the first complete bacterial genome sequences, Haemophilus inflnenzae and Mycoplasma genitalium, were reported (Fleischmann et al. 1995; Fraser et al. 1995), and with the completion of the human genome in 2001 (Venter et al. 2001), genome sequencing technologies achieved a remarkable development. Parallel sequencing technology, which is referred to as `next-generation sequencing', has contributed to the generation of unprecedented levels of data from complete genome sequences by rapidly decreasing sequencing costs and raising efficiency.Such sequencers have many kinds of platforms, such as the Roche GS-FLX 454 Genome Sequencer, the Illumina HiSeq 2000, the ABI SOLiD analyzer, the Ion Torrent Personal Genome Machine (PGM), and the Helices HeliScope. Each platform uses various schemes: pyrosequencing,sequencing by DNA synthesis, oligonucleotideligation, among other exemplary approaches. The read length or aptitude for de novoor re-sequencingdepends on the platform (see review: Metzker 2010). According to the information released by the Genomes Online Database (GOLD; Pagani et al. 2011), as of January 2012, there were 12,260 genome projects, including 3,046 complete genome projects, and the number of projects has nearly doubled over the past two years (Liolios et al. 2010). In particular, the number of bacterial genome sequence projects has reached approximately 9,000. The rapid growth of materials has been expected to accelerate the biosciencefield, and a bioinformatics approach is required to process these data. When researchers extract valuable knowledgeor examine a large quantity of information, the computational approach is an essential process. Currently, various bioinformatics applications and databases have been provided to manipulate biologicaldata (Wieser et al. 2011; Galperin and FernandezSuarez 2012). Additionally, the field of scientificvisualization has been an integral part of the biosciencesand has also been an indispensable approach to heuristically comprehend and instinctively understand large-scale data in molecular biology (Figure 1.1). A large number of tools have been developed for information visualization and have contributed to the recognition of biologicalinformation, including biomolecular structures, expression profiles, genome annotation and sequence alignments, molecular pathways, ontology,taxonomy and phylogeny (Tao et al. 2004).. 3.
(22) 1.2.. EXPONENTIAL. GROWTH. OF BIOLOGICAL. KNOWLEDGE. 'come sequence. °. data. eldoI,Ph. 1. Organism Po. Figure .1.1: The The genome sequences are obtained from organisms, and the or protein binding sites, are detected from genome sequences. the illustrated chromosome map enables an understanding of. role of visualization. numeric position data of sequence elements, e.g. dif sites, Ter sites, The visualization of such positional information by mapping it onto the positional relationships.. 4.
(23) 1.3.. 1.3. Structures. STR UCT URES. of bacterial. OF BACTERIAL. chromosomes. and. CHROMOSOMES. AND. GENOMES. genomes. In the investigation or research of the basic principles of the chromosome, the eubacteria are recognized as superior model organism because almost all eubacteria have only a single circular chromosome, one copy of each chromosome, and a small genome. Furthermore, as indicated above, there are over 2,728 publicly available bacterial genome sequences because complete genome sequencing, assembly,and annotation can be performed in less than 24 hours (Flicek and Birney 2009;Reeves et al. 2009). According to the accumulation of knowledge of bacterial genome sequences, the structural features in chromosomeas the media of genetic information have come to be known. The nucleotide composition of genome made up of the nucleotides ATGC conforms to the Chargaff's first parity rule (A : T and G C, Chargaff 1951). Interestingly enough, Chargaff also stated that this parity can apply within a single strand DNA, known as the Chargaff's second parity rule (Rudner et al. 1968). Sueoka further theorized and reported that the infra-strand parity rule is expected to hold under no strand bias conditions. If the mutation rates are similar between the two strands, these mutations counteract the effect of the selections (Sueoka 1995). However,violations of the parity rule are universally observed in local regionof genomicsequences. The most striking sets of compositional asymmetries exist throughout the genome, generated by biologicalmechanisms associated with DNA replication. In particular, it is wellknown that various symmetric or asymmetric structures for bacterial circular chromosomesare maintained (Figure 1.2). For typical chromosomestructures, there are three types of bias: gene strand bias, oligonucleotidebias, and compositional strand bias (Rocha 2004; Rocha 2008). Gene strand bias is an example of an asymmetric structure. The distributions of bacterial genes are different between the leading and lagging strands. Approximately 78% of genes are in the leading strand. in Firmicutes bacteria or Mycoplasma(Fraser et al. 1995; Kunst et al. 1997; Rocha 2002), and 85% of ribosomal protein genes or high-expressiongenes are coded in the leading strand in Bacillus subtilis and Escherichia coll (McLean et al. 1998). A typical example of a symmetric structure is oligonucleotidebias. There are many recombination- or replication-associated sequences in the chromosome, e.g. architecture-imparting sequences (AIMS; Hendrickson and Lawrence 2006) or Ter sequences. In E. coll, Tus protein binds to the Ter sites to forms a barrier called a fork-trap (Horiuchi et al. 1995;Labib and Hodgson 2007), and acts as an antihelicase and allowsforks to enter but not exit the terminus region (Hill et al. 1987; Hill 1992). As a result, this complex makes the replication fork stall at the Ter site (Kamada et al. 1996;Wake and King 1997). In order to terminate the replication efficiently,most Ter sites are located in the terminus half of the genome (Neylon et al. 2005; Mulcair et al. 2006). The recombination-related Chi sequence (Schultz et al. 1981;Kuzminov 1995), which is a recombinational hot spot, is the third most abundant oligomerin the leading strand (Blattner et al. 1997). During replication, when a recombination event occurs an odd number of times, the replicated chromosomeis not properly segregated into two daughter chromosomesbut instead produces a concatenated dimer (Sherratt 2003; Lesterlin et al. 2004). Therefore, many bacteria harbor highly conserved chromosomedimer resolution (CDR) machinery to separate the dimer chromosomeinto two monomer daughter chromosomes. In E. coll, chromosomedimers are resolved by two tyrosine recombinases, XerC and XerD, by the addition of a crossoverat a specific 28 bp sequence called the dif site, which is located in the replication termination region of the chromosome (Clerget 1991; Blakely et al. 1993). The reaction is coordinated to the last stages of cell division by an essential cell division protein, FtsK, which functions as a septum-located DNA translocase (Sterner et al. 1999; Bar re et al. 2000; Bigot et al. 2004; Kennedy et al. 2008; Dubarry and Bar re2010). FtsK movesalong the chromosomeunidirectionally towards the dif sequence, thanks to polar and oriented sequences, the KOPS (FtsK-orienting polar sequences;Saleh et al. 2004; Bigot et al. 2005; Bigot et al. 2006). The density of KOPS is higher in the leading strand, with their distribution biased toward the replication terminus (Bigot et al. 2005; Levy et al. 2005; Bigot et al. 2006), and KOPS are symmetrically conserved in the two replichores with the same frequencies (Mrazek and Katlin 1998; Salzberg et al. 1998). The most notable feature of the asymmetric structure, which is provided by the replication symmetry, is the nucleotide compositional strand bias, an excess of G over C in the leading strand, known as the GC skew (Lobry lgg6a; Rocha et al. 2006). Although the localization of GC content can also be observed in eukaryotic organisms as an isochore (Bernardi 1989; Bernardi 1995), it is not as biased as the bacterial GC skew. Although the details 5.
(24) 1.3.. STRUCTURES. OF BACTERIAL. CHROMOSOMES. AND. GENOMES. of the GC skew are described briefly in later chapter, when DNA is replicated according to the direction of the polymerase, the leading strand is synthesized continuously,but the lagging strand is synthesized discontinuously. As a result, the leading strand has a longer single strand time than the lagging strand, and this difference in replication mechanism provides a bias toward G and C bases (Coulondre et al. 1978; Lobry lgg6a Re yes et al. 1998;Lobry and Sueoka 2002; Mackiewiczet al. 2003). These symmetric or asymmetric structures depend on the balance of replication arms because a pair of a replication origin and terminus defines the leading and lagging strands. on. Oligonucleotide. bias). Gene. Figure 1.2: Symmetric/asymmetric. strand. bias. structure.. The blue line represents a leading strand, and the yellow line represents a lagging strand. In almost all bacteria, the circular chromosome is symmetrical about the replication origin and terminus (gray box) and oligonucleotide bias (black arrow icons) and is asymmetrical about the compositional strand bias (green lines) and gene strand bias (blue and yellow arrows).. The bacterial replication mechanism consists of 3 steps: initiation, elongation, and termination. Although similar to eukaryotes, the mechanisms differ at several points (Rudolph et al. 2010). In eukaryotic cells, the initiation of replication occurs at multiple replication origins per chromosome, and the frequency is tightly regulated to exactly once per cell cycle (Diffiey 2004). The cell cycle can be divided in GO (a quiescent stage of cell), GI (DNA synthesis), S (DNA replication), G2 (cell growth), and M phases (mitosis), and almost all eukaryotic cells progress through these phases. The replication complex is assembled before entry into S phase (Diffley2004; DePamphilis et al. 2006). In S phase, the replication forks move bl-directionally from the origins until they encounter other forks originating from neighbor origins (Edenberg and Huberman 1975). The replication termination sites appear randomly within a 4 kb zonebetween the replication origins (Greenfeder and Newton 1992;Zhu et al. 1992). By contrast, the initiation of bacterial replication occurs at a single replication origin. The replication of the chromosome proceeds bl-directionally from the origin to the terminus (Prescott and Kuempel 1972; Hirose et al. 1983; Schaper and Messer 1995; Schaeffer et al. 2005). While bacterial 6.
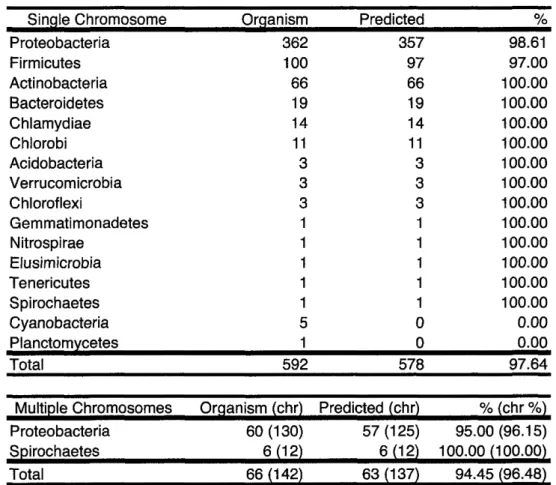
(25) 1.4.. ORGANIZATION. replication is also regulated once per cell cycle (Nielsen and Lobner-Olesen2008), there is a high frequency of replication, which permits bacterial cells to grow more rapidly than eukaryotic cells and is also responsible for the difference in cell sizes. For instance, E. coll cells can over-replicate prior to the completion of the previous replication, resulting in a generation time (20 min.) that is half of the normal replication time (Simmons et al. 2004; Haeusser and Levin 2008). Furthermore, there is not only structure at the sequence level but also topological structure in the bacterial chromosome. Although bacteria do not have nuclei and the size of the chromosomeis smaller than the eukaryotic chromosome, bacterial chromosomesare packaged into a nucleoid structure. The nucleoid is organized by the actions of supercoilingRNA and NAPs, which regulate DNA topology (Dame 2005). In gram-negative bacteria, at least 12 distinct types of nucleoid-associatedproteins have been reported, and each type has its own DNAbinding preferences (Azam and Ishihama 1999).. 1.4. Organization. As described thus far, a myriad of mutational and selectional pressures affects the structures of bacterial genomes according to their requirements to be effective vehicles of genetic information. In this dissertation, therefore, I show how such structures in bacterial circular chromosomes have evolved, and how the acquired symmetries in genomes are maintained, through a series of comprehensive computational analyses. Firstly, in order to clearly define the regions of symmetry, I have comprehensively predicted the chromosome dimer resolution site dif, using a novel phylogenetic pattern finding approach. Based on this information, I have then conducted computer simulations to test the quantitative contribution rates of different evolutionary pressures that have shaped the characteristic genome structure. Secondly, I have tested intrinsic and extrinsic causes that may disrupt the evolutionary structured symmetry in the genomes, and how the genome maintains its order despite the existence of disorders. Specifically, I discuss the evolutionary traces of the maintenance of genomic symmetry in light of numerous horizontal gene transfer events, and the intrinsic mechanism of the genome to protect itself using topological chromosome structure with the control of nucleoids. Lastly, I present a sophisticated software system for the visualization of these numerous evolutionary pressures and structural elements within the genomes, in order to aid the intuitive understanding of such systematic and complex phenomenon.. The bacterial chromosomehas a wide variety of structures. Although these structural phenomena have been thoroughly observed, it has not been confirmed how these structures are formed or how bacteria maintain and develop these structures. Therefore, I used computational genomics approaches to address these questions by focusingon the sequenceelements in bacterial chromosomes.This dissertation comprises7 chapters, including an introduction section (here, Chapter 1). I developed a comprehensiveprediction method for a chromosomedimer resolution site, known as dif, in silica using a phylogeneticprediction approach based on iterated hidden Markov modeling (Chapter 2). During the replication process in bacteria with circular chromosomes, an odd number of homologous recombination events results in concatenated dimer chromosomesthat cannot be partitioned into daughter cells. However,the dif sequence has only been identified in a few bacteria. Additionally, the dif sequence is suggested to occur at a site other than the dif site. Accordingly,I aimed to obtain the sequences comprehensively and predict the dif sequences. Using this phylogenetic approach, dif sites were identified in 641 organisms among 16 phyla, with a 97.64% identification rate for single-chromosomestrains. The dif sequence positions were shown to be strongly correlated with the GC skew shift-point that is induced by replication-associated mutation/selection pressure, but the difference in the positions of the predicted dif sites and the GC skew shift-points did not correlate with the degree of replication-associated mutation/selection pressure. This comprehensive identification of unique dif candidates can provide materials to elucidate the appropriate machinery for replication termination (Kono et al. 2011). Using these predicted dif sequences, in the next chapter, I validated the bacterial replication termination models using a computational simulation of 7.
(26) 1.4.. ORGANIZATION. genomic mutations in terms of the compositional strand bias and suggested an appropriate model (Chapter 3). In bacterial circular chromosomes,replication is known to be terminated when any of the followingoccurs: the forks progressing in opposite directions meet at the distal end of the chromosome, the replication forks become trapped by Tus proteins bound to Ter sites, or the termination occurs at a single definite site, dif. To understand this difference between the known replication machinery and the genomic compositional bias, I undertook a simulation study of genomic mutations and reported here how different replication termination models contribute to the generation of replication-related genomic compositional asymmetry. This study could confirmhow chromosomestructures are formed and how the determination of the replication termination point enables the definition of a symmetric or asymmetric median line in the circular chromosome. From these insights, the symmetry of the circular chromosomewas defined. Then, to investigate how the defined symmetric chromosomestructure has been maintained, I considered computationally whether the symmetry of the bacterial circular chromosomeis disrupted by genomicislands (Chapter 4). The term symmetric chromosomehere means the compositional strand bias, known as the GC skew. The GC skew is widely used as an in silica method for the prediction of the replication origin and terminus (Frank and Lobry 2000; warning et al. 2006). However, the strength of the GC skew is extremely variable. Some bacteria have only weak biases (Zhang et al. 2003; warning et al. 2006; Arakawa et al. 2ooga), and there are many bacteria that have an imbalance in GC skew. Therefore, I hypothesized that the balance of the GC skew may be affected by mutations in the genome. Among mutations, genomicislands are considered to have the possibility to change the base composition on a large scale. Genomic islands are large foreign regions of approximately 10 Kbp to 1 Mbp in the bacterial genome (Rocha 2008), which were most likely acquired by horizontal gene transfer (HGT; Gogarten and Townsend 2005; Juhas et al. 2009). In Chapter 4, I compared the symmetric structures of natural genomes and artificial genomes in which the genomicislands were deleted computationally and investigated the disruption effects and the strength of the GC skew. In Chapter 5, I extended the analysis to the macroscopic level and observed the side effects of the nucleoid, which physicallycontrols the bacterial chromosomeupon an acquisition of new function (Chapter 5) . H-NS, known as the nucleoid-associatedprotein, changes the topology of DNA and acts as a transcriptional regulator for the silencingof horizontally acquired genes. Although this transcriptional regulation is well studied, no definitive reason has been provided for the evolution of this function. In this chapter, I investigated codons in the motifs of H-NS binding regions and found that these codons were used more often in horizontally acquired genes than in other regions. Furthermore, they were infrequently used in highly expressed and essential genes. Accordingly,it is likely that the immune-likerole of H-NS developed as a by product,to prevent the disruption of the bacterial life cycle. Finally I developed a web-based browser for molecular biology with a zoomable user interface (Chapter 6). An understanding of the positional relationships between gene directions, oligonucleotide sequence sites, base compositional biases, foreign regions, protein binding sites and replication origins and termini are important for understanding bacterial chromosomestructures. Although the localization of genes or positions of some sequence elements are known numerically for one organism, such numeric does not necessarily lead to instinctive recognitions. Therefore, I implemented a viewerwith a design such that each genomicelement is mapped on a circular chromosome map to gain an instinctive understanding and inspiration for subsequent investigations. This system was developed as an additional function of MEGU (Kono et al. 2006) and Pathway Projector (Kono et al. 2009). The Pathway Projector is a biochemicalpathway browser and was implemented based on the requirements for a versatile browser: (1) comprehensivesearch features and data access; (2) data mapping and the ability to edit and annotate maps; (3) an intuitive user experience without the requirement for installation and regular maintenance. I took advantage of the versatility of the Pathway Projector to add the circular chromosomemaps. The circular map enabled the visual observation of living organisms from multiple viewpoints. In Chapter 7, I provided a brief summary of the analyses and perspectives derived from the studies described in this dissertation in the concluding chapter. Throughout this dissertation, I performed comprehensive analyses of the genomic functionality, and evolution of bacterial chromosome structure which serves as a medium of living systems, to discuss how the chromosome composition and structures adapted to biological mechanism evolution.. 8. characteristics, and would like in the course of.
(27) CHAPTER. Comrehensive p chromosome. prediction. dimer. distance. of. resolution. bacterial. "We can only see a short. 2. sites. in. genomes. ahead. , but we can see plenty. there. that needs. to be. done.". -Alan. Turing. `Computing. Machinery. and Intelligence'.
(28) 2.1.. 2.1. BACKGROUND. Background. InWhen bacteria, such areplication recombination fork arrest event occurs ismainly an odd repaired number byhomologous of times in one recombination DNA replication (Michel event etofal.circular 2004). chromosomes,the replicated chromosomeis not properly segregated into two daughter chromosomesbut instead produces a concatenated dimer (Sherratt 2003;Lesterlin et al. 2004). Therefore, many bacteria harbor highly conservedchromosomedimer resolution (CDR) machinery to separate the dimer chromosomeinto two monomer daughter chromosomes. In Escherichia coll, chromosome dimers are resolved by two tyrosine recombinases, XerC and XerD, by the addition of a crossover at a specific 28 bp sequence called the dif site, which is located in the replication termination region of the chromosome (Clerget 1991; Blakely et al. 1993). The dif sequence contains a pair of palindromic sequence motifs that correspond to the binding domains of XerC and XerD. The reaction is coordinated to the last stages of cell division by an essential cell division protein, FtsK, which functions as a septum-located DNA translocase (Sterner et al. 1999;Bar re et al. 2000; Bigot et al. 2004; Kennedy et al. 2008; Dubarry and Bar re2010). FtsK moves along the chromosomeunidirectionally towards the dif sequence, thanks to polar and oriented sequences, the KOPS (Saleh et al. 2004; Bigot et al. 2005; Bigot et al. 2006). CDR is initiated when FtsK reaches dif and its extreme C-terminal domain directly interacts with the C-terminal domain of XerD (Aussel et al. 2002;Yates et al. 2003;Massey et al. 2004; Yates et al. 2006;Borne et al. 2009). The dif/XerCD chromosome dimer resolution system seems widely conserved. In vive experimental evidence for its conservation has been obtained in Xanthomonas campestris, Caulobacter crescentus and Vibrio cholerae (Yen et al. 2002; Val et al. 2008; Wang et al. 2006). In vitro characterization of Xer recombinases and dif sites has also been carried in Haemophilus influenzae and Bacillus subtilis (Neils onet al. 1999; Sciochetti et al. 2001). However, the importance of dif/XerCD for the fitness of bacteria has only been demonstrated in E. coll and V. cholerae (Cornet et al. 1996; Val et al. 2008). In some other bacteria, like Lactococci and Streptococci,chromosomedimer resolution is resolved by single tyrosine recombinases that act at specific dif site (Lc Bourgeois et al. 2007; Nolivos et al. 2010). In this case, dimer resolution still depends on FtsK and dif is still located opposite the origin of replication between oriented polar sequences (Campo et al. 2004). Several filamentous phages are known to hijack this site-specific recombination machinery of dif/XerCD for their integration into the host chromosome, containing pseudo-dif sequences within these phage genomes (Lin et al. 2001; Huber and Waldor 2002; Campes et al. 2003; Val et al. 2005; Derbise et al. 2007; Campes et al. 2010; Das et al. 2010). However,the dif sequence remains intact during such recombination process to ensure the integrity of chromosomedimer resolution machinery (Blakely 2004; McLeod and Waldor 2004). The dif-like sequencesin phages often contain more variable central region that is longer than the canonical 6 bp (Val et al. 2005; Campes et al. 2010; Das et al. 2010), and the XerD binding arm is considerably degenerate (Lin et al. 2001). Becausethere is only one origin of replication on bacterial circular chromosomes,replication generally terminates in a specificregion of the chromosome. This can be followedby the existence of a GC skew on the two replichore arms of the chromosomes with a shift-point opposite the origin of replication (Lobry lgg6a). Based on the observation that dif sites are generally located at or near the GC skew shift-point, Hendrickson and Lawrence proposed that replication might generallyterminate at dif, which coordinate replication and chromosomedimer resolution (Hendricksonand Lawrence 2007). In E. coll, the replication process usually terminates at a narrow region that includes approximately 5% of the genome length and is located directly opposite the replication origin (Louarn et al. 1977; de Massy et al. 1987; Hill et al. 1987). This is partly due to the existence of the Ter/Tus replication fork-trap (Hill et al. 1987). dif is located within the replication fork-trap but termination occurs precisely at the Tus site, not at dif (Duggin and Bell 2009) and dif is active when displaced outside of the replication termination region if it is still within the zone where KOPS converges (Cornet et al. 1996). Nevertheless, the lack of universal conservation of the Tus protein may suggest that replication terminated at. 10.
(29) 2.2.. MATERIALS. AND. METHODS. dif sites until the relatively recent takeover by the Ter-Tus system (Duggin et al. 2008). We reasoned therefore that the comprehensive identification of dif sites and of their location with respect to the GC skew shift-point in hundreds of complete genomes might provide clues to the evolution of the CDR machinery and its possible link with the replication termination mechanism in bacterial species. Prediction of the dif sequences has been reported by several groups with different approaches. Hendrickson and Lawrence showedthat sequence skew can be used to predict the locations of dif sites, and they identified putative dif sequences in 25 bacteria based on sequence similarity (Hendricksonand Lawrence 2007). Lc Bourgeois and colleaguesreported a new type of tyrosine recombinase, named XerS, which is responsiblefor CDR in Streptococci and Lactococciand this recombinase targets a 31 bp sequence element named difsL (Lc Bourgeois et al. 2007). For comparison, they predicted dif sequences in 22 Firmicutes based on their similarity to that of B. subtilis with Megablast (Zhang et al. 2000) and on the fact that the dif sequence occurs only once per genome. Val and colleagues identified that V. choleraechromosomeII, whose many features are plasmid-like,has an original dif sequence independently, and therefore it has FtsK-dependent CDR (Val et al. 2008). For this purpose, they predicted dif sequences in five ca-Proteobacteria and ten /s-Proteobacteria that harbor multiple chromosomes, and discussed a conserved FtsK-dependent CDR on multiple chromosomesbased on the close relative distance of the positions of dif sequences and the GC skew shift-points. Their prediction method is based on a HMMER (Eddy 1998) score (< 10-5) with a profile built from 27 aligned dif sequences in the largest chromosomes of -y-Proteobacteria species, with manual checkingfor 6 bp spacing between two XerC and XerD binding motifs. Carney and Roten reported the most comprehensive predictions to date, identifying putative dif sequences in 204 chromosomesin 137 Proteobacteria strains, discussingthe high conservation of dif/XerCD systems and the possibleloss of dif sequencesin endosymbionts, with suggestions for other CDR mechanisms (Carney and Roten 2009). Here, the prediction was based on BLAST searches and YASSalignment (Noe and Kucherov 2005) with the dif sequences of E. coll and B. subtilis, and candidates were selected based on their proximity to the GC skew shift-points and a single occurrence per chromosome. Previous predictions were therefore limited to three bacterial phyla: Proteobacteria, Firmicutes and Actinobacteria. To this end, we describe comprehensive predictions for dif sequences based on a machine learning approach, tracing the phylogenetic conservation patterns of XerCD recombinases and using an iterative hidden Markov modeling method. Furthermore, we observed the relationship between predicted dif sequence positions and GC skew shift-points, and investigated whether replication termination occurs at the dif site.. 2.2. 2.2.1. Materials Software. and and. Methods. sequences. All analyses in this study were conducted using programs written in Perl with the G-language Genome Analysis Environment, version 1.8.10 (Arakawa et al. 2003; Arakawa and Tomita 2006; Arakawa et al. 2008). Hidden Markov modeling and searching was conducted with HMMER, version 2.3.2 (Eddy 1998). The dif sequence is the binding site of the XerCD recombinase; therefore, we first selected 734 circular bacterial chromosomes among 658 species/strains according to their conservation of XerCD using the KEGG (Kyoto Encyclopedia of Genes and Genomes) Orthology database (KO; Kanehisa et al. 2010). We obtained these sequences from the NCBI FTP Repository (2009, http://www.ncbi.nlm.nth.gov/Ftp). The followingexperimentally confirmed (E. coll and B. subtilis) or computationally predicted (F. alni) dif sequences were used as seed sequences for subsequent searches and machine learning:. 11.
(30) 2.2.. E. coll s'-GGTGCGCATAATGTATATTATGTTAAAT-s'. MATERIALS. AND. METHODS. (Blakely and Sherratt 1994). B. subtiliss'-ACTTCCTAGAATATATATTATGTAAACT-s'(Sciochetti et al. 2001) F. alni s'-CACGCCGATAATGCACATTATGTCAAGT-s'(Hendricksonand Lawrence 2007). 2.2.2. Iterated. hidden. Markov. modeling. XerCD conservation does not immediately imply dif sequence conservation (Val et al. 2008). Therefore, to determine the phylogenetic conservation patterns of XerCD, we first aligned all XerCD amino acid sequences in the 734 genomes analyzed in this work with those in organisms with the above-mentioned dif sequences using ClustalW (Thompson et al. 1994). The average distances of XerC and XerD sequences that were calculated from this alignment were used to infer phylogenetic conservation patterns among phyla. Based on the phylogenetic conservation patterns of XerCD, we iteratively created the hidden Markov models (HMM) for the accurate prediction of dif sequences, seeded with the previously described dif sequences (Figure 2.IA). Iterated HMM is shown to be able to build a more diverse and potentially more sensitive models than regular HMM, by incorporating distant homologoussequences while avoiding the contamination of nonhomologous sequences into the model (Johnson et al. 2010), and thus iterative HMM has been frequently utilized in bioinformatics and computational biology (Altschul et al. 1997; Karplus et al. 1998; Schaffer et al. 2001; Scheeff and Bourne 2006). In this work, the first profile hidden Markov model was created from the dif sequences identified in genomes belonging in the same genus as the genome harboring the seed sequence. For example, in Proteobacteria, the seed sequences came from E. coll;therefore, the dif sequences were searched in 28 genomes belonging to the genus Escherichia by means of fuzzy matching with the seed sequences of E. coll K12 using Perl module String::Approx 3.26 (http://search.cpan.org/Njhi/String-Approx-s.26/Approx.pin). For fuzzy matching, the maximum numbers of insertions, deletions, and substitutions were previously determined to be 0 bp, 0 bp, and 8 bp, respectively (Blakely and Sherratt 1994). Likewise,initial profiles were created for Firmicutes based on 24 genomes in the genus Bacillus and for Actinobacteria based on two genomesin the genus Frankia. Based on these initial profile hidden Markov models, dif sequences were predicted in the genomes of the closest genus to the seed genus according to the amino acid sequences of XerCD proteins.. 12.
(31) 2.2.. MATERIALS. AND. METHODS. A [Threshold] • Score> _ 0 • E.vaXw< 10 • No other candidates. HMM. HMM. HMM. Profile. Profile Prediction. Prediction. Integration. Profile hidden Makovmodelo(&d.rkho GGTGCG( ATAATGTATAlTTATGTTAAAT A4TUG(ATAATGTATAT TATGTTAAAT GGTGCG CATAAT (ATMTAR,TTAAAG (Esdleridlia 28 strains). Profile Integration New profile Ndden Nerkov mood. New proae hidden Nerkw model GGTGC.GC ATAATGTATATTATGTTAAAT. GGTGCGCATAATGTATATTATGTTAAAT. AGTGCGCATAATGTATATTATGTTAAAT. AGTGCGCATAATGTATATTATGTTAAAT. GGTGCGCATAATGTATATTATGTTAAAG. GGTGCGCATAATGTATATTATGTTAAAG. GGTGCGCATAATGTATATTATGTTMAT. GGTGCGCATAATGTATATTATGTTMAT GGTGCGCATAATGTATAl TATGTTAAAT. GGTGCGCATMTGTATATTATGTTMAT. Shlyella. GGTGCGCATMTGTATATTATGTTMAT. Salmonella. GGTGCCCATAATGTATATTATGTTAAAT GGTGCGCATAATGTATATTATGTTAMT. Predicteddi(tequencef GGTGCGCATAATGTATATTATGTTAMT. Predicted4/recommits GGTGCGCATMTATATATTATGTTAAAT GGTGCGCATAATGTATATTATGTTAMT GGAGCGCATMTGTATATTATGTTAAAT GGTGCGCATMTATATATTATGTTAMT. GGTGCGCATAATGTATATTATGTTAMT. GGAGCGCATMTGTATATTATGTTAMT. GGTGCGCATAATGTATATTATGTTAMT. Phylum. Figure 2.1: Prediction strategy. A: Example of the iterated HMM in Proteobacteria. The first seed profile hidden Markov model is created from the seed dif sequence of Escherichia coll, by searching for dif sequences in 28 genomes belonging to the genus Escherichia by means of fuzzy matching. Based on this initial profile hidden Markov model, dif sequences were predicted in the genomes of the closest genus to the Escherichia genus (in this case, Shigella) according to XerCD amino acid sequences. Subsequently, a new profile is created using the previous profile and the newly predicted dif sequences, and this new profile is used to predict in the second closest genus (in this case, Salmonella). In this way, profile creation and dif sequence prediction were repeated recursively in decreasing order of similarity of XerCD from the Escherichia sequence. The iterated HMM is conducted for each phylum. B: Flow chart of the overall strategy.. 13.
(32) 2.2.. MATERIALS. AND. METHODS. In the case of Proteobacteria, an initial profile was created using genomes belonging to the genus Escherichia, and this profile was used to predict dif sequences in the genus Shigella. Subsequently,a new profile was created using the previous profile and the newly predicted dif sequences, and this new profile was used to predict the second nearest genus (in the case of Proteobacteria, Salmonella). In this way, profile creation and dif sequence prediction were iterated in decreasing order of similarity of XerCD from the seed sequences; thus, iterated HMM was conducted for each phylum. Because no dif seed sequences were available for phyla other than the three described above, the three profile hidden Markov models obtained by iterated HMM in Proteobacteria, Firmicutes, and Actinobacteria were used as the initial profiles. At each iterated HMM, predicted candidates were validated according to the followingcriteria: 1) HMMER score > 10 and e-value < 10-4, 2) leave-one-out cross-validationusing the new profiles, and 3) conservation of the palindromic structure. For cross-validation, each time a new profile was created in the iterated HMM, we tested the validity of the training set by leaving out one of the dif sequences from the accumulated set of dif sequences and checking that the prediction of the left-out sequence by training with all of the other dif sequences is always above the threshold for all dif sequences collected up to that iteration. For the palindromic structure, positions 7-12 bp and 17-22 bp of dif sequences, corresponding to the binding sites of XerC and XerD, were checked for complementarities. For example, the palindromic structure of E. coll dif sequences in bracket notation is "--(--- (((((( -()- )))))) ---)--", and the conservation threshold is set to more than four pairs of complementarities within the 7-12 bp and 17-22 bp positions of the predicted dif sequences. Although iterated HMM is based on phyla, this taxonomic unit is sometimes too diverse to accurately follow phylogeny with recursive means. Therefore, prediction was separately conducted in classes instead of phyla for 60 strains, harboring 130 chromosomesfor classes a-, 0- and 'y-Proteobacteria. Similarly,sometimes, a species is highly phylogenetically distant from the seed organism, making it the case that utilization of profile hidden Markov models from other phyla is more suitable than own phyla's profile. When iterated HMM fails in such cases, an alternative seed profile is created using the dif sequences from the top three genomes with the closest XerCD sequences, as determined by alignment using ClustalW (Figure 2.IB). GC skew's shift-point, calculated as (C — G)/(C + G), was computed using the "find_ori_ter"function of the G-language GAE (Arakawa et al. 2003), based on the cumulative GC skew (Grigoriev 1998) at 1 bp resolution. Although GC skew is widely observed in bacterial species, a number of genomes do not exhibit notable compositional bias (Arakawa and Tomita 2ooia; Arakawa et al. 2007). To determine the presence of genomic nucleotide compositional bias, the GC skew index (GCSI) was calculated for all genomes, and GCSI > 0.05 was used as the threshold (Arakawa and Tomita 2ooia; Arakawa et al. 2ooga). GCSI quantifies the degree of GC skew using the compositional distance between the leading and lagging strands and the spectral amplitude of 1 Hz signal of GC skew graph using Fast Fourier Transform. In this study, the replication origin is defined based on the cumulative GC skew at 1 bp resolution using the G-language GAE.. 2.2.3. Calculation. of the conservation. quantity. of dif sequences. Conservation quantity was calculated based on the nucleotide variance in each position of dif sequences. Firstly, we calculated the position-specific base composition of all dif sequences in a group (phylum or class). Subsequently, variance of the most frequent base in that position is calculated from the base composition. For example,when a group with 100 dif sequenceshas nth base composition of (A, T, G, C = 100, 0, 0, 0) or (A, T, G, C = 25, 25, 25, 25), the variance is 2,500or 0, respectively. Hence, if the position-specificbase composition is biased toward any one base, its high variance indicates high degree of conservation. These values are normalized to percentages for comparisonwith other groups. In the case of multiple chromosomes,since these conservation quantities were calculated in each strain, the average value was used for normalization.. 14.
(33) 2.3.. 2.3. 2.3.1. RESULTS. Results Overview. of dif sequence. prediction. We first analyzed the phylogenetic conservation patterns of XerC and XerD in bacterial species by calculating the distances of their amino acid sequences from those in the seed organisms with known dif sequences (experimentally confirmed: E. coll and B. subtilisand computationally predicted: Frankia alni). As depicted in Figure 2.2 and Figure 2.3, sequence similarity distributions were clearly distinguished by phylum. Sequences belonging to different phyla always showed ClustalW distances of > 0.3, and based on this phylogenetic distribution pattern, we separately trained and predicted the dif sequences in each phylum using iterated HMM. By this phylogeneticprediction approach, we predicted dif sequences in 578 genomes out of 592 that harbor the XerCD recombinase. The same prediction method was applied for 66 organisms with multiple chromosomes,totaling 142 chromosomes,where we could predict dif sequences in 63 organisms with 137 chromosomes(Table 2.1). All of these predictions resulted in unique hits above the threshold, and their validity was further confirmed through leave-one-outcross-validation. On the other hand, predictions below the threshold (score < 10 and evalue > 10-4) often resulted in multiple candidates with insufficientscores. When the initial prediction using the strict threshold failed,we manually checkedthe predicted sequences for the conservationof palindromic structure in the 7-12 bp and 17-22 bp positions, and candidates that were located close to the origin of replication were removed because the displacement of a dif sequencenear the origin significantlyreduces the growth rate (Cornet et al. 1996). 0.50 ,B. A. 0.50. 0.40. 0.40 h-. 7. 0.40. zu 0.30. 0.30. z 0.30 C. 0 o 0.20 0 0.10. 0.20. 0.la. 0. 0 0.20 0 0.10. 0. 0. 0. 0.10. 0.20. 0.30. 0.40. 0.50. C. 0.50. sri. 0. 0.10. Fsc.herichia coll K-l2. 0.20 Escherichia. 0.30. 0.40. coll K-l2. 0.50. 0. 0. .10. 0.20. 0.30. Bacillus subtilis. 0.40. 0.50. 168. Figure 2.2: The phylogenetic distance of XerCD in each organism. The phylogenetic distances of bacterial genomes to three seed organisms, Escherichia coll (Proteobacteria), Bacillus subtilis (Firmicutes) and Frankia alni (Actinobacteria), were calculated as the average of phylogenetic distances of XerC and XerD. Detailed example is given in Figure 2.3. A to C are scatter plots of the distances of these genomes to the seed organisms. Axes represent average distances as calculated by ClustalW. A: Distances from Escherichia coll K-l2 and Bacillus subtilis 168; B: distance from Escherichia coll K-l2 and Frankia alni ACNl4a; and C: distance from Bacillus subtilis 168 and Frankia alni ACNl4a. Blue represent the genomes of Proteobacteria, green represent Firmicutes, yellow represent Actinobacteria, and the gray marks represent other phyla. All phyla show strong preferences for seeds from the same phylum.. 2.3.2. Prediction. results. of each. phylum. In Proteobacteria, fuzzy matching in 28 Escherichia strains based on the dif sequence of E. coll K12 for the creation of an initial seed profile hidden Markov model yielded a unique dif sequence in each of the 28 15.
(34) 2.3.. Table. chi. 2.1:. Prediction. result. overview.. : chromosomes Sinale. Chromosome. Predicted. Oraanism. Proteobacteria Firmicutes. 362. 357. 100. 97. 97.00. Actinobacteria Bacteroidetes. 66. 66. 100.00. 19. 19. 100.00. Chlamydiae Chlorobi Acidobacteria. 14. 14. 100.00. 11. 11. 100.00. 3. 3. 100.00. 3. 3. 100.00. 3. 3. 100.00. 1. 1. 100.00. 1. 1. 100.00. 1. 1. 100.00. 1. 1. 100.00. 1. 1. 100.00. Verrucomicrobia Chloroflexi Gemmatimonadetes Nitrospirae Elusimicrobia Tenericutes Spirochaetes Cyanobacteria Planctomvcetes Total. Multi. 5. 0. 0.00. 1. 0. 0.00. 592. te Chromosomes. Oraanism. 98.61. (chi. 578. Predicted. (chi. Spirochaetes. 60 (130) 6 (12). 57 (125) 6 (12). Total. 66 (142. 63 (137. Proteobacteria. 16. 97.64 cYo(chi. 95.00 (96.15) 100.00 (100.00) 94.45. 96.48. RESULTS.
(35) 2.3.. A. Distance. Organ A- X..0 Eadier.la col (ProuoWCUrv) - XerC Omar. A. XerO Eulrrdla ml )PreneE•anrv) - Xero. RESULTS. Average. MTEFSASLAPQVEAFLRYLSIERQLSPLTVTSYRRQLSALAEIGEQMGLAMNQTLDAAQV_. 0.140 0.308 MIDLNT----DVERYLRYLSVERQLSPITLLNYQRQLEAIINFASENGLQSWQQCDVoeA._ .. . ... . •• •• •,_•0 .112 MKQQDNPLIEQFLDALWLERNLAENTLASYRLDLHALVGWLTHHNSOLLRASPQOLQSFL. 0.004 40 MK-QDLARIEQFLDALWLEKNLAENTLNAYRRDLg44oEWLHHRGLTLATAQSDOLQALL_.. Orga ,. A- XerC BotlWe. bS. Oirmkwr) - XerC. MrEFSASLAPQVEAFLRYLSIERQLSPLTVISYRRQLSALMEIGEQMGLAMWQTLDAAQV._ 0000 ----MENVKNFVKLFVEYLQIEKNYSQYTIVNYVDSIEEFETFLRVQGINGFEEAAYQDT._. Orraram A • Xero Badlm rW6 Oirmwrtr) - XerO. MKQQDNPLIEQFLDALWLERNLAENTLASYRLDLHALVGWLTH--HNSDLLRASPQOLQS... 0028 MKOQ-- -IKDFIHYVANERGLSQNTIVSYERDLKSYSLYLTETLHVIDWNHVTRIHIIQ_.. 0.30R. 0.1 12 E:dierirhia coll K-I2. 0.5. ap .o. 0.5. 0.5. 0.4. 0.4. 0.4. 0.3. 0.3. 0.3. 0.2. 0.2. 0.1. 0.1. 4. z 0.2 "v. m 0.1 0. 0 0. 0.1. 0.2. Escherichia. 0.3. 0.4. coil K 12. 0.5. 0 0. 0.1 0.2 0.3 0.4 Yersiniapestis Angola (distance to E. coll:0.1). 0.5. 0. 0.1 0.2 0.3 0.4 0.5 ShewanellabalticaOS 195 (distance to E.coll:0.2). Figure 2.3: An example for the plot shown in Figure 2.2. This phylogenetic distance was based on XerC and XerD amino acid sequence alignment in each other strain, and we calculated this distance using the average distance matrix that is generated from the pairwise scores. A: In this case of organism A in Proteobacteria, the average phylogenetic distances between organism A and Escherichia coll is 0.112, and that between organism A and Bacillus subtilis is 0.308. According to this scores, the organism A was plotted as the diagram. Since organism A belongs in Proteobacteria (represented as blue in Figure 2.2), it has shorter distance to E. coll than to B. subtilis. B: These graphs are shown by other spectrums. The left figure is Proteobacteria (blue) plot in Figure 2.2A, and colored in each distance (distance 0-0,1, 0.1-0.2, 0.2-0.3 and other are represented by purple, red, orange and gray respectively). The middle and right figures are used Yersinia pestis Angola (distance = 0.1) and Shewanella baltica oSlgs (distance = 0.2) as x-axis respectively. The observation by such spectrum changes shows that the XerCD amino acid sequences are distinguished in each strain.. 17.
Gambar
+2
Dokumen terkait
Selesai mengikuti perkuliahan ini, mahasiswa memahami landasan pemikiran, konsep dasar, dan lingkup garapan bimbingan dan konseling anak, di samping juga menguasai strategi
bahwa dengan adanya perbaikan gaji pokok Anggota Tentara Nasional Indonesia yang berlaku terhitung mulai tanggal 1 Januari 2013 sebagaimana dimaksud dalam Peraturan Pemerintah Nomor
3) Pembuktian kualifikasi untuk menilai pengalaman yang sejenis dan besaran nilai pekerjaan yang sesuai dengan nilai pekerjaan yang akan dikompetisikan dilakukan
Berdasarkan latar belakang yang ada tersebut, maka peneliti perlu melakukan penelitian untuk mengetahui pengaruh pemahaman ilmu agama Islam (Tafsir) dan fisika
Salah satunya adalah dakwah di dalam dan melalui cyberspace harus disertai dengan kemampuan semiotic dan pencitraan ( imagology ), yaitu.. dengan
Calon penyedia yang akan mengikuti Klarifikasi Dokumen Penawaran Teknis Paket Pekerjaan Penyusunan data base PSU Kawasan Permukiman diharapkan mempersiapkan hal-hal
panas yang tinggi karena bahan bakar yang diberikan dapat di dibakar. dengan batuan O2 dari udara
bulu tangkis usia dini Gubernur Cup 2005 yang diselenggarakan di GOR UGM//Event yang digelar ini dalam. rangka kampanye minum susu dan tolak ukur pembinan atlet usia dini di
