i
Statistik Asuransi Gempa
Bumi Indonesia 2010
Indonesian Earthquake Insurance Statistic 2010]
Sesuai dengan tujuan pendiriannya, MAIPARK
selalu berusaha melakukan inovasi dalam
memberikan pelayanan terbaik bagi industri
asuransi Indonesia dalam hal ilmu dan statistik
mengenai risiko bencana.
Inovasi
terus
kami
lakukan
untuk
menyempurnakan laporan statistik ini, sehingga
menjadi lebih akurat, rinci dan komperhensif.
Berikut kami sajikan laporan Statistik Asuransi
Gempa Bumi Indonesia 2009 – 2010 yang
mencakup :
o
Inovasi terhadap sistem dan proses
pengolahan data statistik.
o
Peta Kejadian Gempa Bumi Indonesia.
o
Peta
Exposure
Gempa Bumi Indonesia.
o
Penggolongan tersendiri atas risiko multi
lokasi, dalam laporan profile risiko dan
klaim.
o
Analisa asuransi gempa terkait kondisi
makro ekonomi.
o
Analisa seismitas terkini.
o
Laporan dengan dua bahasa (Bahasa
Indonesia – Bahasa Inggris).
o
Panel navigasi yang akan memudahkan
dalam menelusuri laporan statistik ini.
o
Tabel, peta dan grafik yang kreatif.
Dengan semangat ”Go Green”, dan laporan
tersebut disajikan dalam bentuk soft copy dan
tidak lagi diproduksi dalam bentuk hard copy.
Usaha
yang
kami
lakukan
dalam
menyempurnakan laporan statistik ini tidak akan
berarti apa - apa tanpa dukungan dari seluruh
perusahaan asuransi. Data yang lengkap dan
akurat akan sangat menentukan kualitas dari
hasil statistik ini.
In line with the intention of MAIPARK
establishment, MAIPARK keeps on innovating to
provide the best services for the Indonesia’s
insurance industry in terms of science and
statistics on Catastrophe risks. We keep on doing
innovation to make this statistics report more
accurate, detailed and comprehensive. Herewith,
we present Indonesian Earthquake Statistical
Report of 2009 - 2010 which include:
o
Inovation of the system and statistical
data processing.
o
Map
of
Indonesian
Earthquake
Occurence.
o
Map
of
Indonesian
Earthquake
Exposure.
o
Separate classification of multi-location
risks in Risk and Loss Profile report.
o
Analysis of earthquake insurance related
to macro economic conditions.
o
Current Seismic Analysis.
o
Bilingual reports (Indonesian - English).
o
Navigation Panel to ease to trace the
statistical report.
o
Creative tables, maps and graphs.
With the spirit of "Go Green” the report is
presented in soft copy rather than hard copy.
Our efforts to continously improve this statistic
report are nothing without all insurance
companies’ support. Complete and accurate data
will greatly determine the quality of these
statistical results.
Kata Pengantar
Foreword
Kami berharap laporan statistik ini dapat
memberikan manfaat tidak hanya bagi
perusahaan asuransi yang menangani asuransi
gempa bumi, namun juga berguna bagi industri
Asuransi Umum di Indonesia.
We hope that this statistic report is useful for both
insurance companies having earthquake
business and general insurance industry in
Indonesia.
Salam Inovasi MAIPARK !!
Frans Sahusilawane
President Director
Daftar Isi / Contents
Kata Pengantar ... i
Daftar Isi ... iii
Informasi Statistik... vi
Ikhtisar Asuransi Gempa Bumi Indonesia
2010...
A.Pendahuluan ... 1
B.Struktur Pasar ... 1
C.Pertumbuhan Premi Bruto ... 2
D.Jumlah Risiko ... 6
E.Kontribusi Asuransi Gempa Bumi Indonesia
... 7
F.Pertumbuhan
Incurred Claim
... 15
Exposure Asuransi Gempa Bumi Indonesia
...
Tabel 2.1.Exposure Per Cresta Zone ... 21
Tabel 2.2.Exposure Per Okupasi ... 23
Tabel 2.3.Exposure Per Interest ... 25
Tabel 2.4.Exposure Per Provinsi ... 27
Gross Premium Asuransi Gempa Bumi
Indonesia
...
Tabel 3.1.Gross Premium Per Cresta Zone . 28
Tabel 3.2.Gross Premium Per Okupasi ... 30
Tabel 3.3.Gross Premium Per Provinsi ... 32
Jumlah Risiko Asuransi Gempa Bumi
Indonesia
...
Tabel 4.1.Jumlah Risiko Per Cresta Zone ... 33
Tabel 4.2.Jumlah Risiko Per Okupasi ... 35
Klaim Asuransi Gempa Bumi Indonesia
...
Tabel 5.1.1.Klaim Frekwensi Per Okupasi .... 37
Tabel 5.1.2.Klaim Frekwensi Per Cresta Zone
... 39
Tabel 5.2.1.Jumlah Klaim Per Okupasi ... 41
Tabel 5.2.2.Jumlah Klaim Per Cresta Zone .. 43
Foreword ... i
Table of Contents ... iii
Statistical Information ... iv
Summary of Indonesia Earthquake
Insurance 2010
...
A.Introduction ... 1
B.Market Structure ... 1
C.Growth of Gross Premium ... 2
D.Number of Risks ... 6
E.Earthquake Insurance Contribution
... 7
F.Growth of Incurred Claim ... 15
Indonesia Earthquake Insurance Exposure
....
Table 2.1.Exposure By Cresta Zone ... 21
Table 2.2.Exposure By Occupation ... 23
Table 2.3.Exposure By Interest ... 25
Table 2.4.Exposure By Province ... 27
Indonesia Earthquake Insurance Gross
Premium
...
Table 3.1.Gross Premium By Cresta Zone .. 28
Table 3.2.Gross Premium By Occupation .... 30
Table 3.3.Gross Premium By Province ... 32
Indonesia Earthquake Insurance Number of
Risks
...
Table 4.1.Number of Risk By Cresta Zone .. 33
Table 4.2.Number of Risk By Occupation... 35
Indonesia Earthquake Insurance Claim
...
Table 5.1.1.Claim Frequency By Occupation 37
Table 5.1.2. Claim Frequency By Cresta Zone
... 39
Table 5.2.1.Claim Amount By Occupation .... 41
Profil Risiko dan Klaim
...
Tabel 6.1.Semua Tahun Underwriting, Semua
Okupasi, Semua Cresta Zone ... 45
Tabel 6.2. Tahun Underwriting 2010, Semua
Okupasi, Semua Cresta Zone ... 46
Tabel 6.3. Tahun Underwriting 2009, Semua
Okupasi, Semua Cresta Zone ... 47
Tabel 6.4. Tahun Underwriting 2008, Semua
Okupasi, Semua Cresta Zone ... 48
Tabel 6.5. Tahun Underwriting 2007, Semua
Okupasi, Semua Cresta Zone ... 49
Tabel 6.6. Tahun Underwriting 2006, Semua
Okupasi, Semua Cresta Zone ... 50
Profil Risiko dan Klaim Tahun Underwriting
2010
...
Okupasi Agricultural ... 51
Okupasi Commercial ... 52
Okupasi Industrial ... 53
Okupasi Residential ... 54
Profil Risiko dan Klaim Tahun Underwriting
2009
...
Okupasi Agricultural ... 55
Okupasi Commercial ... 56
Okupasi Industrial ... 57
Okupasi Residential ... 58
Profil Risiko dan Klaim Tahun Underwriting
2008
...
Okupasi Agricultural ... 59
Okupasi Commercial ... 60
Okupasi Industrial ... 61
Okupasi Residential ... 62
Profil Risiko dan Klaim Tahun Underwriting
2007
...
Okupasi Agricultural ... 63
Okupasi Commercial ... 64
Risk and Loss Profile
...
Table 6.1.All Underwriting Year, All
Occupation, All Cresta Zone... 4
5
Table 6.2. Underwriting Year 2010, All
Occupation, All Cresta Zone... 46
Table 6.3. Underwriting Year 2009, All
Occupation, All Cresta Zone... 47
Table 6.4. Underwriting Year 2008, All
Occupation, All Cresta Zone... 48
Table 6.5. Underwriting Year 2007, All
Occupation, All Cresta Zone... 49
Table 6.5. Underwriting Year 2006, All
Occupation, All Cresta Zone... 50
Risks and Loss Profile Underwriting Year
2010
...
Agricultural Occupation ... 51
Commercial Occupation ... 52
Industrial Occupation ... 53
Residential Occupation ... 54
Risks and Loss Profile Underwriting Year
2009
...
Agricultural Occupation ... 55
Commercial Occupation ... 56
Industrial Occupation ... 57
Residential Occupation ... 58
Risks and Loss Profile Underwriting Year
2008
...
Agricultural Occupation ... 59
Commercial Occupation ... 60
Industrial Occupation ... 61
Residential Occupation ... 62
Risks and Loss Profile Underwriting Year
2007
...
Agricultural Occupation ... 63
Okupasi Industrial ... 65
Okupasi Residential ... 66
Profil Risiko dan Klaim Tahun Underwriting
2006
...
Okupasi Agricultural ... 67
Okupasi Commercial ... 68
Okupasi Industrial ... 69
Okupasi Residential ... 70
Peta.7.1 Distribusi Kejadian Gempa di
Indonesia 2004 - 2010 ... 71
Daftar Istilah ...
Lampiran
1.
Tarif Asuransi Gempa Bumi Indonesia ...
2.
Skala First Loss ...
3.
Tabel Jangka Waktu Pertanggungan
Kurang dari satu tahun ...
4.
Tabel Indemnitas ...
Industrial Occupation ... 65
Residential Occupation ... 66
Risks and Loss Profile Underwriting Year
2006
...
Agricultural Occupation ... 67
Commercial Occupation ... 68
Industrial Occupation ... 69
Residential Occupation ... 70
Map 7.1 Indonesia Earthquake Distribution of
occurrences 2004-2010 ... 71
Glossaries ...
Attachments
1.
Indonesia Earthquake Insurance Tariff ....
2.
First Loss Scale ...
3.
Short Period Table
less
than one year
period
...
1.
Statistik dibuat berdasarkan Underwriting
Year yang tercatat sampai dengan posisi
31 Desember 2010.
2.
Sesi Limit
2.1.
Limit Sesi didasarkan atas setiap
risiko.
2.2.
Yang dimaksud dengan setiap risiko
(
anyone risk
) adalah akumulasi
(
aggregate
)
jumlah
harga
pertanggungan seluruh risiko pada
lokasi yang sama untuk
masing-masing
perusahaan
asuransi.
Definisi setiap risiko atau setiap
lokasi ditentukan oleh perusahaan
asuransi atau penerbit polis sesuai
dengan interpretasi perusahaan
asuransi dalam
underwriting
polis
kebakaran.
2.3. Besarnya Limit Sesi atas setiap
risiko (
any one risk
) untuk gabungan
kerugian fisik dan gangguan usaha
adalah sebagai berikut :
2.3.1.
Untuk daerah Jawa Barat,
Banten dan DKI : 5%
(lima prosen) dari jumlah
seluruh pertanggungan (
total
sum insured
) maksimum
USD 2,500,000.00 (dua juta
lima ratus ribu Dollar
Amerika) atas setiap risiko,
setiap perusahaan asuransi
atau penerbit polis.
2.3.2 Untuk daerah Indonesia
lainnya 25% (dua puluh lima
prosen) dari jumlah seluruh
pertanggungan (
total sum
insured
) maksimum USD
2,500,000.00 (dua juta lima
ratus ribu Dollar Amerika)
atas setiap risiko setiap
1.
Statistics
are
made
based
on
Underwriting Year basis, which is
recorded as at December 31 2010.
2.
Cession Limit
2.1.
Cession Limit is based on any one
risk.
2.2.
Anyone risk is the accumulation of
(aggregate) total sum insured of all
risks at the same location for each
insurance company. The definition of
anyone risk or any location is
specified by the insurer or policy
issuer in accordance with the
interpretation of insurance companies
in underwriting fire policy.
2.3.
Cession Limit of any one risk for the
combined material and business
interruption damage are as follows:
2.3.1
For West Java, Banten and DKI
: 5% (five percent) of the total
sum insured, a maximum of
USD 2,500,000.00 (two million
five hundred thousand U.S.
Dollars) for any one risk, each
insurance company or policy
issuer
2.3.2
Others area within Indonesia
are 25% (twenty five percent) of
total sum insured, maximum of
USD 2,500,000.00 (two million
five hundred thousand U.S.
Dollars) for each risk, each
insurance company or policy
issuer.
Informasi Statistik
Statistics Information
perusahaan asuransi atau
penerbit polis.
2.4.
Dalam hal penutupan secara
First
Loss Basis / Sub-limit
, jumlah yang
disesikan sebagaimana diatur dalam
butir
2.3.
diatas,
dikalikan
prosentase
First Loss Basis /
Sub-limit Basis
.
2.5.
Bilamana risiko ditutup secara
ko-asuransi, jumlah maksimum sesi dari
semua Anggota ko-asuransi adalah
sesuai dengan ketentuan yang diatur
dalam 2.3. diatas. Sesi
masing-masing
perusahaan
adalah
proporsional sebanding sahamnya
dalam ko-asuransi.
Dalam hal terdapat penutupan lain
selain polis ko-asuransi tersebut
pada obyek pertanggungan yang
sama, perusahaan asuransi tetap
dapat mensesikan risiko dimaksud,
dengan catatan jumlah seluruh sesi
perusahaan asuransi bersangkutan
tidak melebihi ketentuan yang diatur
pada butir 2.3.
3.
Tarif Premi
3.1. Penutupan dengan menggunakan
Full Value Basis mengaplikasikan
Tarif Premi Standar Gempa Bumi
Indonesia (lampiran 1)
3.2. Penutupan dengan First Loss / Sub
Limit Basis mengaplikasikan standar
First Loss Scale (lampiran 2)
3.3. Perhitungan premi untuk penutupan
kurang dari 12 (dua belas) bulan
diberlakukan skala premi jangka
pendek (lampiran 3)
3.4. Untuk perhitungan premi Bussiness
Interruption diberlakukan Indemnity
Period Scale (lampiran 4)
4.
Obyek Pertanggungan
4.1. Obyek pertanggungan yang dapat
disesikan
adalah
obyek
pertanggungan asuransi kebakaran
berupa :
2.4
In term of first loss basis / sub limit
policies, the amount cessions are
stipulated in item 2.3 above, then
multiplied by the percentage of First
Loss Basis / Sub-limit Basis.
2.5
For coinsurance policies, maximum
cession from all members of
coinsurance is stipulated in item 2.3
above. Each ceding company cedes
proportionally depending on its
share.
In the even there are other policies
on the same risk beside that
coinsurance policy, insurer still can
cede such risks subject to the
maximum limit set out in item 2.3
3.
Premium Tariff
3.1.
For the coverage of Full Value Basis,
Indonesian earthquake rate standard
is applied (attachment 1).
3.2.
The coverage First Loss / Sub Limit
Basis uses standard First Loss Scale
(attachment 2).
3.3.
Premium calculation for short period
coverage is based on Short Period
Scale (attachment 3).
3.4.
Premium calculation for business
interruption is based on Indemnity
Period Scale (attachment 4)
4.
Insured Objects
4.1.
Insured objects that can be ceded
are insured objects in fire policy.
such as :
4.1.1. Kerusakan Fisik :
Bangunan
Pondasi
Penggalian dan
Sejenisnya
Persediaan Barang
Lain-lain
4.1.2 Gangguan Usaha :
Keuntungan Bruto
Upah
Kenaikan
Biaya
Operasional
Lain-lain
4.2 Penutupan sebagaimana dimaksud
pada butir 4.1. adalah yang ditutup
secara langsung (direct business)
termasuk ko-asuransi. Penutupan
tidak
langsung
(indirect
business/Reasuransi) tidak dapat
disesikan.
5.
Pelaporan Bordero.
Pelaporan bordero dilakukan setiap
bulannya untuk semua risiko yang ditutup
pada bulan yang bersangkutan dan sudah
harus diterima selambat-lambatnya pada
akhir bulan berikutnya.
6.
Untuk kasus “Multi Location Risk” yang
mengalami kesulitan dalam memberikan
detail harga pertanggungan perlokasi
maka dengan persetujuan AAUI pensesian
risiko dan perhitungan premi dilakukan
pada zona-zona tertentu.
7.
Untuk menggambarkan premi dan harga
pertanggungan yang sebenarnya dalam
penutupan
asuransi
gempa
bumi
berdasarkan ko-asuransi, diharapkan agar
seluruh anggota ko-asuransi mensesikan
risiko gempa bumi tersebut.
4.1.1.
Material damage :
Buildings
Foundations
Excavation and the like
Stocks
Others
4.1.2.
Business Interruption
Gross Profit
Wages
Increase in cost of working
Others
4.2.
Insured objects referred in item 4.1
are objects from direct business
insurance, including coinsurance.
Indirect businesses cannot be
ceded.
5.
Bordereaux Report.
Bordereaux reports is submitted on a
monthly basis for all risk underwritten in the
month concerned and should be received
by the end of the following month.
6.
In the case of Multi Location Risks with no
details of sum insured provided per
location, the risk cession and its premium
calculation specified zones after approved
by AAUI.
7.
In order to get overall pictures of each
earthquake insurance covers, it is strongly
hoped that all coinsurance members could
cede the earthquake cession.
A.
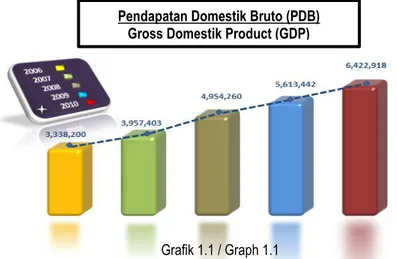
Pendahuluan.
Dengan mengukur Pendapatan Domestik Bruto
(PDB) berdasarkan laporan yang dikeluarkan
Biro Pusat Statistik dalam laporan triwulan
2010-nya, ternyata PDB nasional pada triwulan
keempat 2010 meningkat sebesar 14,42% dari
Rp. 5.613,40 triliun di tahun 2009 menjadi Rp.
6.422,91 triliun di tahun 2010 ini.
Tingkat Pendapatan Domistik Bruto (PDB)
Indonesia dalam lima tahun terakhir dapat dilihat
pada grafik 1.1 dibawah ini
B.
Struktur Pasar.
Maipark dimiliki oleh seluruh perusahaan
asuransi dan reasuransi umum di Indonesia,
Partisipasi kepada Maipark bersifat wajib.
Data-data dalam laporan ini merupakan hasil dari sesi
wajib statistik gempa bumi tersebut ditambah
sesi bukan statistik.
A.
Introduction
By measuring its Gross Domestic Product (GDP)
based on the quarterly report in 2010 issued by
Statistic Centre Bureau, the national GDP has
increased 14,42% or from Rp. 5.613,40 trillion in
2009 to Rp. 6.422,91 trillions in 2010.
The level of Indonesia’s Gross Domestic Product
during the last five years is shown in graph 1.1
below.
B.
Market Structure.
Maipark is owned by all general insurance and
reinsurance
companies
in
Indonesia.
Participation to Maipark was made compulsory.
All data in this report is generated from
stastistical compulsory cession and non
statistical cession.
Pendapatan Domestik Bruto (PDB)
Gross Domestik Product (GDP)
Grafik 1.1 / Graph 1.1
Ikhtisar Usaha Asuransi Gempa Bumi Indonesia Tahun 2010
Summary of Indonesian Earthquake Insurance Business Activities in 2010
Dalam Miliar Rupiah
In Billion Rupiah
Per 31 Desember 2010, seperti yang dilaporkan
oleh Bapepam LK – Departemen Keuangan
dalam laporan
Indonesian insurance directory
2010
, jumlah perusahaan asuransi dan
reasuransi umum di Indonesia adalah 90
perusahaan. Dengan rincian 86 perusahaan
asuransi umum dan 4 perusahaan reasuransi
umum. Dari ke 86 perusahan asuransi umum ini,
20 diantaranya adalah perusahaan patungan.
Sedangkan 66 sisanya adalah perusahaan
swasta nasional. Dari 4 perusahaan reasuransi
umum, kesemuanya adalah juga perusahaan
swasta nasional.
C.
Pertumbuhan Premi Bruto
Seiring dengan meningkatnya laju pertumbuhan
ekonomi Indonesia, seperti yang terlihat dari
pertumbuhan Pendapatan Domestik Bruto,
pendapatan premi bruto asuransi gempa bumi
pun meningkat dari tahun ke tahun.
Sampai dengan posisi per 31 Desember 2010,
pendapatan premi bruto untuk tahun underwriting
2006 adalah sebesar Rp. 1.770 Milliar. Premi
Bruto untuk tahun underwriting 2007 tercatat
sebesar Rp. 1.858 Milliar, sedangkan tahun
underwriting 2008 adalah Rp. 1.930 milliar. Untuk
tahun underwriting 2009 dan 2010 pendapatan
premi bruto asuransi gempa bumi adalah
sebesar Rp. 1.947 milliar dan Rp. 1.626 milliar.
Angka-angka ini dipastikan akan terus bergerak
naik karena pensesian yang masih terus
berlanjut, terutama untuk tahun underwriting
2009 dan 2010.
Jika mengasumsikan tidak ada pertumbuhan
premi yang berarti pada tahun underwriting 2006,
2007 dan 2008, maka dapat dikatakan bahwa
premi asuransi gempa bumi di tahun underwriting
2007 tumbuh sebesar 4,97% dibanding tahun
2006, sedangkan untuk tahun underwriting 2008
premi tumbuh sebesar 3,87% dari tahun
sebelumnya.
As at December 31, 2010, Based on the report in
Indonesia Insurance Directory 2010 issued by
Bapepam LK- Ministry of Finance, there are 90
insurance companies which consist of 86 general
insurance companies and 4 reinsurance
companies. 20 general insurance companies are
joint venture and the remaining are private
national companies. The four reinsurance
companies are also private national.
C.
Gross Premium Growth
As reflected in the development of Gross
Domistik Product, the growth of the gross
premium of earthquake insurance is in line with
the growth of Indonesian economic every year.
As at December 31 2010, earthquake gross
premium income for underwriting year 2006 is
Rp. 1.770 billions. Gross premium for 2007 was
booked for Rp. 1.858 billions. While underwriting
year 2008 premium is Rp. 1.930 billions. Gross
Premium for underwriting year 2009 and 2010
are Rp. 1.947 billions and Rp. 1.626 billions. This
gross premium income will keep moving up
because
earthquake
cession
continues,
especially for underwriting year 2009 and 2010.
If there is no significant movement on the
underwriting year 2006,2007,and 2008, the
earthquake insurance premium for underwriting
year 2007 would be 4,97% higher than
underwriting year 2006. While premium growth
for underwriting year 2008 is 3,87% higher than
underwriting year 2007.
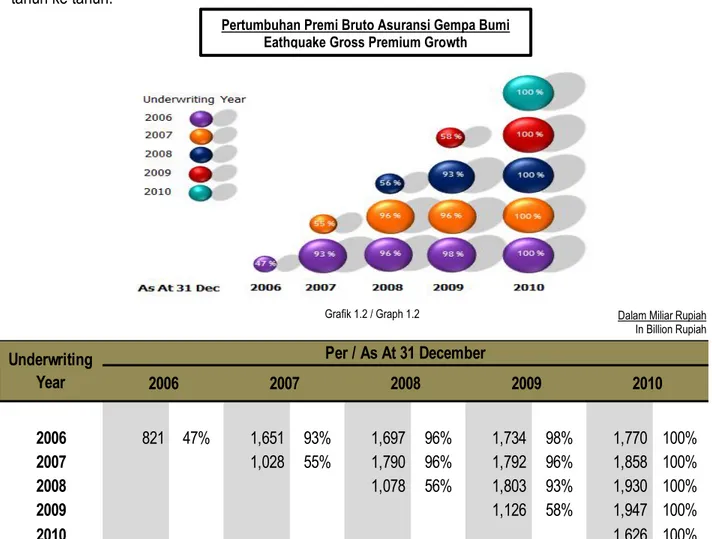
Tabel 1.1 dan grafik 1.2 berikut ini
menggambarkan pertumbuhan premi bruto dari
tahun ke tahun.
Dari tabel dan grafik diatas tampak bahwasannya
pertumbuhan premi bruto asuransi gempa bumi
pada tahun ke dua, untuk setiap tahun
underwriting, rata-rata sudah mencapai lebih dari
90% dari maksimum pertumbuhannya.
Pada setiap tahun underwriting, pelaporan sesi
asuransi gempa bumi di tahun pertama, juga
menunjukkan
peningkatan.
Untuk
tahun
underwriting 2006 tercatat rasio sebesar 47%
dari total premi tahun underwriting tersebut.
Angka ini meningkat tajam di tahun underwriting
2007 menjadi sebesar 55% dan terus menaik di
tahun underwriting 2008 sebesar 56% dan tahun
underwriting 2009 sebesar 58%.
Table 1.1 and graph 1.2 below show gross
premium development from year to year.
The table and graph above shows that, on
average, the growth of gross premium income
reaches over 90% maximum at its second
underwriting year.
For each underwriting year, earthquake
insurance cession report at its first year shows
increament. For underwriting year 2006, the ratio
is only 47% from total. It increased more sharply
than underwriting year 2007 to become 55% and
keeps moving up at 56% for underwriting year
2008 and 58% for underwriting year 2009.
2006
821 47% 1,651 93% 1,697 96% 1,734 98% 1,770 100%
2007
1,028 55% 1,790 96% 1,792 96% 1,858 100%
2008
1,078 56% 1,803 93% 1,930 100%
2009
1,126 58% 1,947 100%
2010
1,626 100%
2007
2006
Underwriting
Year
Per / As At 31 December
2008
2009
2010
Grafik 1.2 / Graph 1.2
Tabel 1.1 / Table 1.1
Dalam Miliar Rupiah
In Billion Rupiah
Pertumbuhan Premi Bruto Asuransi Gempa Bumi
Eathquake Gross Premium Growth
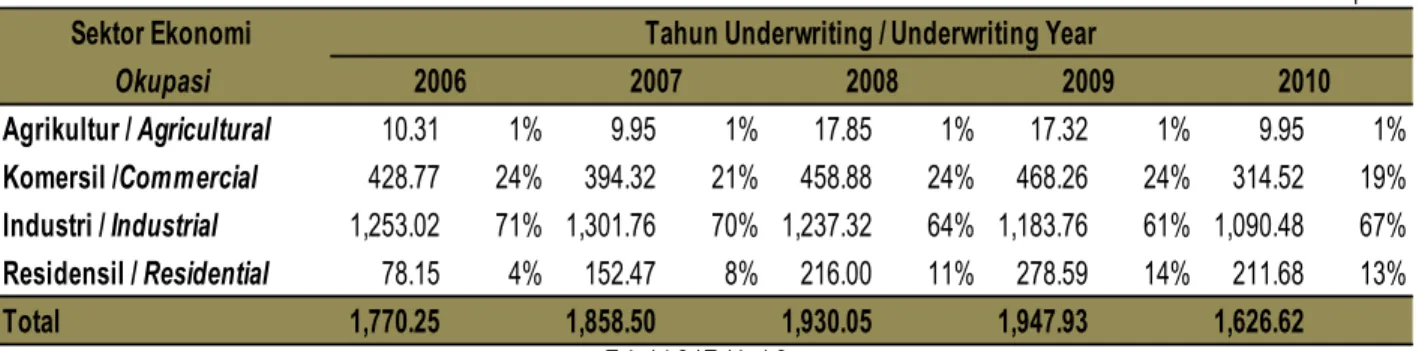
Kontribusi terbesar premi asuransi gempa bumi
yang tercatat sampai dengan 31 Desember 2010
untuk
tiap
tahun
underwriting
masih
menunjukkan tingginya tingkat pendapatan premi
yang diperoleh dari okupasi industri, dengan
rata-rata rasio pendapatan dalam 5 tahun
terakhir underwriting sebesar 66% dari total
premi. Diikuti oleh okupasi komersial dengan
rasio sebesar 23% dan residensial sebesar 10%.
Sedangkan okupasi agrikultural menyumbang
hanya sebesar rata-rata 1% disetiap tahun
underwriting.
Meskipun okupasi agrikultural dan residensial
memberikan kontribusi yang tidak sebesar
okupasi industri ataupun komersial. Namun jika
melihat pertumbuhan premi bruto disetiap tahun
underwriting, kedua okupasi ini mengalami
pertumbuhan premi yang cukup tinggi dan diatas
rata-rata pertumbuhan premi semua okupasi
disetiap tahunnya. Pertumbuhan yang cukup
tinggi dan berlangsung tiap tahun pada okupasi
residensial terjadi, baik itu jumlah maupun rasio
kontribusi pada total pendapatan premi di setiap
tahun underwriting.
Dibanding dengan tahun underwriting 2006,
pendapatan premi bruto dari okupasi residensial
di tahun underwriting 2007 tumbuh hampir dua
kali lipat. Pertumbuhan ini terus berlanjut
meskipun tak sebesar pertumbuhan ditahun
underwriting 2007. Di tahun underwriting 2010,
dimana pensesian masih terus berlangsung,
okupasi ini telah mengumpulkan pendapatan
premi bruto sebesar Rp. 211,68 milliar. Angka ini
diproyeksikan akan terus tumbuh hingga
mencapai Rp. 350 milliar.
Pertumbuhan premi yang cukup tinggi di okupasi
agrikultural terlihat pada tahun underwriting
2008, dimana pendapatan premi tumbuh hampir
80% lebih besar dibanding tahun underwriting
sebelumnya.
Tabel 1.2 berikut ini menyajikan rincian premi
bruto untuk tiap tahun underwriting berdasarkan
okupasi.
As at Desember 31 2010, the highest earthquake
premium contribution for each underwriting year
is coming from industrial occupation, the average
income ratio is 66% for the last five underwriting
years. Followed by commercial occupation with
ratio of 23% and 10% from residential
occupation. The other side, agricultural
occupation contributes only about 1% for each
underwriting year.
Although contributions of agricultural and
residential occupation are not as high as
industrial or commercial, their gross premiums
still increase significantly every year. Their
increaments of each underwriting year are even
above average in all occupations combined. For
residential occupation in each underwriting year,
the significant increase are both on its total gross
premium and its contribution ratio.
The gross premium of residential for underwriting
year 2007 is almost doubled comparing to that of
underwriting year 2006. This growth continued
although it is not as high as in underwriting year
2007. In underwriting year 2010, where cession
continues, this occupation has produced Rp.
211,68 billions of gross premium income. This
figure is projected to grow and reach Rp. 350
billions.
The significant growth in agricultural occupation
is in underwriting year 2008, where premium is
80% higher than previous underwriting year.
This following table 1.2, shows detail gross
premium for the last five years by occupation.
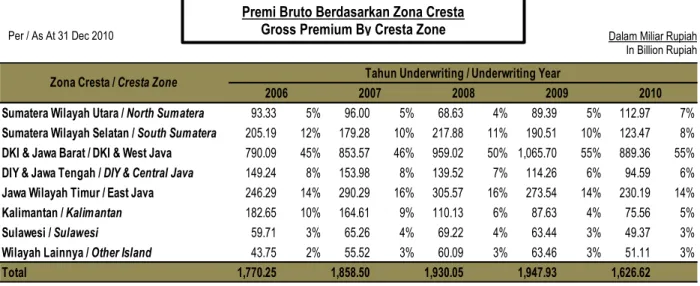
Dilihat dari distribusi premi berdasarkan cresta
zone dalam 5 tahun underwriting terakhir,
penyebaran risiko gempa bumi masih terpusat di
zona 3 (DKI Jakarta dan Jawa Barat). Meskipun
pendapatan premi masih terus dapat berubah
dikarenakan pensesian masih terus berlangsung,
namun terlihat tingkat rasio pada zona 3 ini terus
beranjak naik dari 45% pada tahun underwriting
2006 menjadi 55% di tahun underwriting 2010
dengan rata-rata tiap tahun underwriting sebesar
50%.
Jika zona 3 terus bertambah naik, penurunan
justru terjadi pada zona 6 (Kalimantan).
Penurunan ini tampak secara rasio maupun
jumlah pendapatan premi brutonya, hal ini terlihat
Dari tahun underwriting 2006-2008, dimana pada
ketiga tahun underwriting ini, premi tidak akan
banyak berubah. Pada tahun underwriting 2006,
zona ini memberikan kontribusi sebesar 10%.
Tingkat rasio ini terus turun pada setiap
tahunnya, hingga hanya mencapai sebesar 5%
pada tahun underwriting 2010.
Pada zona lain, rasio distribusi premi untuk tiap
tahun underwriting terlihat stabil. Seperti yang
terlihat pada tabel 1.3 berikut ini.
The premium distribution based on cresta zone
for the last last 5 underwriting years is centralized
in zone 3 (DKI Jakarta and West Java). The ratio
is growing from 45% in underwriting year 2006 to
55% in underwriting year 2010 with the average
of 50% each year. This is due to the cessions are
still in process.
While zone 3 is increasing, the decrease on the
other hand occurred on zone 6 (Kalimantan) on
both ratio and its earthquake gross premium.
Underwriting year data of 2006 – 2008 shows the
decrease, where gross premium for these
underwriting years remain steady. On
underwriting year 2006, this zone contributes
10%. This contribution ratio keeps decreasing
each underwriting year until only 5% contribution
ratio on underwriting year 2010.
On the other zones, premium distribution ratio for
each underwriting year seems consistent as
shown in table 1.3 below.
Agrikultur /
Agricultural
10.31
1%
9.95
1%
17.85
1%
17.32
1%
9.95
1%
Komersil /
Commercial
428.77
24%
394.32
21%
458.88
24%
468.26
24%
314.52
19%
Industri /
Industrial
1,253.02
71% 1,301.76
70% 1,237.32
64% 1,183.76
61% 1,090.48
67%
Residensil /
Residential
78.15
4%
152.47
8%
216.00
11%
278.59
14%
211.68
13%
Total
1,770.25
1,858.50
1,930.05
1,947.93
1,626.62
Sektor Ekonomi
Okupasi
2006
2007
2008
2009
2010
Tahun Underwriting / Underwriting Year
Premi Bruto Berdasarkan Okupasi
Gross Premium By Occupation
Dalam Miliar Rupiah
In Billion Rupiah
Tabel 1.2 / Table 1.2
Per / As At 31 Dec 2010
D.
Jumlah Risiko
Seiring dengan pertumbuhan jumlah premi bruto
yang terus meningkat, jumlah risiko asuransi
gempa bumi juga terus meningkat. Dari keempat
okupasi yang ada, peningkatan yang cukup
berarti terlihat pada okupasi residensial.
Tabel dibawah ini menyajikan jumlah risiko,
namun tidak termasuk risiko multilokasi yg tidak
lengkap datanya. Dimana kami kesulitan
memisahkannya untuk menjadi satu risiko.
Pertumbuhan gross premi yang terus meningkat
pada okupasi residensial, tampak pada tabel
diatas, pertumbuhan ini diiringi dengan
peningkatan jumlah risikonya. Baik itu di tahun
underwriting 2006, 2007, 2008 dan 2009.
D.
Number of Risks
The gross premium of earthquake insurance
grows as well as the number of earthquake risk.
The growth of gross premium in residential keeps
increasing as shown in the above table.
This following table shows earthquake number of
risks, excluding unidetified multi location risks. As
we see it is difficult to separate them into single
risk.
The gross premium grow is increasing on
residential occupation, as shown by the above
table. This growth is in line with the number of
risks on residential occupation in underwriting
year 2006, 2007, 2008 and 2009.
Sumatera Wilayah Utara /
North Sumatera
93.33
5%
96.00
5%
68.63
4%
89.39
5%
112.97
7%
Sumatera Wilayah Selatan /
South Sumatera
205.19
12%
179.28
10%
217.88
11%
190.51
10%
123.47
8%
DKI & Jawa Barat / DKI & West Java
790.09
45%
853.57
46%
959.02
50% 1,065.70
55%
889.36
55%
DIY & Jawa Tengah /
DIY & Central Java
149.24
8%
153.98
8%
139.52
7%
114.26
6%
94.59
6%
Jawa Wilayah Timur / East Java
246.29
14%
290.29
16%
305.57
16%
273.54
14%
230.19
14%
Kalimantan /
Kalimantan
182.65
10%
164.61
9%
110.13
6%
87.63
4%
75.56
5%
Sulawesi /
Sulawesi
59.71
3%
65.26
4%
69.22
4%
63.44
3%
49.37
3%
Wilayah Lainnya /
Other Island
43.75
2%
55.52
3%
60.09
3%
63.46
3%
51.11
3%
Total
1,770.25
1,858.50
1,930.05
1,947.93
1,626.62
Zona Cresta /
Cresta Zone
2006
2007
2008
2009
2010
Tahun Underwriting / Underwriting Year
Premi Bruto Berdasarkan Zona Cresta
Gross Premium By Cresta Zone
Dalam Miliar Rupiah
In Billion Rupiah
Per / As At 31 Dec 2010
Tabel 1.4 / Table 1.4
Agricultural
464
100%
414
89%
626
135%
409
88%
228
49%
Commercial
38,231
100%
39,128
102%
65,009
170%
56,713
148%
46,101
121%
Industrial
9,236
100%
11,746
127%
9,773
106%
11,791
128%
9,418
102%
Residential
23,680
100%
31,594
133%
36,070
152%
41,414
175%
36,128
153%
Total
71,611
82,882
111,478
110,327
91,875
Okupasi
2006
2007
2008
2009
2010
Tahun Underwriting / Underwriting Year
Pertumbuhan Jumlah Risiko Asuransi Gempa Bumi
Earthquake Insurance Risk Number Development
Tabel 1.3 / Table 1.3
Per / As At 31 Dec 2010
Dalam Miliar Rupiah
In Billion Rupiah
Peningkatan jumlah risiko juga dialami oleh
okupasi komersial, meskipun dilihat dari tingkat
pertumbuhan pendapatan premi brutonya
tidaklah terlalu berubah banyak.
E.
Kontribusi Asuransi Gempa Bumi
Pertumbuhan yang dialami ekonomi Indonesia
juga tampak dari pertumbuhan industri asuransi,
baik itu asuransi jiwa maupun asuransi kerugian.
Dalam catatan terakhir yang dikeluarkan oleh
Biro Perasuransian Bapepam LK, dalam buku
Perasuransian
Indonesia
2009,
tercatat
penerimaan premi bruto asuransi di tahun 2009
meningkat
sebesar
17,9%
dari
tahun
sebelumnya menjadi Rp. 106,4 triliun. Rasio
antara premi bruto terhadap Produk Domestik
Bruto sebesar 1,9%.
Pada tahun 2009, Asuransi kerugian dan
reasuransi mencatat premi bruto sebesar Rp.
25.07 triliun, atau meningkat sebesar 6,08% dari
tahun 2008. Di lini usaha asuransi properti
sendiri pendapatan premi bruto tumbuh sebesar
4% menjadi Rp. 7,72 triliun.
Asuransi gempa bumi merupakan bagian dari
asuransi properti. Sebelumnya, asuransi gempa
bumi
hanyalah
merupakan
perluasan
(ekstension) atas polis asuransi properti, namun
sejak tahun 2007 telah ada Polis Standar
Asuransi Gempa Bumi Indonesia (PSAGBI) yang
memungkinkan asuransi gempa bumi ditutup
secara terpisah.
Dengan memproyeksi pendapatan premi bruto
asuransi gempa bumi untuk tahun 2009 dan
2010, maka rata-rata kontribusi asuransi gempa
bumi terhadap produk domistik bruto dalam lima
tahun terakhir adalah sebesar 0,04%.
Sedangkan, kontribusi asuransi gempa bumi
terhadap penutupan asuransi property dalam
lima tahun terakhir adalah sebesar 27,54%. Atau,
dari tiga sampai empat penutupan asuransi
property terdapat satu penutupan asuransi
gempa bumi, baik itu yang hanya merupakan
The growth of number of risk also occurs in
commercial occupation, despite less change in
the premium.
E.
Earthquake Insurance Contribution
Indonesian economic growth is reflected on its
insurance industry’s growth. On last publications
of Indonesia Insurance 2009 issued by
Indonesian Insurance Bureau, the gross premium
for 2009 rose 17,9% to become Rp. 106,4 trillion.
The ratio of gross premium to gross domestic
product is about 1,9%.
In 2009, gross premium of general insurance and
reinsurance is Rp. 25,07 trillion, or increase for
6,08% from 2008. For property insurance itself,
the gross premium increases for 4% than
previous year and become Rp. 7,72 trillions.
Earthquake insurance is a part of property
insurance. At the beginning, earthquake
insurance is only an extension of property
insurance policy. Since 2007, there is Indonesian
Earthquake Insurance Standard Policy which
enables earthquake insurance policy to be
covered separately.
By projecting earthquake gross premium for year
2009 and 2010, the average earthquake
contribution to gross domestic product for the last
five years is about 0,04%. While, earthquake
contribution to property insurance for the last five
years is around 27,54%, it means that in every
three or four property insurance issued, there is
one earthquake cover, whether it is as a property
insurance extension or a stand-alone policy.
perluasan dari polis property maupun penutupan
yang berdiri sendiri.
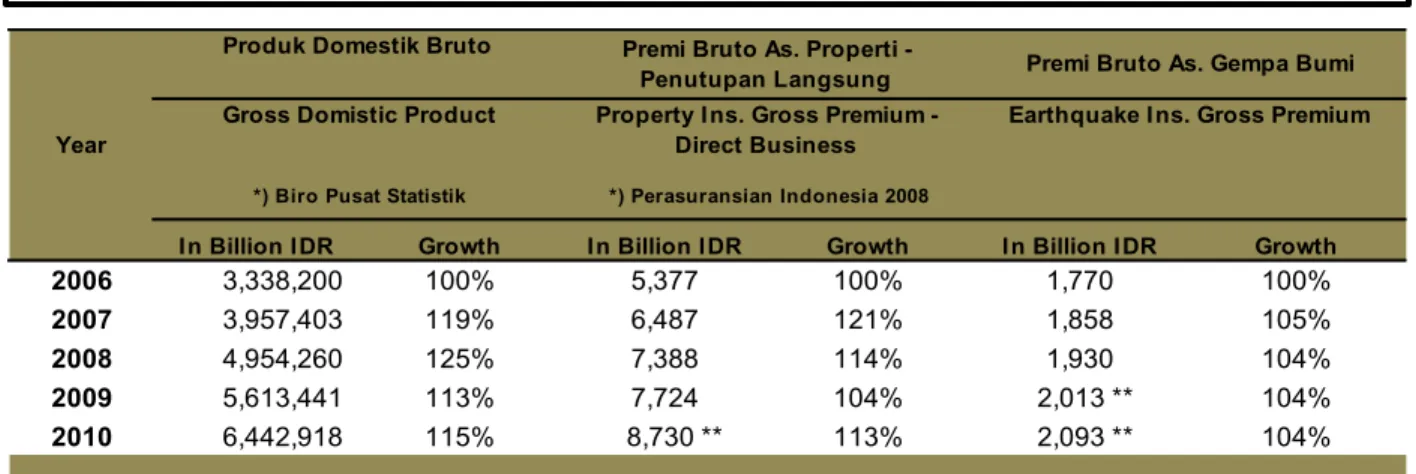
Produk Domestik Bruto, Premi Bruto Asuransi
Property yang bersumber dari penutupan
langsung serta Premi Bruto Asuransi Gempa
Bumi selama 2006 hingga 2010, dapat dilihat di
tabel 1.5 berikut.
Seperti yang terlihat dari penyebaran asuransi
gempa bumi berdasarkan zona cresta, ternyata
cresta 3 adalah pusat dari penyebaran asuransi
gempa bumi di Indonesia. Jika dilihat per provinsi
maka Provinsi DKI Jakarta, Jawa Barat dan
Banten yang merupakan bagian dari cresta 3,
adalah pusat-pusat provinsi asuransi gempa
bumi. Dalam lima tahun terakhir,masing-masing
provinsi tersebut menyumbang rata-rata sebesar
20%,17% dan 10% dari total pendapatan premi
asuransi gempa bumi nasional. Diikuti oleh
Provinsi Jawa Timur yang mencatat kontribusi
sebesar rata-rata 14% dan Jawa Tengah dengan
kontribusi rata-rata sebesar 7%.
Di kepulauan Sumatera, Provinsi Riau, dengan
pendapatan premi yang besar dari industri gas,
minyak bumi serta kertas, mencatatkan diri
sebagai penyumbang terbesar premi asuransi
gempa bumi di kepulauan ini. Dengan kontribusi
sebesar 4,24%, diikuti oleh provinsi sumatera
Gross Domestic Product, gross property
premium income from direct business and
earthquake gross premium from 2006 to 2010
are shown in table 1.5 below:
As we can see the spread of the earthquake
insurance by cresta zone, cresta 3 is the central
spread of the Indonesian insurance. If we see the
insurance earthquake spread by province,
province of DKI Jakarta, West Java and Banten
(all are in cresta 3) are the central province of
earthquake insurance. Within the last five years,
each province contribute the average of
20%,17%, and 10% of total national earthquake
insurance premium. It is followed by province of
East Java which contributed the average of 14%,
and Central Java with the average of 7%.
In Sumatera Island, Riau Province with gross
premium income from oil, gas and pulp industries
is the biggest producer of earthquake gross
premium within this island. It contributes about
4,24%, followed by North Sumatera Province
3,68% ,South Sumatera 2,4% and Lampung
1,35%.
In Billion IDR
Growth
In Billion IDR
Growth
In Billion IDR
Growth
2006
3,338,200
100%
5,377
100%
1,770
100%
2007
3,957,403
119%
6,487
121%
1,858
105%
2008
4,954,260
125%
7,388
114%
1,930
104%
2009
5,613,441
113%
7,724
104%
2,013 **
104%
2010
6,442,918
115%
8,730 **
113%
2,093 **
104%
Year
Premi Bruto As. Gempa Bumi
Earthquake Ins. Gross Premium
Produk Domestik Bruto
Gross Domistic Product
*) Biro Pusat Statistik
Premi Bruto As. Properti -
Penutupan Langsung
Property Ins. Gross Premium -
Direct Business
*) Perasuransian Indonesia 2008
Tabel 1.5 / Table 1.5
**) Nilai proyeksi / Projection value
Produk Domistik Bruto,Premi Bruto Asuransi Property dan Premi Bruto Asuransi Gempa Bumi 2006 – 2010
Gross Domestic Product, Property Gross Premium, and Earthquake Gross Premium 2006 - 2010
utara 3,68%, sumatera selatan 2,4% dan
lampung 1,35%.
Dari Pulau Kalimantan, Provinsi Kalimantan
Timur merupakan penyumbang terbesar
terhadap pendapatan premi asuransi gempa
bumi dengan rasio sebesar 5,49% diikuti oleh
Kalimantan tengah sebesar 1,52%.
Tabel 1.6 dibawah ini menyajikan kontribusi
pendapatan premi asuransi gempa bumi yang
dibagi berdasarkan provinsi, catatan per tanggal
31 Desember 2010.
In Kalimantan Island, province of East
Kalimantan is top producer with 5,49%
contribution. It is followed by Central Kalimantan
which contributes about 1,52%.
This following table 1.6 shows earthquake
insurance contribution by province, as at
December 31, 2010.
2006 % 2007 % 2008 % 2009 % 2010 %
1 Nanggroe Aceh Darussalam 26,797 1.51 28,766 1.55 6,285 0.33 9,523 0.49 13,787 0.85 2 Sumatera Utara 66,528 3.76 67,234 3.62 62,342 3.23 79,865 4.10 99,186 6.10 3 Sumatera Barat 13,122 0.74 10,457 0.56 20,579 1.07 17,844 0.92 19,372 1.19 4 Riau 103,014 5.82 73,556 3.96 94,743 4.91 44,412 2.28 25,528 1.57 5 Jambi 4,452 0.25 4,062 0.22 5,024 0.26 33,238 1.71 3,155 0.19 6 Sumatera Selatan 54,983 3.11 51,470 2.77 35,475 1.84 37,427 1.92 26,717 1.64 7 Bengkulu 1,243 0.07 2,372 0.13 6,069 0.31 5,465 0.28 4,486 0.28 8 Lampung 15,867 0.90 20,423 1.10 35,129 1.82 30,702 1.58 28,992 1.78 9 Kepulauan Bangka Belitung 678 0.04 474 0.03 3,340 0.17 4,231 0.22 1,261 0.08 10 Kepulauan Riau 11,832 0.67 16,464 0.89 17,519 0.91 17,190 0.88 13,964 0.86 11 DKI Jakarta 333,909 18.86 353,233 19.01 427,032 22.13 449,634 23.08 304,816 18.74 12 Jaw a Barat 285,327 16.12 326,322 17.56 337,069 17.46 399,064 20.49 321,468 19.76 13 Jaw a Tengah 143,560 8.11 147,234 7.92 126,934 6.58 99,503 5.11 81,030 4.98 14 DI. Yogy akarta 5,676 0.32 6,745 0.36 12,591 0.65 14,756 0.76 13,563 0.83 15 Jaw a Timur 246,293 13.91 290,293 15.62 305,570 15.83 273,542 14.04 230,187 14.15 16 Banten 170,851 9.65 174,015 9.36 194,914 10.10 217,004 11.14 263,074 16.17 17 Bali 27,034 1.53 33,226 1.79 47,326 2.45 53,093 2.73 41,228 2.53 18 Kalimantan Barat 1,655 0.09 1,816 0.10 3,267 0.17 4,165 0.21 2,218 0.14 19 Kalimantan Tengah 19,095 1.08 25,171 1.35 45,856 2.38 24,417 1.25 12,779 0.79 20 Kalimantan Selatan 2,777 0.16 2,777 0.15 3,602 0.19 5,438 0.28 3,784 0.23 21 Kalimantan Timur 159,119 8.99 134,843 7.26 57,406 2.97 53,611 2.75 56,777 3.49 22 Sulaw esi Utara 4,156 0.23 5,212 0.28 5,831 0.30 10,735 0.55 8,080 0.50 23 Sulaw esi Tengah 1,004 0.06 1,572 0.08 1,837 0.10 1,551 0.08 1,284 0.08 24 Sulaw esi Selatan 17,142 0.97 23,365 1.26 24,325 1.26 25,666 1.32 12,817 0.79 25 Sulaw esi Tenggara 36,896 2.08 34,445 1.85 36,385 1.89 8,811 0.45 9,484 0.58 26 Gorontalo 466 0.03 575 0.03 725 0.04 16,025 0.82 17,233 1.06 27 Sulaw esi Barat 53 0.00 86 0.00 118 0.01 651 0.03 474 0.03 28 Nusa Tenggara Barat 1,965 0.11 3,819 0.21 2,916 0.15 2,703 0.14 2,643 0.16 29 Nusa Tenggara Timur 656 0.04 531 0.03 736 0.04 885 0.05 973 0.06 30 Maluku 986 0.06 534 0.03 507 0.03 877 0.05 1,408 0.09 31 Maluku Utara 51 0.00 706 0.04 734 0.04 572 0.03 414 0.03 32 Papua Barat 1,040 0.06 1,169 0.06 1,376 0.07 1,617 0.08 1,678 0.10 33 Papua 12,020 0.68 15,539 0.84 6,490 0.34 3,717 0.19 2,765 0.17
Provinsi / Province
Premi Bruto As. Gempa Bumi Earthquake Insurance Gross Premium
*) As at 31 Dec 2010 Underwriting Year