1 THE IMPACT OF LOCAL GOVERNMENT SPENDING FOR EDUCATION,
HEALTH, AND INFRASTRUCTURE TO HUMAN DEVELOPMENT INDEX IN EAST JAVA - INDONESIA
Ventina Natra Permata Gustin Tanggulungan, SE.,M.Acc,CA.
Email : [email protected]
Satya Wacana Christian University
Abstract : This study aims to examine whether the allocation of government spending for education, health, and infrastructure in East Java local government has influence on the level of public welfare as measured by the Human Development Index (HDI). The data are secondary data i.e. the by function budget realization report on DJPK website and HDI data on BPS website for 28 local government in East Java in 2010 and 2011. Data was analyzed statistially by multiple regression of a panel data that is processed with Stata 11.0 version. The result showed that local government spending on education and infrastructure have influence to public welfare but not so with health spending. The constitution mandate to allocate 20% budget for education function has been implemented by all local governments. But the mandate to allocate 10% budget for health function has not been fulfilled by 14 local governments.
Keywords : Budget, education, health, infrastructure, HDI.
INTRODUCTION
As agreed in the Summit in 2000, the MDG's goals by 2015 is the human development programs through poverty alleviation / hunger and improving health, education, and the environment. One measure of this achievement is the Human Development Index. Measurements with HDI includes three components that are considered fundamental to human and operationally capable of producing a measure that describes the efforts of human development, namely the health index, education index and economic index.
According to UNDP data, Indonesia's HDI in 2011 was 0.678 and was ranked 108 out of 187 countries (http://hdr.undp.org). The number of poor in that year was 30.02 million or 12.49 percent (http://www.bps.go.id/). Although it has improved from year to year, but Indonesian HDI was still below of 0.683 which is an average HDI in East Asia and Asia Pacific countries http://www.tempo.co). Government spending in fiscal policy is one of the instruments to improve the social welfare. Spending allocation on item as indicators of human welfare (education, health, and infrastructure as a driver of economy) should be allocated sufficient to boost the level of social welfare. The policy can be seen in the report of government's budget realization based on its functions.
2
provincial level in Indonesia for the period 2007-2008 shows a positive influence of education spending to the HDI but health spending was not proven influence on HDI.
According to the Central Bereau of Statistics (BPS), East Java is the region with the highest number of poor in Indonesia in 2010 and 2011. However, it has largest on percentage decline in poverty from 2010 to 2011, which is amounted to 3, 28 percent (http://www.rmol.co). This study aimed to examine whether the allocation of East Java local government spending to sector that becomes indicators of public welfare influence the level of public welfare. Thus the research problem of this study is "whether the budget policies of education, health, and infrastructure by local governments and municipalities in East Java influence the level of public welfare of East Java in the period 2010 to 2011?". This study difference from previous study in terms of location, the period of observation, and the use of indicators of economic spending that was used the number of infrastructure spending.This study is expected to be taken into consideration in evaluation and planning activities by the public executive as well as a reference for related studies.
LITERATURE REVIEW AND HYPOTHESIS Public Welfare
Public welfare is defined as a fulfilment of adequacy and quality of people's basic needs (such as food, clothing, shelter, health, education, employment), and other basic needs (such as a clean environment, safety, and society comfortable ), as well as the fulfillment of human rights and participation, as well as the establishment of religious society (www.menkokesra.go.id).
TABLE 1
The HDI dimensions and Indicator
Dimensions Indicator Index
Dimensions
Life Expectancy Index (LEI)
index of population health and
longevity Health Index
Education Index (EI) 1. the adult literacy rate Education Index 2. enrollment ratio
Standard of Living
Index domestic product per capita
Economic index Source : SUSENAS 2002, 2005, 2008
Technically HDI calculation can be formulated as follows:
HDI = 1/3 (indeks X1 + indeks X2 + indeks X3)
Where : X1 = Life Expectancy Index (tahun) X2 = Education Index (EL)
X3 = Standard of Living Index
3
knowledgeable and have a decent standard of living (http://hdr.undp.org) . UNDP introduced the Human Development Index (HDI) as a tool to measure the level of public welfare. HDI was first introduced in 1990 and was developed by Nobel Prize winner Amartya Sen from India and an economist Mahbub Ul Haq from Pakistan, assisted by Gustav Ranis. HDI is a composite index of education index, health index and economic index (http://digilib.its.ac.id). These three indicator are considered fundamental to human and operationally capable of producing a measure of achievement of human development program. The HDI dimension and indicators are as shown in Table 1.
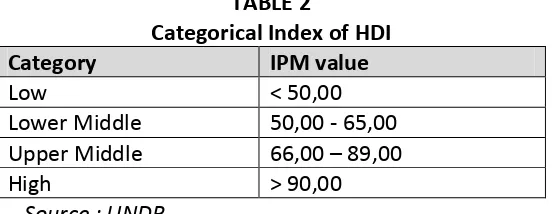
HDI for the government can be an indicator of performance on improving the quality of human life and provide guidance as well as an overview of policy formulation and determination of appropriate development programs to improve the public welfare. According to UNDP, HDI category are as presented in Table 2 ((http://www.undp.or.id).
TABLE 2
Categorical Index of HDI
Category IPM value
Low < 50,00
Lower Middle 50,00 - 65,00
Upper Middle 66,00 – 89,00
High > 90,00
Source : UNDP
Government Spending
Government spending is all the expenditure of the State Treasury / area reduces current equity funds in the corresponding period of the fiscal year which will not obtain payment back by the government(Government Regulation No. 24 of 2005). Spending according to by function classification is used as the basis for performance-based budgeting in order to obtain maximum benefit. By function spending clasification is implemented in order to achieve the goals of national development
According to the Government Accounting Standards Statement No. 2, the disclosure of government spending can be classified according to the function that the main functions of the central government / local in providing services to the public. Details of State spending by function adapted to the duties of each Ministry / Agency consisting of public services, defense, public order and security, economy, environment, housing and public facilities, health, tourism, culture, religion, education and social protection. Programs and activities of the state ministries / agencies / SKPDs geared to achieving results and outcomes that have been established in accordance with the work plan of government (Technical Bulletin 04 of Government Regulation No. 24 of 2005).
Education Spending
4
must work out and organize the national education system (Constitution 1945 chapter 31). Education spending in local government is all expenditure for education in the area. According to Law No. 20 of 2003, the state budget allocation for education, excluding salaries of educators and official expenses amounted to twenty percent of the state budget / local budget. It has also been confirmed by the Constitutional Court Decision No. 13 / PUU-VI I 2008. That amount is expected to realize a program of education and human resources by the government.
Health Spending
Health is a healthy condition, includes physical, mental, spiritual and social that allows a person to live as socially and economically productive (Act No. 36 of 2009 Article 1, paragraph 1). The government set a goal of health development is to increase awareness, willingness, and ability to live a healthy life for every person to achieve a high degree of public health, as an investment for the human resources development as socially and economically productive (Act No. 36 of 2009 Section 3). Health expenditure is the expenditure of central government// regions to achieve public health Health expenditure is the expenditure of state /local government to achieve public health.
Law No. 36 of 2009 establishes the amount of budget allocations for health expenditures, excluding salaries, is a minimum of five percent (5%) of the state budget and for local governments by at least ten percent (10%) of the budget. According to Article 171, paragraph 2 of the Act, the local government that has set budget allocation more than ten percent are not expected to decrease the amount, while local government that have not been able to reach that amount should implement it gradually. The amount of the expenditure allocation statutes intended to realize the provision of public services for improving the quality of public health.
Infrastructure Spending
Infrastructure is a useful element for the overall functioning of the economy by facilitating the circulation of goods, people and ideas (http://lontar.ui.ac.id). The infrastructure spending is intended as all the expenses of the state / local government to finance the procurement and maintenance of state/local government infrastructure. According to Kessides (1993), there are several benefits of the infrastructure for economy, such as reducing the cost of production, expand employment and consumption as it open access to isolated areas, and maintain macroeconomic stability through infrastructure investment that can create employment and improve the consumers purchasing power.
5
According to IMF working paper, in previous studies, there are five components of expenditure that affect the state growth, they are defense spending, transport and communication, health, education, and social protection. However, recent studies claim that education spending, infrastructure, defense, and health are influence the growth, but protection spending is not directly influence it (http://www.imf.org). Infrastructure spending to housing and public facilities which consists of the activities of public works and housing is reported in the Alignment and Integration Affairs of Local Government and Functions.
Effect of Education Expenditure to Public Welfare
The level of education can be an indicator of nation development, because good quality education is one of human capital initial to survive and compete in the global world. The government has set a minimum percentage of local spending allocation for education program is twenty percent. These quantities exclude salaries of educators and official. It is expected to improve the quality of public education for all levels. Budget are allocated to various program including a nine-year compulsory schooling facilities for free and scholarships for underprivileged children and bright students. There are also facilities such as mobile libraries, county libraries, and public libraries.
Zul study (2013) showed the positive effect of education spending on IPM in four ASEAN countries, namely Indonesia, Malaysia, the Philippines, and Thailand in the period 2007-2011. Simpson et al (2012) research also showed that education spending significant effect on the HDI in all provinces in Indonesia in the period 2007 to 2008. Similarly to Maryani study (2010), at local government in Central Java province in 2007-2009, it showed the positive influence of education spending to IPM in local government. Based on that, it formulated the following hypotheses:
H1: Education spending in East Java local governemnt has positive influence on public welfare
Effect of Health Spending to Public Welfare
Health is the initial capital for everyone to its activities. State budget for health program, except salaries be regulated at least five percent of state budget, while local government budgets is minimum ten percent (Act No. 36 of 2009). The budget allocation is intended to improve the quality of health care facilities and infrastructure for the whole society. Some of the free health care has been provided include health insurance, health insurance, and guarantee delivery. The program is expected to improve the quality of public health, which would certainly have an impact on the human development index values. But Astri et al (2012) studies at the provincial level in Indonesia for the period 2007-2008 shows government spending for health program does not affect the HDI.
6
welfare in East Java, which in 2011 had the largest percentage decline in poverty. Thus, it formulated the following hypotheses:
H2: health spending has positive influence on public welfare in East Java
Effect of Infrastructure Spending on Social Welfare
Infrastructure is required on each attempt to increase production, the expansion of trade, population distribution, poverty reduction and the improvement of environmental conditions (lontar.ui.ac.id). Infrastructure required for the economy that is expanding employment opportunities and encouraging consumption due to open access to isolated areas (Kessides, 1993). Infrastructure investment is indispensable for power and highways.Minimal infrastructure condition assessed by investors as a major obstacle to foreign investment in Indonesia. Infrastructure necessary to create centers of economic activity such as industry and new market for new jobs opportunities. Creation of employment opportunities will ultimately improve the quality of people's lives.
Ade (2013) study showed that infrastructure spending has positive influence on IPM in four ASEAN countries, namely Indonesia, Malaysia, the Philippines, and Thalailand on 2007-2011 period. Government infrastructure spending in the Report Alignment and Integration Affairs Local Government and Financial Management functions in the framework of the State, is part of the expenditure of housing and public facilities consisting of public works and housing. Presumed that housing and public facilities spending have positive effect on public welfare on in East Java region. Thus formulated the following hypotheses:
H3: Infrastructure spending have positive effect to public welfare in East Java region
RESEARCH METHODS
7 Operational Definition and Measurement of Variables
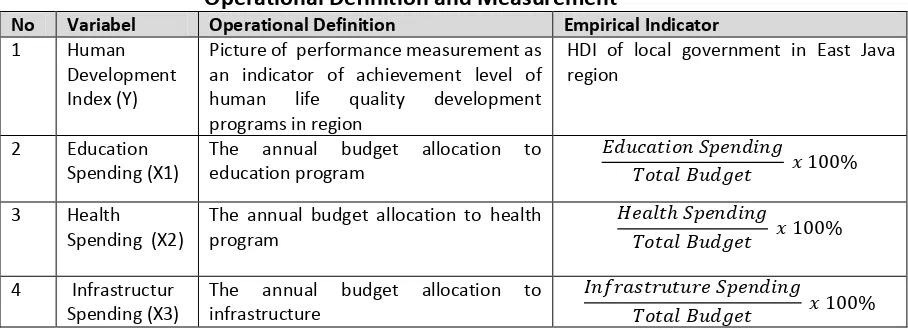
The operational definition and measurement of variables are presented in Table 3
TABLE 3
Operational Definition and Measurement
No Variabel Operational Definition Empirical Indicator
1 Human Development Index (Y)
Picture of performance measurement as an indicator of achievement level of human life quality development programs in region
HDI of local government in East Java region
2 Education Spending (X1)
The annual budget allocation to education program
� � � �
�� � � %
3 Health Spending (X2)
The annual budget allocation to health program
�� ℎ �
�� � � %
4 Infrastructur Spending (X3)
The annual budget allocation to infrastructure
� �
�� � � %
A statistical analysis of multiple regression with panel data was employed in this research. Data processing by Stata program version 11.0.
Regression Model is :
Yk, t = α + β X k, t + β X k, t + β X k, t + σk, t + ek, t
Where :
Y = Human Development Index
k,t = local government, year
α = constant
X1 = Education Spending X2 = Health Spending
X3 = Infrastructure Spending
e = Error
β1,β2,β3 = Coefisien regression of independen variable σ = Individual effect
Hypothesis Testing
Basic Assumptions Statistics a. Multicollinearity
This test is done to look at the linear relationship between some or all of the independent variables in the regression model. Multikoliniearitas testing can be detected by looking at the correlation matrix. With guidance if the correlation between the independent variables is less than 0.8, it can be said there is no multikoliniearitas. In appendix 6 Table 1, indicating no multikoleniaritas, as the value of the independent variable is less than 0.8.
b. Heteroskidastity
8
the significance of less than 0.05, which indicates the presence heteroskesdatisitas 0,000. However, by using robust, the standard error of each independent variable becomes invalid so that even though there will not be a problem heteroskesdatisitas because standard error remain valid (appendix 6 tables 3 and 4).
c. Autokolerasi
Autokolerasi problem occurs when there is serial correlation between the error. In appendix 6 tables 5 and 6 revealed that the test results showed no autocorelation
Fixed Effect And Random Effect Test
In panel data models there are individual effects panel data that can not be investigated by researchers. Individual effects affecting the independent variable, which will also have an impact on the influence of the independent variables on the dependent variable. Fix effect assumes that each independent variable has the same characteristics. Whereas random effect assumes that each independent variable has different characteristics.
The government has set up on the allocation of education spending for the district and the city of at least 20 percent of the budget and health spending at least 10 percent of the budget. However, in reality not all local governments in East Java comply with these regulations. All local governments are bound by government regulations so that there is a fixed effect, but in reality there are differences in compliance between governments in eastern Java so no random effect. Based on the testing fixed effects and random effects seen both of them did not address significant differences (annex 6 tables 3 and 4) so that the effect of individual problems can be ignored. Therefore, the test is done by calculating the fixed effect and random effect.
Partial test
Partial statistical test used to see whether individually each of the independent variables (education spending, health spending, and spending on infrastructure) could significantly explain the dependent variable (HDI).
Regression Equation Test
This test is intended to test whether all the independent variables simultaneously affect the dependent variable. The test is performed with the F distribution at a rate of 95% and a significance level of 5%.
Coefficient of Determination Test (R²)
This test is intended to test the extent of variation of the dependent variable can be explained by the independent variables.
RESULTS AND DISCUSSION Descriptive Statistics
9
than 50 percent) indicate no significant variation in the data. This means that the human development index in 2010 to 2011 is not varied.
TABEL 4 Descriptive Statistics
N Minimum Maximum Mean Std. Deviation
HDI 56 62.94 77.89 71.8 3.997
Education Spending 56 22% 56% 44.15 8.599
Health Spending 56 4% 26% 11.1 3,838
Infrastructure Spending 56 2% 23% 9.19 3.589
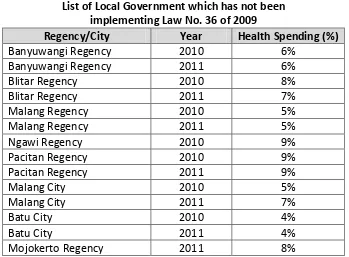
On Table 4, percent standard deviation from the mean of all variables is less than 50 percent, meaning there is no great variation in the data. The lowest HDI in Local Government in East Java classified under the category of medium, in this case is the regency in 2010. While the highest HDI is in Blitar in 2011 with HDI at 77.89 with the middle and upper categories. The minimum value of education spending is 22 percent greater than the provisions of 20 percent indicates that the rules have been complied with all local governments. For health spending, the minimum percentage of 4 percent indicated that local governments still have not implemented the provisions of Law No. 36 of 2009. Local governments that have not implemented the legislation can be seen in Table 5.
TABLE 5
List of Local Government which has not been implementing Law No. 36 of 2009
Regency/City Year Health Spending (%)
Banyuwangi Regency 2010 6%
Banyuwangi Regency 2011 6%
Blitar Regency 2010 8%
Blitar Regency 2011 7%
Malang Regency 2010 5%
Malang Regency 2011 5%
Ngawi Regency 2010 9%
Pacitan Regency 2010 9%
Pacitan Regency 2011 9%
Malang City 2010 5%
Malang City 2011 7%
Batu City 2010 4%
Batu City 2011 4%
Mojokerto Regency 2011 8%
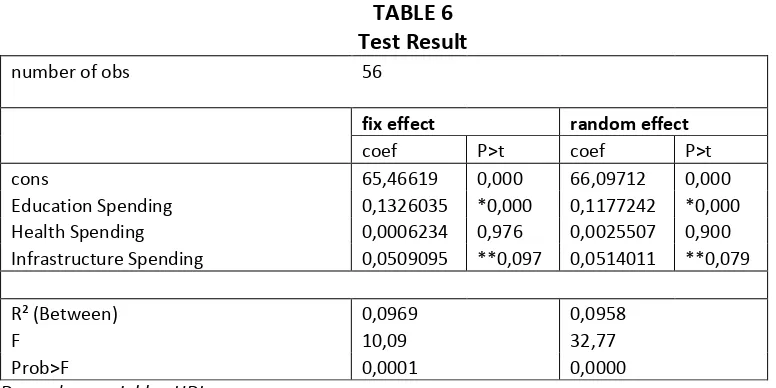
Testing Multiple Regression Model
10 TABLE 6
Test Result
number of obs 56
fix effect random effect
coef P>t coef P>t
cons 65,46619 0,000 66,09712 0,000
Education Spending 0,1326035 *0,000 0,1177242 *0,000 Health Spending 0,0006234 0,976 0,0025507 0,900 Infrastructure Spending 0,0509095 **0,097 0,0514011 **0,079
R² (Between) 0,0969 0,0958
F 10,09 32,77
Prob>F 0,0001 0,0000
Dependent variable : HDI Signifikan :*) 0,05, **) 0,10
Source: Secondary data processed, 2014
Based on Table 6, by using the fixed effect of the multiple linear regression equation was formulated as follows:
Y =65,44619+0,1326035 X1+0,006234X2+0,0509095X3
And for random effects of multiple linear regression equation was formulated as follows:
Y =66,09712+0,1177241 X1+0,0025507X2+0,0514011X3
Both equation have the same meaning, that if spending on education, health and infrastructure increases, the human development index will increase. Whereas if education spending decreased the human development index would be decreased. Even so it is with the decline in health spending and lower spending on infrastructure will reduce the human development index.
Partial test
Based on the results of the first regression of Table 6, either using a fixed effect and random effect it show significant value of education spending (0.000 is less than 5 percent). This means that education spending have significant effect on the human development index. These results are consistent with Maryani (2010) research that spending in education has positive influence on HDI District and City in Central Java period from 2007 to 2009. It is also consistent with Simpson et al (2012) research that the expenditure in education have a significant effect on HDI throughout the province in Indonesia in the period 2007-2008, and also Zul (2013) shows expenditure on education has positive influence to HI in four ASEAN countries, namely Indonesia, Malaysia, the Philippines and Thailand in the period 2007 to 2011.
11
Indonesia in the period 2007 to 2008. However, this study does not comply with Maryani study (2010) which states that the expenditure in the health sector positive effect on the HDI District and City in Central Java period from 2007 to 2009 and research Zul (2013) which states that government spending in the health sector has positive influence on the human development index in four ASEAN countries, namely Indonesia, Malaysia, the Philippines and Thailand in the period 2007 to 2011.
The government has set the government's health budget provincial and district / city is allocated a minimum of ten percent of the budget excluding salaries (Act No. 36 of 2009). However there are still some local government districts and cities in East Java which allocate health spending below 10 percent, the health expenditure does not affect the HDI districts and cities in East Java. Local government (district and city) is still allocated health expenditure below 10 percent (see Table 5).
The third regression test results in Table 6 using the fixed effect show that infrastructure spending has a significance value of 0.097 is less than 10 percent and using random effect has a significance of 0.079 is less than 10 percent. This means either using a fixed effect and random effect, infrastructure spending have marginal effect on the human development index. These results are consistent with studies of Zul (2013) that the infrastructure sector has positive influence on IPM in four ASEAN countries, namely Indonesia, Malaysia, Thailand and the Philippines in the period 2007 to 2011.
Overall Regression Equations Test
From table 6 that uses a fixed effect can be seen that the distribution F of 0.0001 (p-value less tha α α = 0.05 . While usi g the ra do effe t has distri utio F of 0.0000 (p-value s aller of α α = 0.05 . it can be concluded that both the use of fixed effect and random effect, spending on education, health, and infrastructure together significantly affect the human development index.
Coefficient of Determination (R²) Test
Based on Table 6 by using a fixed effect the R² value is equal to 9.69%. Meanwhile, by using random effect R² values do not differ much namely 9.58%. This means that the independent variables can explain the dependent variable only by 9.69% or 0.58%, while the remaining 90.31% or 90.42% influenced by other factors.
TABLE 7
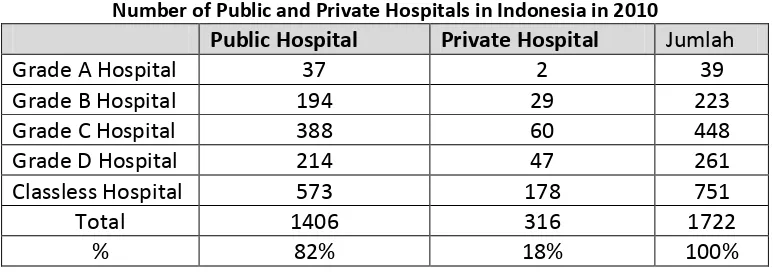
Number of Public and Private Hospitals in Indonesia in 2010
Public Hospital Private Hospital Jumlah
Grade A Hospital 37 2 39
Grade B Hospital 194 29 223
Grade C Hospital 388 60 448
Grade D Hospital 214 47 261
Classless Hospital 573 178 751
Total 1406 316 1722
12
Government programs in order to improve the welfare of society, including in the education, health, and infrastructure can not be separated from the role of the private sector. For example, from 1722 hospitals in Indonesia in 2010, 18% of which is a private hospital (www.infodokterku.com). Then in the education sector, 60% of educational institutions at the level of junior and senior high schools in East Java held by private (http://dindik.jatimprov.go.id). This means that the achievement of public welfare development is not solely derived from the government budget allocation.
TABLE 8
Number of Public and Private School In Indonesia in 2010
Public School Private School Amount
Junior High School 1556 2102 3658
Senior High School 426 843 1269
Total 1982 2945 4927
% 40% 60% 100%
According to Bappenas (2010), fiscal constraints, namely funding comes from the state become an obstacle to the expansion of infrastructure capacity in Indonesia. In the period 2010-2104, an estimated investment needs in Indonesia is Rp. 1450 trillion. One of the government's measures to address this infrastructure deficit is to encourage the active participation of the private sector. It is possible for the private sector to engage build infrastructure through Public Private Partnership scheme (PPP). Regulation on the implementation of PPP projects schemes stipulated in Presidential Decree No. 67 of 2005, was amended by Presidential Decree No. 13 of 2010 concerning Cooperation between the Government and private Enterprises in Infrastructure Construction. In Keleidoskop Ministry of Public Works in 2011, also mentioned some of the role of the private sector in providing investment in infrastructure development on several projects Ministry of Public Works (http://www.pu.go.id).
CONCLUSIONS AND SUGGESTIONS
The study concluded that:
1. Education spending has positive and significant impact on public welfare in East Java 2. The health expenditures are not found to affect the public welfare in East Java 3. Infrastructure spending has a marginal effect on the public welfare in East Java. 4. Spending on education and infrastructure could explain the level of publicl welfare
by 9.58% - 9.69%
Future studies can be conducted to elucidate the causes of health expenditures that are not shown to affect the level of public welfare in East Java.
BIBLIOGRAPHY
Acosta, Santiago Ormaechae., And Atsuyoshi Morozumi. 2013. Can a Government Enhance Long-Run Growth by Changing the Composition of Public Expenditure. http://www.imf.org. Downloaded on October 19, 2013.
13
Astri, Meylina., Sri Indah, and Harya renowned, 2012, Effect of Local Government Spending On Education and Health Sector Against Human development index in Indonesia, Journal of Economics and Business Education Vol.1 No. ,1 in 2012. Aulia, Rafika, 2013, UNDP: Human Development Index Indonesia Up,
http://www.tempo.co, Downloaded on October 21, 2013.
Central Bureau Of Statistics, The number of poor people in East Java in 2010-2011, http://www.bps.go.id.
Constitutional Court Decision No. 13 / PUU-VI I of 2008 on the Law Number 16 Year 2008 regarding the amendment of Law No. 45 Year 2007 on the State Budget for Fiscal Year 2008, or at least insofar as it concerns the provision of education budget.
Data Center Education Office of East Java, http://www.infodokterku.com, Downloaded May 1, 2014.
Directorate General of Financial Balance, According to reports Realization 2010-2011 Function Total Se-province of East Java, http://www.djpk.depkeu.go.id.
Dwi, Meningtyas Hidayatika, 2007, Literature Infrastructure and Economic Growth, http://lontar.ui.ac.id, Downloaded on November 1, 2013.
Ghozali, Imam, 2006, Applications Multivarite Analysis with SPSS, Fourth Edition, Publisher Agency Diponegoro University, Semarang.
Government Accounting Standards Statement No. 02 On Budget Realization Report. Government Regulation No. 24 of 2005 on Government Accounting Standards.
Government Regulation No. 24 of 2005 on Accounting Standards Technical Bulletin 04. Independent Republic Online, 2012. East Java Most Populated Poor (Note BPS end of
the year), http://www.rmol.co, Downloaded on October 21, 2013.
Human Development Index by Statistics Nangroi Aceh Darussalam province, 2009, www.undp.or.id, Downloaded October 22, 2013.
Kaleidoscope Ministry of Public Works in 2011, http://www.pu.go.id, Downloaded May 1, 2014.
Kessides, Christine, 1993, The Contribution of Infrastructure to Economic Development A Review of Experience and Policy Implication, Second printing, Washington: The International Bank for Reconstruction and Development / The World Bank Washington printing.
Law No. 36 Year 2009 on Health Budget.
Maryani, Tri, 2009, Analysis of the Human Development Index in the province of Central Java.
Ministry of Women Empowerment and Child Protection of the Republic of Indonesia, Data Development Index Manausia County and City in East Java, http://www.menegpp.go.id.
Muliadi, Awi Wijaya 2011, Multiple Data (Proxy) Health of Indonesia Year 2010/2011, http://www.infodokterku.com, Downloaded May 1, 2014.
14
PPP concession period on Drinking Water Supply Project, IPA Krikilan, Gresik, Through A Giving Modeling the Concession Period Well For Optimum Results interests PDAM Gresik Nor Private Party. http://digilib.its.ac.id. Downloaded May 1, 2014. Santoso, Ardhi. 2007. Analysis of Human Capital Overflow Effect Between Large and
Medium Manufacturing Industry In Medan, Batam, Palembang, Jakarta, Surabaya, Banjarmasin, and Makassar In the period 1995-1997.
Supriya, Dedy Priatna. 2013. Financing Infrastructure Through Public-Private Fund. http://pusbinsdi.net. Downloaded on October 20, 2013.
Understanding the welfare of society. www.menkokesra.go.id. Downloaded on April 25, 2014.
UNDP. Human development index (HDI), http://hdr.undp.org/en/content/human-development-index-hdi-table. Downloaded March 4, 2015