The Medical Journal
of Malaysia
Official Journal of the
Malaysian Medical Association
Volume: 71
Supplement 1
June 2016
THE MEDICAL JOURNAL OF MALA
Printed by: Digital Perspective Sdn. Bhd.
42-1, Level 1, Plaza Sinar, Taman Sri Sinar, 51200 Kuala Lumpur. Tel: 03-6272 3767
Email: [email protected]
MJM
Official Journal of the
Malaysian Medical Association
Volume 71 Supplement 1 June 2016
PP 2121/01/2013 (031329) MCI (P) 124/1/91 ISSN 0300-5283
EDITORIAL BOARD
The Medical Journal of Malaysia is published six times a year
i.e. February, April, June, August, October and December.
All articles which are published, including editorials, letters and book reviews
represent the opinion of the authors and are not necessarily those of the
Malaysian Medical Association unless otherwise expressed.
Copyright reserved © 2016
Malaysian Medical Association
Advertisement Rates:
Enquiries to be directed to the Secretariat.
Subscription Rates:
Price per copy is RM70.00 or RM300.00 per annum, for all subscribers.
Secretariat Address:
Malaysian Medical Association
4th Floor, MMA House, 124, Jalan Pahang, 53000 Kuala Lumpur.
P.O. Box S-20, 51700 Kuala Lumpur.
Tel: (03) 4042 0617, 4041 8972, 4041 1375 Fax: (03) 4041 8187
E-mail: [email protected] / [email protected]
Website: www.mma.org.my
Sivalingam A/L Nalliah
Victor Hoe Chee Wai
Editor-in-Chief
Lekhraj Rampal
Ex-officio
Ravindran R Naidu
Members
Members
Members
Anand Sachithanandan
Vasu Pillai A/L Letchumanan
Tan Geok Chin
Lim Thiam Aun
MMA Secretariat
The Medical Journal of Malaysia
The Medical Journal of Malaysia(MJM)welcomes articles of interest on all aspects of medicine in the form of original papers, review articles, short communications, continuing medical education, case reports, commentaries and letter to Editor. The MJM also welcomes brief abstracts, of not more than 50 words, of original papers published elsewhere, concerning medicine in Malaysia. Articles are accepted for publication on condition that they are contributed solely to The Medical Journal of Malaysia. Neither the Editorial Board nor the Publishers accept responsibility for the views and statements of authors expressed in their contributions. The Editorial Board further reserves the right to reject papers read before a society. To avoid delays in publication, authors are advised to adhere closely to the instructions given below.
Manuscripts:
Manuscripts should be submitted in English (British English). Manuscripts should be submitted online through MJM Editorial Manager, at the following URL:
http://www.editorialmanager.com/mjm
Instructions for registration and submission are found on the website. Authors will be able to monitor the progress of their manuscript at all times via theMJM Editorial Manager. For authors and reviewers encountering problems with the system, an online Users’ Guide and FAQs can be accessed via the “Help” option on the taskbar of the login screen.
All submissions must be accompanied by a completed Copyright Assignment Form, duly signed by all authors.
Manuscript text should be submitted using Microsoft Word for Windows. Images should be submitted as JPEG files(minimum resolution of 300 dpi).
Reviewers:
Authors must submit the names of at least two possible reviewers who are qualified and suitable to review their paper. The possible reviewers must not be involved in the work presented and should not be from the same institution as the authors. Authors need not obtain permission from possible reviewers as it is the prerogative of the MJM to approach them.
TYPES OF PAPERS Original Articles:
Original Articles are reports on findings from original unpublished research. Preference for publications will be given to high quality original research that make significant contribution to medicine. The articles should not exceed 4000 words, tables/illustrations up to five (5) and references up to 40. Manuscript describing original research should conform to the IMRAD format, more details are given below.
Review Articles:
Review Articles are solicited articles or systematic reviews. MJM solicits review articles from Malaysian experts to provide a clear, up-to-date account of a topic of interest to medical practice in Malaysia or on topics related to their area of expertise. Unsolicited reviews will also be considered, however authors are encourage to submit systematic reviews rather than narrative reviews. Systematic Review are papers that presents exhaustive, critical assessments of the published literature on relevant topics in medicine. Systematic reviews should be prepared in strict compliance with MOOSE or PRISMA guidelines, or other relevant guidelines for systematic reviews.
Short Communications:
Shorts communication are short research articles of important preliminary observations, findings that extends previously published research, data that does not warrant publication as a full paper, small-scale clinical studies, and clinical audits. Short communications should not exceed 1,000 words and shall consist of a Summary and the Main Text. The summary should be limited to 100 words and provided immediately after the title page. The number of figures and tables should be limited to three (3) and the number of references to ten (10).
Continuing Medical Education (CME) Articles:
A CME article is a critical analysis of a topic of current medical interest. The article should include the clinical question or issue and its importance for general medical practice, specialty practice, or public health. Upon acceptance of selected articles, the authors will be requested to provide five multiple-choice questions, each with five true/false responses, based on the article.
Case Reports:
Papers on case reports (one to five cases) must follow these rules: Case reports should not exceed 1,000 words; with only maximum of one (1) table; two (2) photographs; and up to five (5) references. It shall consists of a Summary and the Main Text. The summary should be limited to 100 words and provided immediately after the title page. Having a unique lesson in the diagnosis, pathology or management of the case is more valuable than mere finding of a rare entity. Being able to report the outcome and length of survival of a rare problem is more valuable than merely describing what treatment was rendered at the time of diagnosis.
Commentaries:
Commentaries will usually be invited articles that comment on articles published in the same issue of the MJM. However, unsolicited commentaries on issues relevant to medicine in Malaysia are welcomed. They should not exceed 1,200 words. They maybe unstructured but should be concise. When presenting a point of view it should be supported with the relevant references where necessary.
Letters to Editor:
Letters to Editors are responses to items published in MJM or to communicate a very important message that is time sensitive and cannot wait for the full process of peer review. Letters that include statements of statistics, facts, research, or theories should include only up to three (3) references. Letters that are personal attacks on an author will not be considered for publication. Such correspondence must not exceed 450 words.
Editorials:
These are articles written by the editor or editorial team concerning the MJMor about issues relevant to the journal.
STRUCTURE OF PAPERS Title Page:
The title page should state the brief title of the paper, full name(s) of the author(s) (with the surname or last name bolded), degrees (limited to one degree or diploma), affiliations and corresponding author’s address. All the authors’ affiliations shall be provided after the authors’ names. Indicate the affiliations with a superscript number at the end of the author’s degrees and at the start of the name of the affiliation. If the author is affiliated to more than one (1) institution, a comma should be used to separate the number for the said affiliation.
Do provide preferred abbreviated author names for indexing purpose, e.g. KL Goh (for Goh Khean Lee), MZ Azhar (for Azhar bin Mohd Zain), K Suresh (for Suresh Kumarasamy) or S Harwant (for Harwant Singh). Authors who have previously published should try as much as possible to keep the abbreviation of their name consistent.
Please indicate the corresponding author and provide the affiliation, full postal address and email.
Articles describing Original Research should consist of the following sections (IMRAD format): Abstract, Introduction, Materials and Methods, Results, Discussion, Acknowledgment and References. Each section should begin on a fresh page.
Scientific names, foreign words and Greek symbols should be in italic.
Abstract and Key Words:
A structured abstract is required for Original and Review Articles. It should be limited to 250 words and provided immediately after the title page. Below the abstract provide and identify 3 to 10 key words or short phrases that will assist indexers in cross-indexing your article. Use terms from the medical subject headings (MeSH) list from Index Medicus where possible.
Introduction:
Clearly state the purpose of the article. Summarise the rationale for the study or observation. Give only strictly pertinent references, and do not review the subject extensively.
Materials and Methods:
Describe your selection of the observational or experimental subjects (patients or experimental animals, including controls) clearly, identify the methods, apparatus (manufacturer's name and address in parenthesis), and procedures in sufficient
detail to allow other workers to reproduce the results. Give references to established methods, including statistical methods; provide references and brief descriptions of methods that have been published but are not well-known; describe new or substantially modified methods, give reasons for using them and evaluate their limitations.
Identify precisely all drugs and chemicals used, including generic name(s), dosage(s) and route(s) of administration. Do not use patients' names, initials or hospital numbers. Include numbers of observation and the statistical significance of the findings when appropriate.
When appropriate, particularly in the case of clinical trials, state clearly that the experimental design has received the approval of the relevant ethical committee.
Results:
Present your results in logical sequence in the text, tables and illustrations. Do not repeat in the text all the data in the tables or illustrations, or both: emphasise or summarise only important observations.
Discussion:
Emphasise the new and important aspects of the study and conclusions that follow from them. Do not repeat in detail data given in the Results section. Include in the Discussion the implications of the findings and their limitations and relate the observations to other relevant studies.
Conclusion:
Link the conclusions with the goals of the study but avoid unqualified statements and conclusions not completely supported by your data. Avoid claiming priority and alluding to work that has not been completed. State new hypotheses when warranted, but clearly label them as such. Recommendations, when appropriate, may be included.
Acknowledgements:
Acknowledge grants awarded in aid of the study (state the number of the grant, name and location of the institution or organisation), as well as persons who have contributed significantly to the study.
Authors are responsible for obtaining written permission from everyone acknowledged by name, as readers may infer their endorsement of the data.
References:
Authors are responsible for the accuracy of cited references and these should be checked before the manuscript is submitted.
Number references consecutively in the order in which they are first mentioned in the text. Identify references in text, tables and legends by Arabic numerals (superscripts). References cited only in tables or legends to figures should be numbered in accordance with a sequence established by the first identification in the text of the particular table or illustration.
Use the form of references adopted by the US National Library of Medicine and used in the Index Medicus. Use the style of the examples cited at the end of this section, which have been approved by the National Library of Medicine.
The titles of journals should be abbreviated according to the style used in the Index Medicus.
Try to avoid using abstracts as references; “unpublished observations” and “personal communications” may not be used as references, although references to written, not verbal, communication may be inserted (in parenthesis) in the text. Include among the references manuscripts accepted but not yet published; designate the journal followed by “in press” (in parenthesis). Information from manuscripts should be cited in the text as “unpublished observations” (in parenthesis).
The references must be verified by the author(s) against the original documents. List all authors when six or less; when seven or more list only the first six and add et al. Examples of correct forms of references are given below:
Example references Journals:
1. Standard Journal Article
Chua SK, Kilung A, Ong TK, Fong AY, Yew KL, Khiew NZ et al. Carotid intima media thickness and high sensitivity C-reactive protein as markers of cardiovascular risk in a Malaysian population. Med J Malaysia 2014; 69(4):
World Health Organization. World Health Statistics 2015. Geneva: World
4. Editor, Compiler, Chairman as Author
Jayakumar G, Retneswari M, editors. Occupational Health for Health Care Professionals. 1st ed. Kuala Lumpur: Medical Association of Malaysia; 2008. 5. Chapter in Book
Aw TC. The occupational history. In: Baxter P, Aw TC, Cockroft A, Durrington P, Malcolm J, editors. Hunter’s Disease of Occupations. 10th ed. London: Hodder Arnold; 2010: 33-42.
6. Agency Publication
National Care for Health Statistics. Acute conditions: incidence and associated disability, United States, July1968 - June 1969. Rockville, Me: National Centre for Health Statistics, 1972. (Vital and health statistics). Series 10: data from the National Health Survey, No 69). (DHEW Publication No (HSM) 72 - 1036).
Online articles
7. Webpage: Webpage are referenced with their URL and access date, and as much other information as is available. Cited date is important as webpage can be updated and URLs change. The "cited" should contain the month and year accessed.
Ministry of Health Malaysia. Press Release: Status of preparedness and response by the ministry of health in and event of outbreak of Ebola in Malaysia 2014
[cited Dec 2014]. Available from:
Thirunavukarasu R. Survey - Landscape of GP services and health economics in Malaysia. Berita MMA. 2016; March: 20-1.
Tables and illustrations:
Roman numerals should be used for numbering tables. Arabic numerals should be used when numbering illustrations and diagrams. Illustrations and tables should be kept to a minimum.
All tables, illustrations and diagrams should be fully labelled so that each is comprehensible without reference to the text. All measurements should be reported using the metric system.
Each table should be typed on a separate sheet of paper, double-spaced and numbered consecutively. Omit the internal horizontal and vertical rules. The contents of all tables should be carefully checked to ensure that all totals and subtotals tally.
Photographs of Patients:
Proof of permission and/or consent from the patient or legal guardian must be submitted with the manuscript. A statement on this must be included as a footnote to the relevant photograph.
Colour reproduction:
Illustrations and diagrams are normally reproduced in black and white only. Colour reproductions can be included if so required and upon request by the authors. However, a nominal charge must be paid by the authors for this additional service; the charges to be determined as and when on a per article basis.
Abbreviations:
Use only standard abbreviations. The full-term for which an abbreviation stands should precede its first use in the text, unless it is a standard unit of measurement. Abbreviations shall not be used in the Title.
Formatting of text:
Numbers one to ten in the text are written out in words unless they are used as a unit of measurement, except in figures and tables. Use single hard-returns to separate paragraphs. Do not use tabs or indents to start a paragraph. Do not use the automated formatting of your software, such as hyphenation, endnotes, headers, or footers (especially for references). Submit the Manuscript in plain text only, removed all ‘field codes’ before submission. Do not include line numbers. Include only page number.
Best Paper Award:
All original papers which are accepted for publication by the MJM, will be considered for the ‘Best Paper Award’ for the year of publication. No award will be made for any particular year if none of the submitted papers are judged to be of suitable quality.
CONTENTS
Page
• A Review of Adult Obesity Research in Malaysia
1
Lim Kean Ghee
• A Review of Metabolic Syndrome Research in Malaysia
20
Lim Kean Ghee, Cheah Wee Kooi
• A Review of Smoking Research In Malaysia
29
Wee Lei Hum, Caryn Chan Mei Hsien, Yogarabindranath Swarna Nantha
• A Review of Coronary Artery Disease Research in Malaysia
42
Ang Choon Seong, Chan Kok Meng John
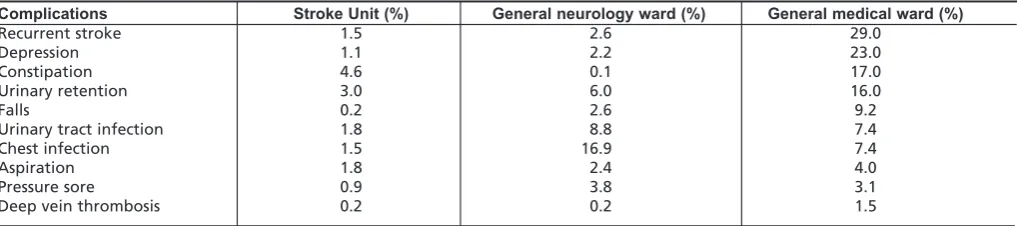
• A Review of Stroke Research in Malaysia from 2000 – 2014
58
Wee Kooi Cheah, Chee Peng Hor, Zariah Abdul Aziz, Irene Looi
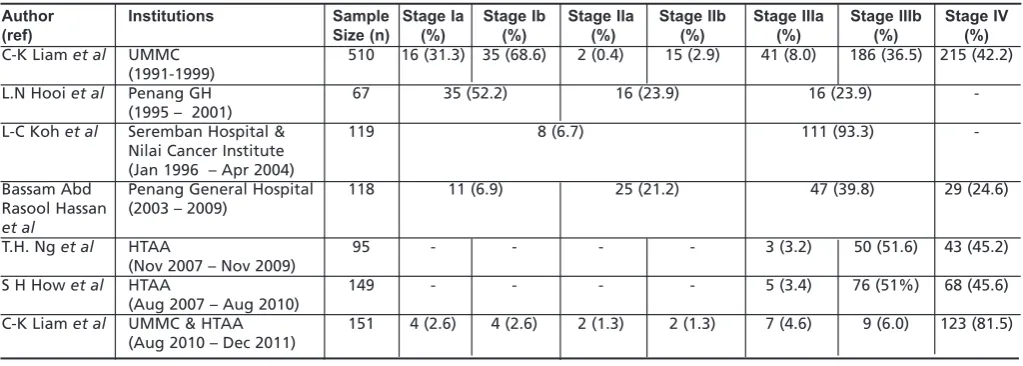
• A Review of Lung Cancer Research in Malaysia
70
Kan Chan Siang, Chan Kok Meng John
• A Review of Acute Rehumatic Fever and Rheumatic Heart Disease Research in Malaysia
79
Hung Liang-choo, Nadia Rajaram• A Review of Research on Child Abuse in Malaysia
87
Irene Guat-Sim Cheah, Choo Wan Yuen
• A Review of Occupational Injury Research In Malaysia
100
Foreword
Approximately three-quarters of deaths worldwide today are caused by non-communicable diseases (NCDs) such as cardiovascular disease, cancer, diabetes, chronic respiratory disease, and injury. Non-communicable diseases used to be the exclusive bane of high income countries, but now more than half of NCD deaths occur in low and middle-income countries. This means that these countries which still have to deal with communicable diseases, would also have to battle the health, social, and economic burden of lifestyle related diseases.
Although NCDs were not part of the 2000 Millennium Development Goals, in 2011, it became a focus with the United Nations and the World Health Organization calling for a 25% reduction in NCD-related mortality by the year 2025. Are we able to achieve this goal? Is the burden of NCDs in Malaysia overwhelming? How prevalent are the risk factors? And what are the issues in prevention, detection, and treatment that must be addressed? As many of the NCDs are of long duration and generally slow in progression, our strategies should also be long-term. But how do we improve health literacy and promote early detection? And how do we do all these cost-effectively?
The greatest of all mistakes is to do nothing because you think you can only do a little. This old quote that was popularised again by the American motivational coach, Zig Ziglar, is the sentiment that we should adopt. The problem and effect of NCDs appear overwhelming but the history of medicine has shown us that we are capable of taking on the challenge if we do our part.
The Clinical Research Centre, (CRC), once again collaborating with Assoc Prof Lim Kean Ghee from the International Medical University, has produced this sequel to 2014’s Medical Journal of Malaysia (MJM) supplement of Malaysian Research on Major Diseases. This MJM supplement serves to reinforce NCDs as a major healthcare problem with a compilation of articles covering nine different conditions. Three reviews cover the critical risk factors - obesity, metabolic syndrome, and smoking. Four other reviews discuss common diseases, i.e. acute coronary syndrome, stroke, lung cancer, and rheumatic heart disease. This supplement also includes two topics which may not be as widely discussed or highlighted as the earlier conditions. The first is child abuse, an important cause of childhood morbidity. And the second focuses on occupational injury, which has high rates in developing countries.
To the authors of the reviews selected for this supplement, congratulations and thank you for taking the time to review the local research conducted in your field of expertise. I hope the reviews are continuously updated so that our recommendations and strategies remain evidenced-based and current. And I hope this encourages other specialties to also come up with their own reviews.
I also take this opportunity to applaud the behind-the-scene team who came together again to ensure that local research publications get their share of the limelight.
Datuk Dr. Noor Hisham Abdullah
Foreword
In my foreword for the Medical Journal of Malaysia (MJM) supplement on Malaysian Research on Major Diseases two years ago, I highlighted the importance of systematic reviews in generating a consensus on medical evidence and its implications on patient care. I am happy to see the Clinical Research Centre (CRC) continuing this tradition of reviewing local research with the production of this supplement.
The focus on non-communicable diseases (NCDs) is important as the prevalence of these conditions in Malaysia are rising substantially. The Ministry of Health has already implemented many NCD initiatives at national and local levels; and these include various publications such as survey reports, registry reports, factsheets, annual reports, national strategic plans, and guidelines. The publication of this supplement will add to this repository of information.
The nine conditions featured here have been extensively researched in Malaysia. For instance, the review on coronary artery disease, a primary cause of morbidity and mortality in Malaysia as it is elsewhere in the world, looked at data from over 100 local papers published in this disease area. The snapshots from the reviews in this supplement provide us an overview of the local state of the disease with a bibliography of the relevant papers which healthcare professionals can read further for an in-depth study.
Clinicians can use this MJM publication as reference to guide their treatment decisions, and get a perspective on what fellow clinicians see in their respective practices. Other healthcare professionals can also benefit by getting the latest information with a local flavour. Researchers can refer to this to identify patient profiles and risk factors, and discover where the next wave of research should be. Policymakers can also be better equipped to make important healthcare decisions when they have access to data from their own settings generated by their own clinicians. Therefore, I encourage clinical researchers to publish their data; and to those who already do, keep publishing to keep your data relevant. Without your publications, how would we know whether our treatment choices are effective and efficient? Or why a particular approach worked so well in one setting but not in another? Or whether a certain innovation is practical or cost effective? Or how to improve patient care and experience?
Finally, I thank all parties involved in this endeavour - the authors for searching, assessing, and summarising the research; and the editorial team for putting this supplement together. I encourage the CRC to continue producing thematic compilations like this, as clearly the reviews in this supplement feature research that matter to both healthcare professionals and patients. I look forward to the next compilation.
Datuk Dr Shahnaz Murad
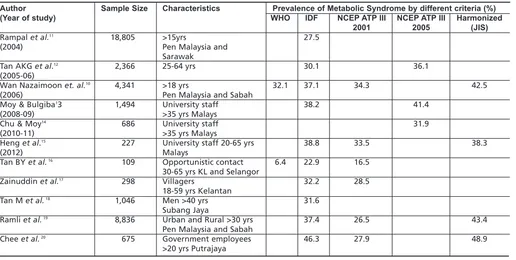
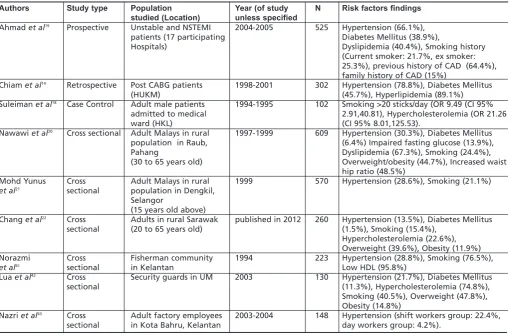
ABSTRACT
A literature search of articles as detailed in the paper Bibliography of clinical research in Malaysia: methods and brief results, using the MESH terms Obesity; Obesity, Abdominal; and Overweight; covering the years 2000 till 2015 was undertaken and 265 articles were identified. Serial population studies show that the prevalence of obesity increased rapidly in Malaysia in the last decade of the twentieth century. This follows the rising availability of food per capita which had been begun two to three decades previously. Almost every birth cohort, even up to those in their seventh decade increased in prevalence of overweight and obesity between 1996 and 2006. However, the rise in prevalence in obesity appears to have slowed after the first decade of the twentieth century. Women are more obese than men and Malays and Indians are more obese than Chinese. The Orang Asli are the least obese ethnic group in Malaysia but that may change with socio-economic development. Neither living in rural areas nor having low income protects against obesity. On the contrary, a tertiary education and those in the highest income bracket are associated with less obesity. Malaysians are generally not physically active enough, in the modes of transportation they use and how they use their leisure time.
Other criteria and measures of obesity have been investigated, such as the relevance of abdominal obesity, and the Asian criteria or Body Mass Index (BMI) cut-offs value of 23.0kg/m2for overweight and 27.0 kg/m2for obesity, with the view that the risk of diabetes and other chronic diseases start to increase at lower values in Asians compared to Europeans. Nevertheless the standard World Health Organisation (WHO) guidelines for obesity are still most widely used and hence is the best common reference. Guidelines for the management of obesity have been published and projects to combat obesity are being run. However, more effort needs to be invested. Studies on intervention programmes show that weight loss is not easy to achieve nor maintain.
Laboratory research worldwide has uncovered several genetic and biochemical markers associated with obesity. Similar studies in Malaysia have found some biomarkers with an association to obesity in the local population but none of great significance.
KEY WORDS:
overweight, obesity, Malaysia, abdominal obesity, physical activity, food intake, hypertension, diabetes, metabolic syndrome, psychiatric conditions, breast cancer, colorectal cancer
INTRODUCTION
265 articles were identified and examined in a literature search on adult obesity in Malaysia. The search using the medical subject headings (MeSH) Obesity; Obesity, Abdominal; and Overweight; followed the method that has been previously described.1 In brief, clinical research publications containing data on Malaysia for the period Jan 2000 - Dec 2015 were included (last search date 2 Feb 2016). Conference proceedings (but not conference abstracts), relevant theses/dissertation, books/book chapters, reports and clinical practice guidelines were included. 365 articles were initially identified, but 100 articles pertaining to childhood and adolescent obesity were excluded.
Nutrition is vital for health. Undernourishment was a significant burden on human health in the past. However, human morbidity and mortality increases not only with undernourishment but also with excessive nutrition. Obesity, the disease of excessive adipose tissue is increasingly prevalent worldwide.
The WHO criteria for Body Mass Index(BMI) classifies a BMI of 25-29.9kg/m2as overweight and >30kg/m2as obese.2BMI does overestimate obesity in muscular individuals and underestimate it in such as the elderly who have lost body mass. However, it still is the most widely used index for obesity. Obesity is recognized as a major determinant of non-communicable diseases such as cardiovascular disease, cancers, type 2 diabetes mellitus, respiratory problems, gallbladder diseases, post-operative morbidity and musculoskeletal disorders such as osteoarthrosis.
There has been a clearly documented dramatic increase in the prevalence of obesity in Malaysia over the last three decades since large scale population data became available. The rise of obesity is not a problem unique to Malaysia. In the global context, alongside development and prosperity, in many countries especially in Asia, obesity has become a leading health issue.
This process has been termed nutrition transition, from low availability of calories mainly in the form of plant products to diets high in fats, sugars and energy dense processed foods. This in turn has been the result of rapid economic development which has taken place in Malaysia in the last quarter of the twentieth century. Malaysia has recently been ranked second highest in East and Southeast Asia in terms of being overweight.3
A Review of Adult Obesity Research in Malaysia
Lim Kean Ghee, FRCS
International Medical University Clinical School, Jalan Rasah, 70300 Seremban
SECTION 1: REVIEW OF LITERATURE PREVALENCE OF OBESITY
In the Adult* Population
There have been six large (>10,000 respondents) national population studies on the prevalence of obesity (Table I)
The National Health Morbidity Survey(NHMS II) in 1996 found that 16.6% prevalence of the adult population are overweight and 4.4% obese.4(This study is often quoted as finding a prevalence 20.7% of individuals aged 20 years and older who were overweight and 5.8% obese).5Six year later, the Malaysian Adults Nutrition Survey (MANS) carried out between October 2002 and July 2003,6 found that the prevalence of obesity had more than doubled and that the number of adults overweight increased more than 60%. If that rather rapid increase in the prevalence of obesity seemed hard to believe, the findings were confirmed in another study in 2004.7 Following shortly, the Third National Health and Morbidity Survey (NHMS III) in 2006 conducted among 33,055 adults found 29.1% were overweight and 14.0% obese.8 When the next NMHS was done five years later in 2011, it showed only a slight increase in the rates of those overweight and obese. 9 The NHMS 2015 shows the prevalence of overweight plateauing (Table I) but is obesity still rising. This just means the number of people moving into the overweight category about equals the number of overweight people moving into the obese category.10(Figure 1 and 2)
Age
The NSCVDRF study only reported data for obesity and not overweight. Leaving that study aside the other five large population nutritional surveys come at almost 5-year intervals. The MANS study is two years late in 2003 instead of 2001. The NMHS 2015 comes only 4 years after the NHMS 2011. Using these five large studies as a five year plots alongside each other for examination of the prevalence of overweight and obesity in the various age groups we can observe the trend on cohorts over time, albeit bearing in mind they are not all exactly five years apart.
The prevalence of both overweight and obesity are lowest among young adults but more than doubles to a peak in middle age (Figure 3 and 4). In the NHMS II in 1996, the peak age for obesity was the 40-49 year age band (Figure 4). In the NMHS III,8 which reported age in 5 year bands, the peak was the 50-54 year age band and in the NMHS 20119 the peak had moved further to the 55-59 year band (Figure 4). It therefore appears that the cohort born between 1952-1957 carried the high peak of obesity with them as they aged. Although they are no longer the age group with the highest prevalence of obesity in 2015, having reached the 60-64 year band, their prevalence of obesity rose just slightly (Figure 6 bolder line).10 The cohort behind them aged 55-59years became the age group with highest obesity.
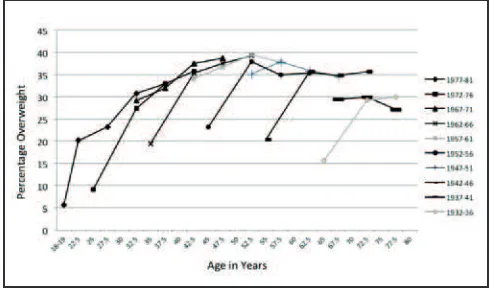
Does the rising prevalence of obesity mean only the young age groups move up in age carrying their higher prevalence with them or did all age groups also increase in weight? Figures 5 and 6 which shows the prevalence of overweight and obese by birth cohorts shows us that every birth cohort
increased in prevalence of overweight and obesity between 1996 and 2006. Even the cohort born between 1927-1936 who were >60 years old in 1996 showed an increased in prevalence of overweight and obesity 10 years later in the NMHS III survey when they were the >70year age group. (prevalence of overweight 15.6% rose to 21.1-29.3%, obesity 3.1% rose to 7.2-8.6%). It appears that the period between 1996 to 2006 saw the most rapid rise in weight gain in the Malaysian population.
However between 2006 and 2015, cohorts born before 1952, ie. those who were above 55 years old in 2006, appeared no longer to have increased in prevalence of overweight (Figure 5), but instead plateaued or even decreased slightly in prevalence.
The Elderly
As noted, from the age of about 60 years upwards, the prevalence of overweight and obesity declines. The prevalence of obesity declines more rapidly than overweight, reaching less than half the peak age value in the 70-75year age group (Figure 4). The prevalence of overweight on the other hand stays up to 60-70% the peak age prevalence rates (Figure 3). This may indicate the obese suffer a higher mortality rate. The decline in prevalence among those 80+years is even more striking.Their prevalence of obesity is only half that of the 75-79 year age group (Figure 4).
Suzana et. al.have also noted that while a large proportion of the elderly may be overweight and obese, signs of malnutrition may be present among them11,12(malnutrition will not be explored further in this review).
Sex
Consistently across the studies, more women are obese than men,4,6,7,8,9,10but more men are overweight than women.4,6,7,8,9,10 Only among young adults are more men obese than women.6,14 By the late 20s women have overtaken men in obesity; the cause of this is usually attributed to weight gain after pregnancy. This greater prevalence of overweight among men was especially true among Chinese but among Indians more women are overweight compared to men.6It appears that when women put on weight they ‘go all the way’. Furthermore the gap between the prevalence of obesity between women and men has widened.4,8
Three studies reported the prevalence of obesity by age and also by sex.4,6,7In the NHMS II and NSCVDRF studies4,7men appeared to have a peak age younger than women, but that is not clear in the MANS study.6
Suzana et al.have noted that elderly women are twice as obese as men, and by weight circumference (measure for abdominal obesity) women are three times as obese as men.11,12
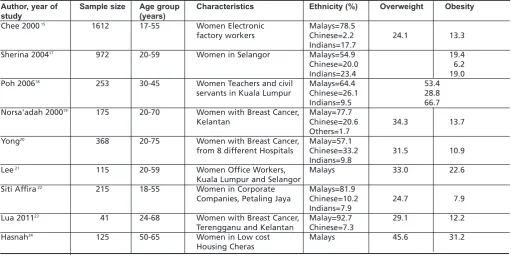
There have been several studies focusing specifically on women (Table III). Chee et. al.found that the prevalence of overweight among women electronic factory worker for younger age groups were similar to the survey NHMS II done four year before, but older women electronic factory worker had higher overweight prevalence and mean BMI than the
A Review of Adult Obesity Research in Malaysia
Table I: Sample size and prevalence of overweight and obesity of Large Malaysian Obesity Studies
Sample Size Prevalence of
Overweight* Obesity*
National Health and Morbidity Survey II (NHMS II) 19964 28,737 16.6% 4.4%
(20.7%#) (5.8%#)
Malaysian Adults Nutrition Survey (MANS) 20036 10,216 26.7% 12.2%
The National study on Cardio-Vascular Disease Risk Factors(NSCVDRF) 20047 16,127 11.7%##
(12.6%#)
Third National Health and Morbidity Survey (NHMS III) 20068 33,055 29.1% 14.0%
National Health and Morbidity Survey 2011 (NHMS 2011)9 28,498 29.4% 15.1%
National Health and Morbidity Survey 2015 (NHMS 2015)10 18,499 30.0% 17.7%
# Prevalence among 20 years and above## Prevalence among 15 years and above
Table II: Prevalence of Overweight and Obesity by sex
Overweight (%) Obese (%)
Men Women Men Women
NHMS 1996 20.1 21.4 4.0 7.6
MANS 2003 28.6 24.8 9.7 14.7
NSCVDRF 2004 9.6 13.8
NHMS 2006 29.7 28.6 10.0 17.4
NHMS 2011 30.9 27.8 12.7 17.6
NHMS 2015 31.6 28.3 15.0 20.6
Table III: Prevalence of overweight and obesity among women in several localised studies
Author, year of Sample size Age group Characteristics Ethnicity (%) Overweight Obesity
study (years)
Chee 200015 1612 17-55 Women Electronic Malays=78.5
factory workers Chinese=2.2 24.1 13.3
Indians=17.7
Sherina 200417 972 20-59 Women in Selangor Malays=54.9 19.4
Chinese=20.0 6.2
Indians=23.4 19.0
Poh 200618 253 30-45 Women Teachers and civil Malays=64.4 53.4
servants in Kuala Lumpur Chinese=26.1 28.8
Indians=9.5 66.7
Norsa'adah 200019 175 20-70 Women with Breast Cancer, Malay=77.7
Kelantan Chinese=20.6 34.3 13.7
Others=1.7
Yong20 368 20-75 Women with Breast Cancer, Malay=57.1
from 8 different Hospitals Chinese=33.2 31.5 10.9 Indians=9.8
Lee21 115 20-59 Women Office Workers, Malays 33.0 22.6
Kuala Lumpur and Selangor
Siti Affira22 215 18-55 Women in Corporate Malays=81.9
Companies, Petaling Jaya Chinese=10.2 24.7 7.9 Indians=7.9
Lua 201123 41 24-68 Women with Breast Cancer, Malay=92.7 29.1 12.2
Terengganu and Kelantan Chinese=7.3
Hasnah24 125 50-65 Women in Low cost Malays 45.6 31.2
Housing Cheras
Table IV: Prevalence of Overweight and Obesity by ethnic group
Overweight (%) Obese (%)
Malays Chinese Indians Malays Chinese Indians
NHMS II 16.5 15.1 18.6 5.1 3.5 5.0
MANS 2003 27.2 25.0 31.0 15.3 7.2 12.7
NSCVDRF 2004 13.6 8.5 13.5
NHMS III 29.8 28.5 33.2 16.6 8.7 17.7
NHMS 2011 31.1 27.6 30.8 18.7 9.7 20.6
NHMS 2015 31.0 28.1 35.0 21.1 11.7 27.1
Table V: Prevalence of Overweight and Obesity by sex and ethnic groups
Overweight (%) Obese (%)
Men Women Men Women
Malays Chinese Indians Malays Chinese Indians Malays Chinese Indians Malays Chinese Indians
NHMS 1996 20.0 24.5 24.2 23.9 18.7 25.6 4.5 4.7 3.8 9.5 5.3 9.8
national sample.13 It has also been noted that being overweight and obese was associated with earlier menarche among women in a study of university students.16
Ethnic Differences
Across the national population surveys, Indians are more overweight than Chinese and Malays.6,8,9,10 (Table IV) The prevalence among Malays and Chinese appear to have stabilised, but among Indians the NHMS 2011 survey showed an unusual decrease followed by a steep rise in 2015. The obesity trend is clearer. Indians are becoming much more obese, with rates approaching three times more than Chinese.10
Indians of both sexes are more overweight than Chinese and Malays (Table V), the difference between Indian women and the other ethnic groups being wider than among the men.4,6,8 Data comparing men and women separately by ethnic groups are only available in three studies.4,6,7 Malay and Indian women were about equally obese in 2004 but Chinese women have only about half their prevalence rates. Chinese women are about equally as obese as Chinese men, but both Malay and Indian women are much more obese than their male counterparts. Among men, Chinese had the highest prevalence of obesity in 1996, but they have been overtaken by both Indian and Malay men in later studies.6,7,8
Two studies listed the bumiputera of Sarawak and Sabah as separate categories6,7which allows better observations to be made than when they are put together as just other indigenous people or others.4,8,9The results shown in Table VI are inconsistent, probably due to sampling error as there are many bumiputera groups spread over a wide area in both
states. Their prevalence of overweight and obesity in 2003-2004 are lower than those of Indians and Malays and comparable to the rates among Chinese. It is hard to say with certainty whether the men or women are more overweight and obese. Except for one study which found bumiputera men in Sabah more overweight and obese than women (MANS), the rest of the data shows bumiputera women in Sarawak more overweight and obese than men, as did the NSCVDRF study find in contradiction with the MANS data (Table VI). Listed as other bumiputerain the NHMS 2011 and NHMS 2015, they have overweight rates similar to other races and obesity rates (14.1%, in 2011 and 18.0% in 2015) higher than Chinese but not as high as Malays and Indians.10 The ethnic group with the lowest prevalence of obesity in Malaysia are the Orang Asli. None of the Orang Asli were obese in the MANS study, and only 15% were overweight, but they only had a sample size of 28 Orang Asli. We must look at more focused studies for information. Chronic Energy Deficiency(CED) or under-nutrition(BMI<18.5 kg/m2) has been and is still the larger nutritional problem among Orang Asli, but that is not the subject of this review.
A nutritional status survey of Orang Asli adults (Jahai, 58.7% Temiar, 41.3%) in Lembah Belum, Grik, of 138 subjects found 26.7% underweight and 10.1% were either overweight/ obese.25 Based on percentage body fat and waist circumference (WHO criteria) only 1(0.7%) was obese. A study of 57 adult Orang Asli (Che Wong ) in Pahang found 3 men(10.3%) and 8 women (29%) overweight and 1 man(3.3%) obese.26However, where the Orang Asli live very close to economic development such as in Sungai Ruil in Cameron Highlands, among 138 respondents, by BMI 25.4% Table VI: Prevalence of Overweight and Obesity by sex among bumiputera in Sabah and Sarawak
Overweight Obese
Men Women Men Women
Bumiputra Bumiputra Bumiputra Bumiputra Bumiputra Bumiputra Bumiputra Bumiputra
Sabah Sarawak Sabah Sarawak Sabah Sarawak Sabah Sarawak
MANS 2003 24.3 24.6 23.2 31.9 8.4 5.3 7.4 8.4
NSCVDRF 2004 6.1 9.3 8.5 12.3
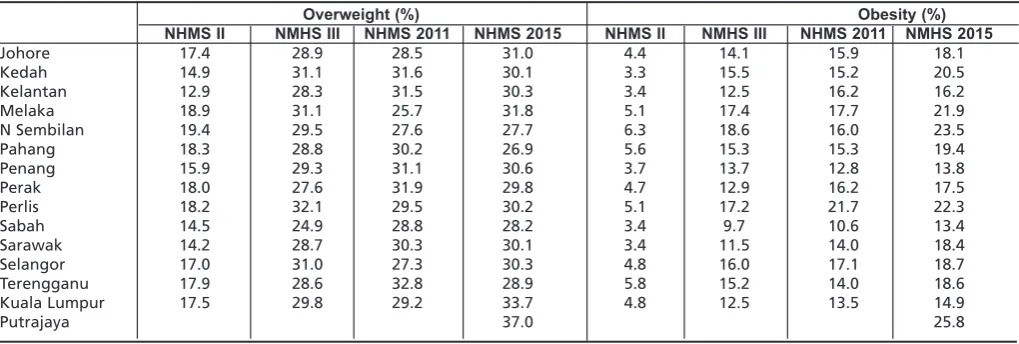
Table VII: The prevalence of overweight and obesity by state in Malaysia
Overweight (%) Obesity (%)
NHMS II NMHS III NHMS 2011 NHMS 2015 NHMS II NMHS III NHMS 2011 NMHS 2015
Johore 17.4 28.9 28.5 31.0 4.4 14.1 15.9 18.1
Kedah 14.9 31.1 31.6 30.1 3.3 15.5 15.2 20.5
Kelantan 12.9 28.3 31.5 30.3 3.4 12.5 16.2 16.2
Melaka 18.9 31.1 25.7 31.8 5.1 17.4 17.7 21.9
N Sembilan 19.4 29.5 27.6 27.7 6.3 18.6 16.0 23.5
Pahang 18.3 28.8 30.2 26.9 5.6 15.3 15.3 19.4
Penang 15.9 29.3 31.1 30.6 3.7 13.7 12.8 13.8
Perak 18.0 27.6 31.9 29.8 4.7 12.9 16.2 17.5
Perlis 18.2 32.1 29.5 30.2 5.1 17.2 21.7 22.3
Sabah 14.5 24.9 28.8 28.2 3.4 9.7 10.6 13.4
Sarawak 14.2 28.7 30.3 30.1 3.4 11.5 14.0 18.4
Selangor 17.0 31.0 27.3 30.3 4.8 16.0 17.1 18.7
Terengganu 17.9 28.6 32.8 28.9 5.8 15.2 14.0 18.6
Kuala Lumpur 17.5 29.8 29.2 33.7 4.8 12.5 13.5 14.9
A Review of Adult Obesity Research in Malaysia
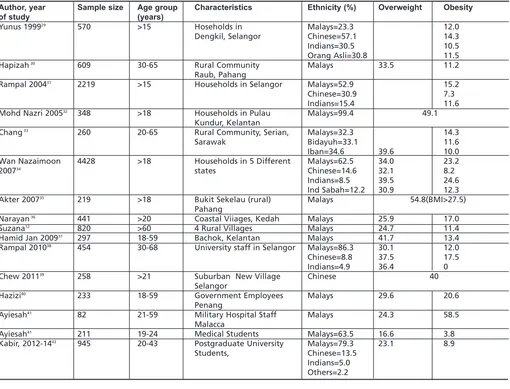
Table VIII: Prevalence of Overweight and Obesity in several small localised studies
Author, year Sample size Age group Characteristics Ethnicity (%) Overweight Obesity
of study (years)
Yunus 199929 570 >15 Hoseholds in Malays=23.3 12.0
Dengkil, Selangor Chinese=57.1 14.3
Indians=30.5 10.5
Orang Asli=30.8 11.5
Hapizah30 609 30-65 Rural Community Malays 33.5 11.2
Raub, Pahang
Rampal 200431 2219 >15 Households in Selangor Malays=52.9 15.2
Chinese=30.9 7.3
Indians=15.4 11.6
Mohd Nazri 200532 348 >18 Households in Pulau Malays=99.4 49.1
Kundur, Kelantan
Chang33 260 20-65 Rural Community, Serian, Malays=32.3 14.3
Sarawak Bidayuh=33.1 11.6
Iban=34.6 39.6 10.0
Wan Nazaimoon 4428 >18 Households in 5 Different Malays=62.5 34.0 23.2
200734 states Chinese=14.6 32.1 8.2
Indians=8.5 39.5 24.6
Ind Sabah=12.2 30.9 12.3
Akter 200735 219 >18 Bukit Sekelau (rural) Malays 54.8(BMI>27.5)
Pahang
Narayan36 441 >20 Coastal Viiages, Kedah Malays 25.9 17.0
Suzana12 820 >60 4 Rural Villages Malays 24.7 11.4
Hamid Jan 200937 297 18-59 Bachok, Kelantan Malays 41.7 13.4
Rampal 201038 454 30-68 University staff in Selangor Malays=86.3 30.1 12.0
Chinese=8.8 37.5 17.5
Indians=4.9 36.4 0
Chew 201139 258 >21 Suburban New Village Chinese 40
Selangor
Hazizi40 233 18-59 Government Employees Malays 29.6 20.6
Penang
Ayiesah41 82 21-59 Military Hospital Staff Malays 24.3 58.5
Malacca
Ayiesah41 211 19-24 Medical Students Malays=63.5 16.6 3.8
Kabir, 2012-1443 945 20-43 Postgraduate University Malays=79.3 23.1 8.9
Students, Chinese=13.5
Indians=5.0 Others=2.2
Fig. 1: Percentage of Malaysians overweight and obese (BMI>25kg/m2) in studies from 1996 to 2015.
Fig. 2: Percentage of Malaysians obese (BMI>30kg/m2) in studies
from 1996 to 2015. Table IX: Physical Activity among Malaysians
Adequate Exercise Physcially Inactive
Men Women Men Women
NHMS II 16.2% 7.7% 60% 75%
MANS 18.9% 9.4% 60.0% 77.7%
MyNCDS-1 55.4% 60.1%
NMHS III 35.3% 50.5%
Fig. 3: Prevalence of Overweight (BMI 25-29kg/m2) among
Malaysians of Different Age Groups.
Fig. 4: Prevalence of Obesity (BMI >30kg/m2) among Malaysians of Different Age Groups.
Fig. 5: Prevalence of Overweight at Various Age Groups for Different Birth Cohorts using data from NMHS II, MANS, NHMS III, NHMS 2011 and NMHS 2015.
Fig. 6: Prevalence of Obesity (BMI >30kg/m2) at Various Age
Groups for Different Birth Cohorts using data from NHMS II, MANS, NHMS III and NHMS 2011.
Fig. 7: Change in available calories, fat and protein per capita in Malaysia 1961-2011.
Source: FAO food balance sheet
Fig. 8: Changes in source of calories in Malaysia between 1970 and 2009.
A Review of Adult Obesity Research in Malaysia
were overweight and 34.8% obese.27In wide survey (n=636) of Orang Asli, classifying them by tribes (Proto-Malays, Senois and Negritos), as well as by socio-economic groups (Urbanized City Fringe Dwellers (UCFD), Resettled Communities (UC) and Deep Forest Hunter Gatherers (DFHG), Phipps et al.found the prevalence of obesity ranged from 7.5-10.0% among the Proto-Malay, 4.5-10.0% among Senoi and only 2.6-5.5% among Negritos. By socio-economic groups, 31.6% of UCFD, 12.0% of RC and 2.0% of DFHG were obese.28
Geographical Variations
Sabah, Sarawak, Kedah and Kelantan showed the lowest rates of overweight (12.9%-14.9%) and obesity (3.3%-3.4%) in the NHMS II in comparison to other states (overweight =15.9%-19.4%, obesity=3.7%-6.3%) (Table VII. Negeri Sembilan had the highest rates of overweight and obese adults.4In the NHMS III only Sabah stood slightly apart with low rates of overweight (24.9%) and obesity (9.7%).8 The other states had rates of overweight between 27.6% (Perak) and 32.1% (Perlis) and rates of 11.5% (Sarawak) and 18.6% (Negeri Sembilan) for obesity. Sabah (10.6%) continued to show the lowest rate for obesity in the NMHS 2011, but Melaka had the lower prevalence of overweight (25.7%).9 The trend indicates that over these critical years nutritional availability, the main driver for obesity levelled out geographically throughout Malaysia. The latest NHMS 2015 showed that Putrajaya has the highest rates of obesity. Obesity is lowest in Penang and Kuala Lumpur, as well as Sabah, although the prevalence of overweight is similar to other states.10
The MANS study also looked at geographical variation and grouped the states in Peninsular Malaysia into four groups, Northern, Central, South and East, besides Sabah and Sarawak.6This study considered the difference by sex which the NHMS II did not. There was no significant difference in the overweight category. Neither was there a significant difference in obesity among men. But women in Sabah (8.4%) and Sarawak (9.33%) were much less obese than in Peninsular Malaysia (12.5-13.8%). Women in the Southern Peninsular states had the highest prevalence of obesity (13.8%).
Most studies in the twenty-first century has found no difference in the prevalence of overweight and obesity between rural and urban areas.6,7,8,9,10
Although large national studies provide a picture of the average and overall prevalence of obesity, the Malaysian population is not homogenous. Age, sex, locality and social characteristics produce variations in the prevalence of obesity. Several small localised studies have mapped out finding is certain pockets of the population. Table VIII shows the prevalence of obesity found in several of these studies.
Social and Economic Factors Education
A common finding in the large nutritional status population studies is that those with tertiary education have slightly lower than those with primary and secondary education.4,6,8,9,10 However those with no education have the lowest overweight and obesity rates.
Occupation
The studies have not exhaustively nor consistently listed all occupations. However, one category that are often most obese are the Administrative,4or Senior Officer/Manager8 or as listed in the NMHS 2011; Government/Semi government employee.9,10 Although these terms are not equivalent, these categories have been the most obese or overweight in their respective studies. On the other hand, professionals are not usually most obese. Retirees were not an obese group before but are in 2015 group with high obesity.10 Private employees and those self-employed are less obese.9,10 The other occupation group that is also either most overweight or obese are housewives.8,9,10Nazri et.al44and Lim et.al 45report that shift work was associated with higher BMI among male and female factory workers. Moy et.al reported similar findings among mainly female medical care shift workers.46
Income
The prevalence of obesity in Malaysia shows that food availability is to a large extent is no longer dependant on having enough income. There is a trend that the prevalence of overweight and obesity rises slowly from the poorest groups to the personal or household income level of RM4,000 a month.4,8,9After that, the prevalence drops slightly at first, in the RM4,000-RM5,000 bracket and noticeably in the >RM5,000 bracket. In the NMHS II data the lowest income group (<RM400) did appear to have noticeably lower prevalence of overweight (24.9%) and obesity (11.5%) compared to a few brackets above (eg RM1,000-RM1,999 = 30% overweight, 15.4% obesity)4but in the NMHS 2011, that poorest bracket (<RM400) have higher rates than the brackets above it.9 Tan AKG et al. however have contrary conclusions analysing data from the Malaysia Non-Communicable Disease Surveillance-1(MyNCDS-1).47 The NHMS 2015 records income <RM1,000 as the lowest bracket, and there is a slight rising trend with income up to the RM9,000-RM10,000 bracket. The with income above RM10,000 drop in obesity rates.10
Dunn et. al. have analysed the relationship between socioeconomic characteristics and BMI between Malays and Chinese by quintile regression and concluded that reduction of economic inequality is unlikely to eliminate obesity disparities between Malays and Chinese.50Increased effort to alter lifestyle behaviour, they believe, are required.
Abdominal Obesity(AO) and other measures of obesity There has been debate as a result of some evidence that although BMI is easily measured, it is not a good predictor of cardiovascular and obesity related health risks. Waist circumference(WC), a proxy measure of body fat is said to be a better predictor.51BMI is even a poorer predictor of body fat in Asian ethnic groups when calculations derived from a Caucasian population is used. There is concern that among Asians the risk of diabetes and other chronic diseases starts to increase even when BMI or waist circumference are well within the accepted range for Europeans52 and it has been suggested that in Asians, the BMI cut-offs should be 23.0kg/m2for overweight and 27.0 kg/m2 for obese, lower than the WHO criteria.53,54,55
Investigating Cut-off Values
Asians are thought to be more prone to central or visceral obesity (AO). Studies have therefore been done to find more suitable parameters for obesity and its relationship to cardiovascular disease, dyslipidaemia, hypertension and diabetes among Asians56,57 and it has been replicated in Malaysia.58,59 Using Receiver Operating Characteristic(ROC) analysis to compare the predictive validity and optimal cut-off values, and the Area under the curve (AUC) to determine its diagnostic power, Zaki et. al. found the optimal cut-off value for WC varied from 92 cm in men and from 83-88cm in women in Malaysia, in a sample size of 1,893 individuals from 93 primary care clinics.58 They also found the optimal BMI cut-off values predicting dyslipidaemia, hypertension, diabetes mellitus or at least one CVD risk factor varied from 23.5-25.5 kg/m2in men and 24.9-27.4 kg/m2in women. They concluded that WC may be a better indicator for predicting obesity related CVD risk. BMI is also a weak predictor for diabetes and WC appeared to be better. They also found that at a cut-off for WC>90 cm for men and >80 cm for women, AO was present in approximately 71% patients with lipid disorder, in 76% with hypertension and in 75% with diabetes.60 Aye and Malek also noted WC was a better predictor than BMI of metabolic risk factors for developing going by the IDF definition of Metabolic Syndrome.59 The optimal cut-off point of WC they found to predict individual metabolic risk was 84.5–91.0 cm in females and 86.5–91.0 cm for males.
In Caucasian populations the recommended cut-off points for waist circumference are, Waist Action Level 1 (overweight): ≥ 94 cm for men and ≥80cm for women; and Waist Action Level 2 (obese) ≥ 102 cm for men and ≥ 88 cm for women. Using data from 32,773 subjects who participated in the NHMS III, Kee et. al. found that the ROC analyses showed that the appropriate screening cut-off points for WC to identify overweight subjects with BMI≥25kg/m2was 86.0 cm for men (sensitivity=83.6%, specificity=82.5%), and 79.1 cm for women (sensitivity=85.0%, specificity=79.5%). The cut-off points to identify obese subjects with BMI≥30 kg/m2
was 93.2 cm for men (sensitivity=86.5%, specificity=85.7%) and 85.2 cm for women (sensitivity=77.9%, specificity=78.0%).61
Prevalence of AO
Using standard WC cut-offs of>102 cm in men, >88 cm in women (WHO 1998) Kee et.al. found the overall national prevalence of AO among Malaysian adults in the NHMS III was 17.4%.62 The prevalence was much higher in women (26.0%) than in men (7.2%) (OR: 4.2). The prevalence of AO increased steadily with age until the age of 50 to 59 years, after which the prevalence declined. The prevalence was higher among the Indians (OR: 3.0) and Malays (OR: 1.8) compared to others. With regard to marital status, respondents who were ever married had the higher risk of AO compared to not married (OR: 1.4). As with obesity measured by BMI, an inverse relationship was observed between the level of education and prevalence of AO. Respondents who received no formal education had the highest prevalence at 23.7%, followed by those with primary education (21.2%), secondary education (15.2%) and tertiary education (12.1%). By occupational status, housewives had the highest prevalence of AO compared to other occupations (OR: 1.4, 95% CI: 1.1, 1.7). Among the household income categories, prevalence of AO was lowest in households with greater than RM5000(13.7%) Income groups between RM1000-3000 had highest rates (18.2-18.4%). The prevalence of abdominal obesity among the elderly (≥60years) in the NHMS III in 2006 was 21.4%, 33.4% for women and 7.4% for men.11
The prevalence of abdominal obesity by the same criteria rose to 23% in NHMS 2015, with a similar pattern if differences between groups.10Using the WC cut-off of >90cm in men and >80cm in women, the prevalence of AO was 48.6%.
A normal BMI may hide individuals with health risks due to excess fat present as AO. Norafidah et. al.noted that being female and non-Malay were factors that were found to be associated with abdominal obesity in the normal BMI population.63
Body Fat Percentage
In a study excluding underweight individuals, Goonasegaran et al. put forward the case that body fat percentage (BFP) measuring neck, waist and hip circumference and using the US Navy formula, was a superior measure of obesity to BMI better at differentiating between lean mass and adipose tissue in those mildly obese or overweight.64
Morbid Obesity
A Review of Adult Obesity Research in Malaysia
highest rate, and housewives (1.5%) the occupation group most morbidly obese. By 2011 the overall prevalence of morbid obesity had risen to 1.3%. Females (1.7%) continued to outnumber males(1.0%).9Indians(2.7%) continued to be most affected, followed by Malays(1.9%) but Chinese (0.3%) appeared to be significantly less affected. In NHMS 2015 the rate of morbid obesity crept up to 1.4%, and the peak age was seen among the 30-34 years group(2.2%).10Further comment may be unreliable because the counted numbers are small.
RISK FACTORS
Obesity develops when energy intake exceeds expenditure. While recognizing that genetic factors and human metabolism can modify the development of obesity, it is obvious that the two greatest driving forces for the rising prevalence of obesity in Malaysia today are the increase of food availability and resulting food consumption linked with inadequate physical activity.
The end of the twentieth century saw economic development in Malaysia that made food easily available. The per capita gross national product of Malaysia grew an average of 8% per annum between 1980-2000.65 Urbanisation rose from 25% in 1969 to 41% in 1990 and is expected to reach 60% by 2020.66 Poverty rates fell. The opportunity to become overweight opened up for many.
Food Intake
The quantity and type of food available in Malaysia over the last several decades allow us to understand the rise in prevalence of obesity in the population. Total availability of calories per capita per day in Malaysia was estimated at 2430 kcal in 1961 and increased to 2923 - 2990 kcal in 2007, a 20% increase over 40 years.67,68Although food availability actually fluctuates from year to year, Davey et.al.point out that in no year after 1992 was there less than 2780 kcal available per capita per day.69 The FOA food balance sheet shows that available food calories has not continued to rise the last 10 years (Figure 7). Rising prosperity meant the proportion of household income spent on food and non-alcoholic beverages declined from 23.8% in 1992-4 to 20.3% in 2009-10, even though in absolute terms the amount spent was RM1161 in 1992-4 compared to RM2190 in 2009-10.66 Calories available from animal products per capita per day rose from 267 kcal in 1967 to 485kcal in 2007, a rise of 82%, but Figure 7 shows that according to FAO food balance sheet the amount of fats and protein available per capita has also remained stable. The amount of available sugar and sweeteners per capita per year rose from 28.8 kg to 48.7kg between 1967 and 2007, a rise of 70%. On the other hand the proportion of calories obtained from cereals decreased from 61% to 41% (Figure 8). For a long time while the price of sugar rose in the world market, its price to the consumer in Malaysia was kept low by a hefty subsidy from the government which was only removed in the year 2014.70 Given there exists some inequality of distribution, the abundance of food explains why almost any segment of the population can become obese.
Data about what the actual energy intake of individuals are is less clear. The mean calorie intake in poor villages, in the
1980s and 1990s, was noted to be 1870 kcal per person per day.71A 3-day food record survey of 409 adults with normal BMI across Malaysia in 1992-3 recorded a mean energy intake of 2163kcal/day among the men and 1718 kcal/day among women respectively.72 Overall, 14% of the total energy was derived from protein, 23% from fat and 63% from carbohydrate, but urbanites consumed a higher proportion of energy in fats (29%) compared to rural subjects (20%). The energy intake of Indians, surprisingly, was significantly lower than that of other ethnic groups. Malay women recorded a significantly higher energy intake than other ethnic groups. Urban male subjects consumed significantly more energy (2275 kcal) than their rural counterparts (2024 kcal), but this was not the case in women. In both men and women, fat intake was significantly higher in Chinese and urban subjects.72 Among three similar studies of urban post-menopausal Malay and Chinese women, the investigators reported similar energy distribution of their subjects’ dietary intake, which consisted of 53-55% carbohydrate, 15-17% protein and 29-30% fat. Malay women reported a higher daily calorie intake (mean values 1649-1747 kcal) compared to Chinese women (mean values 1550-1591 kcal).73,74,75 Among Malay women Employee Provident Fund(EPF) office workers in Kuala Lumpur and Selangor, Lee et. al. found that the mean energy intake for normal weight, overweight and obese subjects was 1685±199 kcal/day, 1810±166 kcal/day and 2119±222 kcal/day, respectively.21 Evidence that the economic transformation of Malaysia from a rural agrarian economy to an urban commercial society has impacted dietary habits can be seen in a dietary survey of selected women electronic factory workers by Lim et. alin 2000. Even though it was only a selected/invited sample of 122 women, of whom one third each was normal/underweight, overweight and obese, it revealed that such women tended to eat meals at irregular hours (61.5%) and nearly half thought healthy foods did not taste nice (47.5%) or were expensive (45.1%). They had a high frequency of taking foods high in fat content and of a diet lacking in variety. Living in a hostel, surprisingly, was a factor associated with less risk of obesity, but the similarity of frequency of pattern of food consumption led the investigators to believe they shared the risk of being obese in the future. Exercise, even when reported, did not reach an intensity to be of benefit. Only 39.3% reported ever trying to lose weight. However, their preference was for slimming products rather than a healthier lifestyle or dietary changes.45
Suriani et al.surveyed overweight and obese working women regards barriers they faced controlling food intake. As regards not eating healthily more frequently the commonest reasons were ‘lack of knowledge’ (79.3%), followed by ‘lack of motivation’ (72.1%) and ‘family commitment’ (71.4%). As regards controlling the quantity of food the commonest responses were ‘attend meetings often’ (60.0%), followed by ‘difficult when eating out’ (57.9%).76