Genetic diversity and phylogenetic relationships among
fi
ve
endemic
Pinus
taxa (Pinaceae) of China as revealed by SRAP
markers
Qing Xie, Zhi-hong Liu, Shu-hui Wang, Zhou-qi Li
*College of Forestry, Northwest A&F University, Yangling 712100, PR China
a r t i c l e
i n f o
Article history:
Received 30 January 2015
Received in revised form 1 August 2015 Accepted 7 August 2015
Available online 24 August 2015
Keywords: Pinus SRAP
Genetic diversity Phylogenetic relationship
a b s t r a c t
The genetic diversity and phylogenetic relationships amongfive endemicPinustaxa of China (Pinus tabulaeformis, P.tabulaeformisvar.mukdensis, P.tabulaeformisf.shekanensis, Pinus massonianaandPinus henryi) were studied by SRAP markers. Using 10 SRAP primer pairs, 247 bands were generated. The percent of polymorphic bands (94.8%), Nei's genetic diversity (0.2134), and Shannon's information index (0.3426) revealed a high level of ge-netic diversity at the genus-level. At the taxon level,P.tabulaeformisf.shekanensisandP.
henryishowed a higher genetic diversity than the others. The coefficient of genetic dif-ferentiation among taxa (0.3332) indicated a higher level of genetic diversity within taxon, rather than among taxa. An estimate of geneflow among taxa was 1.0004 and implied a certain amount of gene exchange among taxa. The results of neighbor-joining cluster analysis and principal co-ordinate analysis revealed thatP. tabulaeformis, P.tabulaeformis
var.mukdensisandP. tabulaeformisf. shekanensiswere conspecific, which was in agree-ment with the traditional classification. Phylogenetic relationships analysis also indicated thatP. henryimight be a distinct species closely related toP. tabulaeformis.
©2015 Elsevier Ltd. All rights reserved.
1. Introduction
The genusPinusconsists of approximately 100 species and widely distributed throughout the Northern Hemisphere. A total of 22 species and 10 varieties of the genusPinusare distributed in China, and 11 of them are endemic (Song, 2009). In the present study,five endemicPinustaxa from China (includingPinus tabulaeformisCarr.,P.tabulaeformisvar.mukdensisUyeki,P. tabulaeformisf. shekanensisYao et Hsü,Pinus henryiMast. andPinus. massonianaLamb.) were analyzed. Allfive pines are geographically and phylogenetically closer to each other than to any other Chinese pines (Editorial board offlora of China, 1978).P.tabulaeformisis a dominant species of the coniferous forest in northern China (Chen et al., 2008). Its current dis-tribution center lies between the Taihang Mountains of Shanxi province and the Ziwuling mountains of Shaanxi province, making up about 70% of the pine-forested area (Xu et al., 1993).P.tabulaeformisvar.mukdensisis a variety ofP.tabulaeformis (Editorial board offlora of China, 1978) andP.tabulaeformisf. shekanensisis a form ofP.tabulaeformis(Le, 1957).P.massoniana is the most widely distributed pine species in China, and has expanded rapidly to reach an estimated area of 5.7 million hectares (Zhang et al., 2010).P. henryi,first described in 1902 by Masters, is a rare and endemic pine in China. There is a
*Corresponding author.
E-mail address:[email protected](Z.-q. Li).
Contents lists available atScienceDirect
Biochemical Systematics and Ecology
j o u r n a l h o m e p a g e :w w w . e l s e v i e r . c o m / l o c a t e / b i o c h e m s y s e c o
controversy regarding the taxonomic position ofP. henryi. It was initially synonymized withP. tabulaeformis byCheng (1930), then treated as a variety ofP.massoniana(Wu, 1956; Kuan, 1983), and then regarded as a variety (Guan, 1982) or subspecies (Businsky, 1999) ofP.tabulaeformis, and more recently identified as a distinct species (Zheng and Fu, 1978; Niu, 1990; Zhang et al., 1995; Zhao and Liu, 2010).
Molecular marker systems have been demonstrated to be useful tools for studying genetic diversity and phylogenetic relationships of species or populations (Liu et al., 2013; Xu et al., 2013; Liu et al., 2014). Sequence-related amplified poly-morphism (SRAP) is a molecular marker system developed for selective amplification of open reading frames (Li and Quiros, 2001). These polymorphisms result mainly from various promoters, introns and spacers among different species and in-dividuals. SRAP is a highly reproducible and informative technique for assessing genetic diversity in comparison with other PCR-based techniques (Li and Quiros, 2001; Gulsen et al., 2005). SRAP markers have been successfully used in genetic di-versity, gene tagging, map construction, and phylogenetic studies in a wide range of plants (Zhou et al., 2011; Majid et al., 2012; Liu et al., 2013; Chen et al., 2014; Li et al., 2014).
In the present study, SRAP markers were employed to assess the genetic diversity and phylogenetic relationships ofP. tabulaeformis, P.tabulaeformisvar.mukdensis, P.tabulaeformisf. shekanensis, P.henryiandP.massoniana. The main objectives of this study were to (1) examine the genetic diversity and phylogenetic relationships of thefive pines; (2) assess the taxonomic status ofP.henryi.
2. Materials and methods
2.1. Plant materials and DNA extraction
Five taxa ofPinuswere analyzed in this study includingP.tabulaeformis, P.tabulaeformisvar.mukdensis, P.tabulaeformisf. shekanensis, P.henryiandP.massoniana. The locations of taxa and the sampled number are shown inTable 1. Fresh needles were sampled from individual adult trees from each population. The distances between sampled trees varied from 50 to 100 m depending on the population size, to ensure that the sampled trees truly represented their populations. To avoid degradation of plant tissues, all samples were labeled and kept in sealed bags with silica gel according to the method pro-posed bySytsma et al. (1993)until DNA extracted.
Total genomic DNA of each plant was extracted from silica gel-dried needles using a DNA secure plant kit (TIANGEN Biotech Co., Ltd., Beijing, China). The quality and concentration of the DNA were determined by electrophoresis on 1.5% agarose gels.
2.2. SRAP-PCR amplification
Ten pairs of SRAP primers were used in the present study (Table 2), which were selected from 100 combinations of 10 forward and 10 reverse primers. The protocol for SRAP analysis was based onLi and Quiros (2001). Each 20
m
L PCR reaction mixture consisted of 40 ng genomic DNA, 1PCR buffer, 2.5 mM MgCl2, 0.2 mM dNTPs, 0.5 mM for each primer and 1 unit of Taq polymerase. PCR cycling parameters included 4 min of denaturing at 94C,five cycles of three steps: 1 min of denaturing at 94C, 1 min of annealing at 35C and 1 min of elongation at 72C. In the following 35 cycles the annealing temperature was
increased to 50C, and for extension, one cycle of 7 min at 72C. The ampli
fication products were separated by 6% poly-acrylamide gel electrophoresis (PAGE) and visualized by a simplified silver staining method previously described byXu et al. (2002).
2.3. Data analysis
SRAP amplified fragments, with the same mobility according to their molecular weight (bp), were scored in terms of a binary code as present (1) or absent (0). Only those consistently reproducible bands were scored, and smeared and weak bands were excluded. The resulting 1/0 matrix was analyzed using POPGENE v.1.32 (Yeh et al., 1999), assuming Har-dyeWeinberg equilibrium, to estimate genetic diversity parameters: the percentage of polymorphic loci (PPB), Nei's genetic diversity (H) (Nei, 1973), Shannon's information index (I) (Lewontin, 1972), the coefficient of genetic differentiation (Gst), and geneflow (Nm).
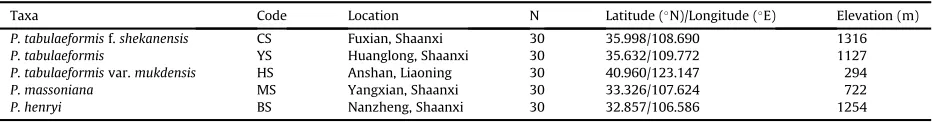
Table 1
Locations of the sampledPinustaxa and the sampled number (N).
Taxa Code Location N Latitude (
N)/Longitude (
E) Elevation (m)
P.tabulaeformisf.shekanensis CS Fuxian, Shaanxi 30 35.998/108.690 1316
P.tabulaeformis YS Huanglong, Shaanxi 30 35.632/109.772 1127
P.tabulaeformisvar.mukdensis HS Anshan, Liaoning 30 40.960/123.147 294
P.massoniana MS Yangxian, Shaanxi 30 33.326/107.624 722
P.henryi BS Nanzheng, Shaanxi 30 32.857/106.586 1254
The 1/0 matrix was transformed into the Nei&Li genetic distance matrix by FreeTree (Hampl et al., 2001). Using the Nei& Li genetic distance matrix, the phenograms were conducted with MEGA 4.0 (Tamura et al., 2007) via the neighbor-joining method. Nei's unbiased genetic distances were used to construct neighbor-joining tree (NJ tree) offive pines by MEGA 4.0. In addition, principal co-ordinate analysis (PCoA) in GenAlEx 6.5 (Peakall and Smouse, 2012) was employed to further examine the genetic relationships among detected taxa.
3. Results and discussion
3.1. SRAP polymorphism
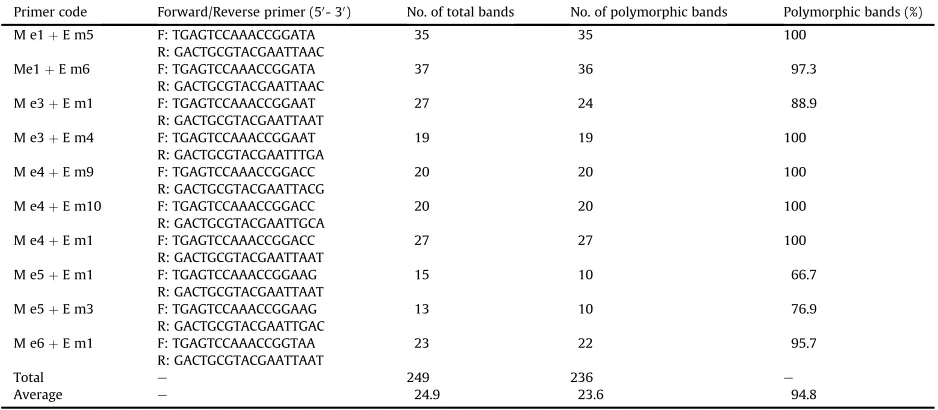
Ten SRAP primer pairs (Table 2) were used to estimate the genetic relationships amongfivePinustaxa. With 10 SRAP primer pairs and 150 samples fromfivePinustaxa, 249 bands were scored, with an average of 24.9 bands per pair. Among these bands, 236 were polymorphic, with an average of 23.6 polymorphic bands per pair and 94.8% mean percentage of polymorphic band (Table 2). The results of each pair revealed high levels of polymorphism in thefive pines, similar to previously published reports inPinusspecies (Xu et al., 2008; Feng et al., 2009; Di and Wang, 2013).
3.2. Level of diversity and molecular variance
The genetic diversity analysis ofPinustaxa, by SRAP, gave the following results: 94.8% for the percentage of polymorphic bands (PPB), 0.2134 for Nei's genetic distance (H), and 0.3426 for Shannon's information index (I), which indicated a high level of genetic diversity at the genus-level. The genetic diversity of each taxon varied as follows: PPB from 50.0% to 75.7%, H from 0.1374 to 0.2063 and I from 0.2125 to 0.3215. The trend of H matched that of I. The trend in the genetic diversity indexes of each taxon was:P.tabulaeformisf.shekanensis(PPB¼75.7%, H¼0.2063, I¼0.3215)>P.henryi(PPB¼68.5%, H¼0.2048, I¼0.2761)>P.tabulaeformis(PPB¼62.4%, H¼0.1751, I¼0.2704)>P.tabulaeformisvar.mukdensis(PPB¼61.9%, H¼0.1689,
I¼0.2635)>P.massoniana(PPB¼50.0%, H¼0.1374, I¼0.2125) (Table 3).
Numerous examples in previous studies showed that species with a small geographic range generally maintain less ge-netic diversity than geographically widespread species (Gitzendanner and Soltis, 2000; Wu et al., 2004; Zheng et al., 2012). However, our data suggest that the taxa restricted to narrow populations (P. tabulaeformisf.shekanensisandP. henryi) were more diverse thanP. tabulaeformisandP. massoniana, two species that are widely distributed.Hamrick and Godt (1989) concluded that the primary factors influencing the genetic diversity of plant populations include breeding system, distri-bution range, and habit. Plant species with higher genetic variation are usually characterized by long life span, wide geographic distribution, predominant outcrossing, anemophily, good fecundity, and a late stage of succession. Thus, the higher level of genetic diversity observed withinP.tabulaeformisf.shekanensisandP.henryimay be related to their late stage of succession. Additionally, in this paper, each taxon, no matter its distribution, selected only in one population may be another reason.
The Gst was 0.3332, indicating that 33.32% of the genetic variance occurred among taxa and 66.64% was within taxon, which implied that the genetic diversity of thefive pines analyzed mainly occurs within taxon, rather than among taxa. Nm Table 2
Polymorphic analysis ofPinustaxa using different SRAP primers.
Primer code Forward/Reverse primer (50 - 30
) No. of total bands No. of polymorphic bands Polymorphic bands (%)
among taxa was 1.0004, suggesting a high frequency of gene exchange among populations. The factors that affect the genetic structure of plant populations include the evolutionary history, mutation, genetic drift, mating system, geneflow, natural selection and life form (Zhang et al., 2012; Wang et al., 2014). Mating system and geneflow are the main explanations for the genetic structure of thefive pines. In this research, mating system plays the most fundamental role in the evolution of species, which results in various genotypes after natural selection. Different mating methods can produce different ratios of het-erozygous and homozygous genotypes. This results in a distribution of genetic variability within and among populations and affects the genetic structures (Wang et al., 2011). Typically outcrossing species maintain relatively more of their genetic diversity within populations rather than among populations (Wang et al., 2014), which agrees with our analysis ofPinus. Additionally,Hamrick and Godt (1989)found that if Nm>1, then geneflow neutralizes the variance in genes caused by
genetic drift. In this study, the geneflow (Nm) of thefive pines was 1.0004. This result demonstrated that geneflow happens frequently among taxa, which suggests a low level of genetic variation among taxa.
3.3. Phylogenetic analysis
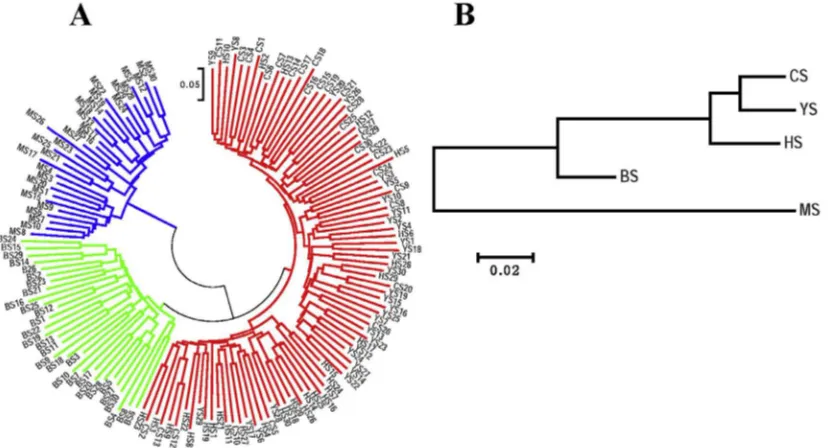
Based on the obtained distance matrix, Neighbor-joining tree (NJ-tree) was constructed to show the genetic relationship amongfivePinustaxa (Fig. 1). Samples ofP.tabulaeformis, P.tabulaeformisvar.mukdensisandP. tabulaeformisf. shekanensis intimately and intricately clustered together, while samples of P. henryi and P. massoniana clustered within 2 well-differentiated groups in the NJ dendrogram (Fig. 1A).P. massonianaappeared to be the most genetically differentiated.P. henryioccupied an intermediate position, whileP.tabulaeformisandP.tabulaeformisf. shekanensiswere the most closely related (Fig. 1B).
Principal co-ordinate analysis (PCoA) was performed to provide a spatial representation of the relative genetic distances among individuals and to determine the consistency of differentiation among taxa defined by cluster analysis. Thefirst 2
Table 3
Genetic diversity offivePinustaxa revealed by SRAP markers.
Taxa code PPB (%) H I
CS 75.7 0.2063 0.3215
YS 62.4 0.1751 0.2704
HS 61.9 0.1698 0.2635
MS 50.0 0.1374 0.2125
BS 68.5 0.2048 0.3128
Mean 63.7 0.1787 0.2761
Taxa level 94.8 0.2134 0.3426
Notes: PPB, percentage of polymorphic bands; H, Nei's genetic distance; I, Shannon's information index. Taxon codes are identified inTable 1.
Fig. 1.Neighbor-joining (NJ) diagram derived from SRAP markers of: A, 150 individuals (5 taxa); B,fivePinustaxa. Individual or taxon codes are identified in Table 1.
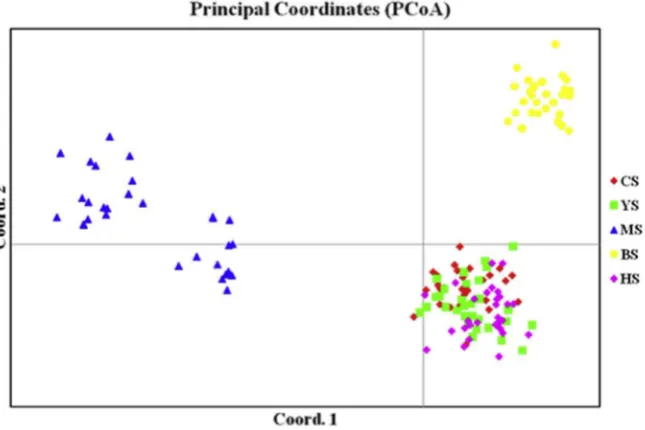
principal components explained 41.5% and 17.34% of the total variation, respectively, while 72.0% was explained by thefirst 3 components. PCoA clustering based on SRAP data revealed that three groups existed in the investigatedfive pines, which were group I:P.tabulaeformis, P.tabulaeformisvar.mukdensisandP. tabulaeformisf. shekanensis; group II:P. henryiand group III:P. massoniana(Fig. 2).
The results of neighbor-joining cluster analysis and PCoA analysis a revealed that there were distinctly phylogenetic re-lationships among five investigated taxa ofPinus. P. tabulaeformis, P.tabulaeformisvar.mukdensisandP. tabulaeformis f. shekanensisgrouped into one cluster and distinctly separated fromP.massonianaandP. henryi(these two taxa also differ-entiate from each other) indicated thatP. tabulaeformis, P.tabulaeformisvar.mukdensisandP. tabulaeformisf. shekanensiswere conspecific, which was in agreement with the traditional classification (Le, 1957; Editorial board offlora of China, 1978). These results also indicated thatP. henryimight be a distinct species rather than a subspecies ofP.tabulaeformisorP.massoniana, although it is closely related toP. tabulaeformis.
Acknowledgments
The authors are grateful to Suo Zhang, Yubo Shi, Fuyong Sun and Junqiang Ran for their assistance infiled observation and sample collection. We also sincerely thank Ming Li and Yueer Bai for their assistance in data analysis. This research was financially supported by the National Natural Science Foundation of China (No. 30972382).
References
Businsky, R., 1999. Taxonomic revision of Eurasian pines (genusPinusL.): survey of species and infraspecific taxa according to latest knowledge. Acta Pruhon. 68, 7e86.
Chen, Y.P., Zhang, L.W., Qi, J.M., Chen, H., Tao, A.F., Xu, J.T., Lin, L.H., Fan, P.P., 2014. Genetic linkage map construction for white jute (Corchorus capsularisL.) using SRAP, ISSR and RAPD markers. Plant Breed. 133, 777e781.
Chen, K.M., Richard, J.B., Richard, I.M., Tian, X.M., Liu, J.Q., 2008. Phylogeography ofPinus tabulaeformisCarr. (Pinaceae), a dominant species of coniferous forest in northern China. Mol. Ecol. 17, 4276e4288.
Cheng, W.C., 1930. A Study of the Chinese Pines. Contrib. Biol. Lab. Sci. Soc. China Bot. Ser., 6, pp. 5e21.
Di, X.Y., Wang, M.B., 2013. Genetic diversity and structure of naturalPinus tabulaeformispopulations in North China using amplified fragment length polymorphism (AFLP). Biochem. Syst. Ecol. 51, 269e275.
Editorial board offlora of China, 1978. Flora of China, vol. 4. Pinaceae, Science Press, Beijing.
Feng, F.J., Chen, M.M., Zhang, D.D., Sui, X., Han, S.J., 2009. Application of SRAP in the genetic diversity ofPinus koraiensisof different provenances. Afr. J. Biotechnol. 6, 1000e1008.
Gitzendanner, M.A., Soltis, P.S., 2000. Patterns of genetic variation in rare and widespread plant congeners. Am. J. Bot. 87, 783e792. Guan, Z.T., 1982. Geography of Pinaceae and Taxodiaceae in Sichuan Chengdu. People Publishing House, Chengdu.
Gulsen, O., Shearman, R.C., Vogel, K.P., Lee, D.J., Baenziger, P.S., Heng-Moss, T.M., Budak, H., 2005. Nuclear genome diversity and relationships among naturally occurring buffalo grass genotypes determined by sequence-related amplified polymorphism. HortScience 40, 537e541.
Hampl, V., Pavlicek, A., Flegr, J., 2001. Construction and bootstrap analysis of DNAfingerprinting-based phylogenetic trees with the freeware program FreeTree: application to trichomonad parasites. Int. J. Syst. Evol. Microbiol. 51, 731e735.
Hamrick, J.L., Godt, M.J.W., 1989. Allozyme diversity in plant species. In: Brown, A.H.D., Clegg, M.T., Kahler, A.L., Weir, B.S. (Eds.), Plant Population Genetics, Breeding, and Genetic Resources. Sinauer, Sunderland, MA, pp. 43e63.
Kuan, C.T., 1983. Flora Sichuanica 2 (Gymnosperm). Sichuan Science Technology Press, Chengdu.
Fig. 2.Distribution of 150 individuals (5 taxa) ofPinusin the plane of thefirst two principal coordinates. Thefirst and second axis extracted 52.47% and 16.18% of the total genetic variance, respectively. Taxon codes are identified inTable 1.
Le, T.Y., 1957. The Shannxi-Gansu-Ningxia Basin Flora. Chinese Forestry Publishing House Press, Beijing. Lewontin, R.C., 1972. The apportionment of human diversity. Evol. Biol. 6, 381e398.
Li, M., Zhao, Z., Miao, X.J., 2014. Genetic diversity and relationships of apricot cultivars in North China revealed by ISSR and SRAP markers. Sci. Hortic. 173, 20e28.
Li, G., Quiros, F., 2001. Sequence-related amplified polymorphism (SRAP), a new marker system based on a simple PCR reaction: its application to mapping and gene tagging inBrassica. Theor. Appl. Genet. 103, 455e461.
Liu, F., Guo, Q.S., Shi, H.Z., Wang, T., Zhu, Z.B., 2013a. Genetic diversity and phylogenetic relationships among and within populations ofWhitmania pigraand Hirudo nipponicabased on ISSR and SRAP markers. Biochem. Syst. Ecol. 51, 215e223.
Liu, M.Q., Ding, M.M., Chen, L.J., Yang, K.X., Hui, W.K., Li, J.C., Chen, X.Y., 2014. Genetic diversity and relationships amongCanavalia ensiformis(L.) DC. Accessions as revealed by sequence-related amplified polymorphism markers. Biochem. Syst. Ecol. 57, 242e247.
Majid, T., Mahboubeh, K., Ebrahim, S.T., 2012. Genetic linkage maps ofDendrobium moniliformeandD. officinalebased on EST-SSR, SRAP, ISSR and RAPD markers. Biochem. Syst. Ecol. 44, 179e185.
Nei, M., 1973. Analysis of gene diversity in subdivided populations. Proc. Natl. Acad. Sci. U. S. A. 70, 3321e3323. Niu, C.S., 1990. Woody Flora of Shannxi. Chinese Forestry Publishing House, Beijing.
Peakall, R., Smouse, P.E., 2012. GenAlEx 6.5: genetic analysis in excel. Population genetic software for teaching and research an update. Bioinformtics 28, 2537e2539.
Song, Z.Q., 2009. Oleoresin Characteristics and Chemical Classification ofPinus. University of Science and Technology of China Press, Hefei, p. 7. Sytsma, K.J., Givnish, T.J., Smith, J.F., Hain, W.J., 1993. Collection and storage of land plant samples for macromolecular comparisons. Methods. Enzymol. 224,
23e37.
Tamura, K., Dudley, J., Nei, M., Kumar, S., 2007. MEGA 4.0: molecular evolutionary genetics analysis (MEGA) software version 4.0. Mol. Biol. Evol. 24, 1596e1599.
Wang, B.Y., Shi, L., Ruan, Z.Y., Deng, J., 2011. Genetic diversity and differentiation inDalbergia sissoo(Fabaceae) as revealed by RAPD. Genet. Mol. Res. 10, 114e120.
Wang, D.Y., Chen, Y.J., Zhu, H.M., Lu, G.S., Zhang, X.P., Shao, J.W., 2014. Highly differentiated populations of the narrow endemic and endangered species Primula cicutariifoliain China, revealed by ISSR and SSR. Biochem. Syst. Ecol. 53, 59e68.
Wu, C.J., Cheng, Z.Q., Huang, X.Q., Yin, S.H., Can, K.M., Sun, C.R., 2004. Genetic diversity among and within populations ofOryza granulatafrom Yunnan of China revealed by RAPD and ISSR markers: implications for conservation of the endangered species. Plant Sci. 167, 35e42.
Wu, Z.L., 1956. The classification and distribution of Pinaceae in China. Acta Phytotaxon. Sin. 5, 153e154.
Xu, H.C., Zhai, M.P., Ma, Q.Y., Dong, S.R., Shen, X.H., Yan, J.J., Zhang, Z.C., Shen, R.X., Shen, G.F., Yang, J.J., 1993. Chinese Pine (Pinus tabulaeformisCarr. China Forest Press, Beijing.
Xu, J.T., Li, A.Q., Wang, X.F., Qi, J.M., Zhang, L.W., Zhang, G.Q., Su, J.G., Tao, A.F., 2013. Genetic diversity and phylogenetic relationship of kenaf (Hibiscus cannabinusL.) accessions evaluated by SRAP and ISSR. Biochem. Syst. Ecol. 49, 94e100.
Xu, S.B., Tao, Y.F., Yang, Z.Q., Chu, J.Y., 2002. A simple and rapid method used for silver staining and gel preservation. Hereditas 24, 335e336.
Xu, S.Q., Tauer, C.G., Nelson, C.D., 2008. Genetic diversity within and among populations of shortleaf pine (Pinus echinataMill.) and loblolly pine (Pinus taeda L.). Tree Genet. Genomes 4, 859e868.
Yeh, F., Yang, R., Boyle, T., 1999. POPGENE v1.32: Microsoft Window-based Freeware for Population Genetic Analysis. Molecular Biology and Biotechnology Center, University of Alberta, Edmonton, Canada.
Zhang, C.X., Zhang, F.Q., Qiu, M.G., 1995. A study on the taxonomy position ofPinus henryiin Nanzheng of Shaanxi. J. Northeast For. Univ. 10, 38e42. Zhang, R., Zhou, Z.C., Du, K.J., 2012. Genetic diversity of natural populations of endangerOrmosia hosiei, endemic to China. Biochem. Syst. Ecol. 40, 13e18. Zhang, Y., Zhou, Z.C., Ma, X.H., 2010. Foraging ability and growth performance of four subtropical tree species in response to heterogeneous nutrient
environments. J. For. Res. 15, 91e98.
Zhao, Y., Liu, Z.L., 2010. Numerical analysis to anatomical structures of needles betweenfive species of pines. J. Northeast For. Univ. 25, 19e24. Zheng, D.J., Xie, L.S., Zhu, J.H., Zhang, Z.L., 2012. Low genetic diversity and local adaptive divergence ofDracaena cambodiana(Liliaceae) populations
associated with historical population bottlenecks and natural selection: an endangered long-lived tree endemic to Hainan Island. China. Plant Biol. 14, 828e838.
Zheng, W.J., Fu, L.G., 1978. Flora reipubicae popularis pinicae. Science Press, Beijing.
Zhou, Y.J., Wang, X.G., Zhang, X.Q., 2011. Development and application of a SRAP marker for the identification of sex inBuchloe dactyloides. Euphytica 181, 261e266.