Comparison of NAA XRF and ICP-OES Methods on Analysis of Heavy Metals
in Coals and Combustion Residues
Agus Taftazani
1,*, Roto Roto
2, Novitasari Restu Ananda
2, and Sri Murniasih
1 1Center for Accelerator Science and Technology, National Nuclear Energy Agency, Jl. Babarsari, Yogyakarta 55281, Indonesia
2
Department of Chemistry, Faculty of Mathematics and Natural Sciences, Universitas Gadjah Mada, Sekip Utara, PO BOX BLS 21, Yogyakarta 55281, Indonesia
Received January 5, 2017; Accepted April 20, 2017
ABSTRACT
Heavy metals in the samples of coals and combustion residues (bottom ash and fly ash) from Pacitan coal-fired power plant (CPP) have been identified by using NAA, XRF, and ICP-OES methods. This research was aimed to understand the analysis results correlation coefficient (R) and determine the enrichment ratio (ER) value of the samples by using three analysis methods. The results showed 10 elements have been simultaneously detected in all samples. The correlation coefficient of analysis results of metals content in coals by using NAA-XRF, XRF-ICP OES and with ICPOES-NAA methods gives R21 respectively. The correlation coefficient of analysis results of metals content in bottom ash and fly ash by using the methods of NAA-XRF, XRF-ICPOES, and ICPOES-NAA gained R21 respectively. ICP-OES method was most satisfactory in this study. The value of ER for identified metals by using the three methods in the samples of bottom ash and fly ash yielded the value over one, and ER value of fly ash was greater in comparison to the bottom ash.
Keywords:bottom ash; fly ash; NAA; XRF; ICP-OES
ABSTRAK
Logam berat dalam sampel batubara dan residu pembakaran batubara (bottom ash dan fly ash) dari PLTU Pacitan telah diidentifikasi dengan menggunakan metode NAA, XRF, dan ICP-OES. Penelitian ini bertujuan untuk mengetahui koefisien korelasi (R) hasil analisis dan menentukan nilai Enrichment Ratio (ER) pada sampel batubara, bottom ash dan fly ash dari ketiga metode analisis. Hasil penelitian menunjukkan telah terdeteksi serentak 10 unsur dalam semua sampel. Koefisien korelasi hasil analisis kandungan logam dalam batubara menggunakan metode NAA-XRF, XRF-ICPOES dan dengan ICPOES-NAA masing-masing diperoleh R21. Sementara koefisien korelasi hasil analisis kandungan logam dalam bottom ash dan fly ash dengan metode NAA-XRF, XRF-ICP-OES, dan ICPOES-NAA masing-masing diperoleh R21. ICP-OES adalah metode analisis paling memuaskan dalam studi ini. Nilai ER untuk logam yang diidentifikasi dengan menggunakan ketiga metode pada sampel bottom ash dan fly ash menghasilkan nilai lebih besar dari satu, dan nilai ER pada fly ash lebih besar dibandingkan dengan bottom ash.
Kata Kunci:bottom ash; fly ash; NAA; XRF; ICP-OES
INTRODUCTION
The combustion process of coals at coal-fired power plant (CPP) produces waste in the form of coal ash at the sum of 2-10%. Coal ash is composed of two types of bottom ash and fly ash. Fly ash is a major part of the coal ash that is 80%. Coal ash contains various kinds of metals. They are metals that can be recovered as Fe, Al and Ca [1]. In addition, it is also indicated that coal ash contains toxic heavy metals, such as Pb, Cr, Cu, Ni, and Cd [2]. State Minister of Life Environmental (KNLH) stated that ash produced from coals combustion product is included in the hazardous and toxic wastes
under Government Rule No.85 of 1999 on Amendment to Government Regulation No. 18 Year 1999 on the management of hazardous and toxic wastes [3].
and simultaneously such as neutron activation analysis (NAA), x-ray fluorescence (XRF) etc., that elemental pathway to the environment could be predicted.
Multi elements technical analysis such as NAA, XRF, and inductively-coupled-plasma-optical-emission-spectroscopy (ICP-OES) were capable for analyzing the elements in the various matrixes of solid sample and they were widely used. Some techniques are used in the analysis each of which has advantages and its disadvantages. Application technique of NAA has its advantages, among of which are multi elements, non-destructive, sensitive, highly selective, the detection limits reaches the nanogram order for the certain elements. This technique also capable in the samples analyzing at the tiny weight of ~0.010 g, the samples to be analyzed could be in the forms of solid (rigid, granular), paste, as well as liquid, and the samples was not easily contaminated after neutron activation. Whereas, ICP-OES technique is a technique enable to analyze the major, minor, and trace elements in the environmental samples. This technique is benefiting of long linear range, highly precision, lower detection limits even down to ppb level, but this technique is destructive technique, so it needs the longer preparation time [5]. Furthermore, the analysis technique that is ordinarily used in the coals laboratory is XRF. This technique needs a cheaper expense and faster compared to NAA and ICP-OES techniques, because it has an easy way of preparing the samples. The sample forms could be solid (granular, massive), paste as well as liquid, non-destructive, as well as an easy way of calibrating. In spite of the advantages mentioned above, XRF technique has a disadvantage in performance, that is, it is influenced by sample matrix and standard, and also needs the different exitation sources (radio isotope) for some elements [6]. The different techniques were used in characterizing coals, bottom ash and fly ash to give an evaluation when one method with others have lacking in determining an element composition.
Patra et al. [7] stated that there are about 16 elements that could be analyzed in the coals, bottom ash, and fly ash by Particle induced X-ray emission spectroscopic (PIXE) which contains major, minor and trace elements. Concentration of heavy metals elements such as Co, Ni, Cu, Zn, Rb, Sr, and Pb in the samples of Indian coals they were detected in low concentration namely between 2.5–4.2 ppm and for Fe and Ti elements were in an adequate highly concentration of 0.33% and 0.15%.
Lim et al. [8] in his research on coals field and its combustion residue at Korea CPP could be determined total content of 31 major to trace elements which could be analyzed using NAA methods accurately. It was
reported that fly ash and bottom ash contain higher concentration compared to that of coals.
Considering the lack of information about the total concentration of elements in coals and coals-residue in Indonesia, this investigation aims at providing the intended information data, by identifying the heavy metals content in the coals and coals residue, by using three instrumental analysis techniques of NAA, XRF, and ICP-OES; finding the correlation coefficient (R) of metals content analysis results by those three methods; as well as determining Enrichment Ratio (ER) for metals content in the bottom ash and fly ash from Pacitan CPP.
EXPERIMENTAL SECTION
Sampling
Samples of coal, bottom ash and fly ash were taken directly at the Pacitan CPP, Sukorejo, District of Sudimoro, Pacitan, East Java, Indonesia on October 20-21, 2014 at the sum of ± 5 kg respectively.
Sample Preparation
Samples of coal, bottom ash and fly ash were finely pound and sieved to pass 170 mesh. After sieved, the samples were then homogenized and determined their water content. Finally, they were inserted into the glass bottle and put in the desiccator.
Secondary Standard Preparation
The use of NAA and XRF methods in this study with the relative technique, namely using an artificial reference standard (secondary standard A and B). Secondary standard of dry mixture A (for coal analysis) and B (for analysis of fly ash and bottom ash). Standard A was made of the solution of 10 elements of liquid standard of Merck, was taken at the amount of 0.10-0.50 mL, mixed and dried with a heating lamp in a 0.5 mL pp vial. Standard B was made of the solution of 10 liquid standard elements of Merck, was taken at the amount of 0.04-7.3 mL, mixed and dried with a heating lamp in a 0.5 mL pp vial.
Homogeneity Test
Sample Analysis Using XRF Method
Samples of coal, bottom ash and fly ash that has been prepared and homogenized, weighed of ± 5 g were put into the polyethylene (PE) bottle lining by mylar plastic, then were analyzed by referring to [10].
Sample Analysis by Using NAA Method
Homogenized samples of coal, bottom ash and fly ash were weighed of ± 0.10 g, put in a 0.5 mL polyethylene vial then glued (glass stirrer was heated with a Bunsen burner). The same matter was done at 0.10 g SRM NIST 1632d Bituminous Coal and 0.10 g SRM NIST 1633c Coal Fly Ash. Subsequently the samples, the secondary standard, primary standard primer (NIST 1632d and NIST 1633c), and blanks were put into the cladding and be ready for being irradiated. The samples were irradiated at the Pneumatic facility for 5 min for a short irradiation and Lazy Susan for 2 × 6 h for medium and long irradiation with a neutrons flux of ~1011n.cm-2.s-1and a power of 100 kW.
Furthermore, the samples, the primary standard, secondary standard, and the blanks were removed then replaced with a new plastic clip. Then they were cooled for 5 min for a short-life, 7 days for middle-life and 20 days for long-life. Furthermore, they were counted in accordance with their half-life (depending on the type of the element being analyzed) where short irradiation (an element of short half-life) was counted for 600 sec, medium irradiation (elements in the medium half-life) was counted for 1000 sec and long irradiation (element of long half-life) was counted for 3600 sec with gamma spectrometer equipped with HPGe detector. After the counting stopped, the results obtained were processed using the software of Genie 2000.
Sample Analysis by Using ICP-OES method
Elemental analysis of Al, K, Na, Fe, Ti, Sr, Ba prepared to ASTM D 6349-13 [11] and the elements of Co, Cr, Cd, Zn, La followed to ASTM D 6357-11 [12] on a sample of coal, fly ash and bottom ash.
RESULT AND DISCUSSION
In this study, it has been conducted a water concentration test (by gravimetric), homogeneity test (major and minor elements by using XRF and single factor ANOVA), the methods validation of XRF and NAA with SRM NIST 1632d Bituminous Coal and SRM NIST 1633c Coal Fly ash, the elemental composition test in coal, bottom ash and fly ash by using three techniques of analysis namely, NAA, XRF, and ICP-OES.
Homogeneity Test
The method of XRF was selected in homogeneity test because it is a cheaper method, fast and easy in the sample preparation. In this homogeneity test, it was only Fe element that was analyzed (representing the major elements) and Sr element (representing the minor elements) in the samples that was being analyzed so it would be known whether from both elements detected in samples of coal, bottom ash and fly ash has been homogenous. The homogeneity test criteria used in the criterion 1, namely if Fcounting<Ftable
then the sample was mentioned to be homogeneous. The value of F was gained from critical table with the confident level of 95% [9]. Results of homogeneity test samples of coal, bottom ash and fly ash are shown in Table 1.
The results of the Ftest for the homogeneity test
(Table 1) using criteria 1 with a 95% confidence level showed that Farithmetic for samples of coal, bottom ash
and fly ash were in the range of 0.673 to 2.805 <Ftable
(3.020). This matter indicates that the sample has been homogenized, so it can be proceed for the analysis of the chemical composition of the sample.
Validation of Analysis Methods
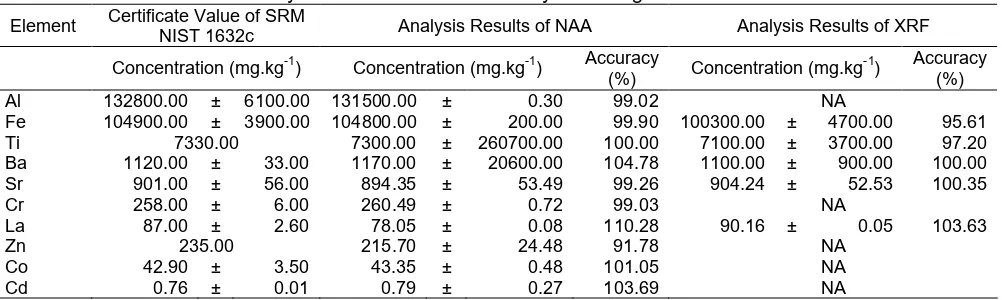
To ensure the quality of the analysis data (QA) of the analysis results, the NAA and XRF analysis methods used validation was prior to be conducted by looking at the accuracy value. Accuracy can be calculated from the comparison of the elements concentration in the measurement results of SRM and in the certificate of SRM. Validation methods have been made by means of testing of SRM NIST 1632d Bituminous-Coal and SRM NIST 1633c Coal Fly ash having matrix similar to the samples, with the data shown in Table 2 and Table 3.
The analysis results at SRM NIST 1633d (Table 2) certificate shows that the range of percentage accuracy for NAA method ranged from 91.23%-113.8% and XRF methods ranged from 92.8%-104.76%. Likewise, the measurement accuracy of certificate of NIST SRM 1633c (Table 3) ranged between 91.78%-110.28% for NAA method and between 95.61%-103.63% for XRF method.
Table 1.Determination of F test samples of coal, bottom-ash, and fly-ash using XRF
Results of F test
Elements Coal Bottom-ash Fly-ash F Table Description 95%
Fe 1.295 0.673 1.971
Sr 1.854 2.805 2.089 3.020 Farithmetic< Ftable
Table 2.Accuracy of SRM NIST 1632d Bituminous coal using NAA and XRF methods
Element Certificate Value of
SRM NIST 1632d Analysis Results of NAA Analysis Results of XRF
Concentration (mg.kg-1)
Concentration (mg/kg)
Accuracy (%)
Concentration (mg.kg-1)
Accuracy (%)
Al 9100.00 ± 50.00 8900.00 ± 3200.00 97.75 NA
Fe 7500.00 ± 200.00 7400.00 ± 490000.00 98.67 7100.00 ± 300.00 94.67
Ti 477.00 ± 10.00 476.00 ± 7.11 99.79 482.00 ± 6100.00 101.05
Ba 40.40 ± 0.89 39.83 ± 0.82 98.54 41.70 ± 0.11 103.14
Sr 63.50 67.89 ± 10.48 106.91 66.50 ± 4.81 104.76
Cr 13.70 12.73 ± 0.09 92.92 NA
La 5.00 5.69 ± 0.01 113.80 4.64 ± 0.13 92.80
Zn 12.90 13.33 ± 2.91 103.33 12.20 ± 2.11 94.81
Co 3.42 ± 0.05 3.12 ± 0.11 91.23 NA
Cd 0.08 ± 0.01 0.08 ± 0.02 100.00 NA
NA = not-analyzed
Table 3.Accuracy of SRM NIST 1632c Coal fly ash using NAA and XRF methods
Element Certificate Value of SRMNIST 1632c Analysis Results of NAA Analysis Results of XRF
Concentration (mg.kg-1) Concentration (mg.kg-1) Accuracy
(%) Concentration (mg.kg
-1
) Accuracy
(%)
Al 132800.00 ± 6100.00 131500.00 ± 0.30 99.02 NA
Fe 104900.00 ± 3900.00 104800.00 ± 200.00 99.90 100300.00 ± 4700.00 95.61
Ti 7330.00 7300.00 ± 260700.00 100.00 7100.00 ± 3700.00 97.20
Ba 1120.00 ± 33.00 1170.00 ± 20600.00 104.78 1100.00 ± 900.00 100.00
Sr 901.00 ± 56.00 894.35 ± 53.49 99.26 904.24 ± 52.53 100.35
Cr 258.00 ± 6.00 260.49 ± 0.72 99.03 NA
La 87.00 ± 2.60 78.05 ± 0.08 110.28 90.16 ± 0.05 103.63
Zn 235.00 215.70 ± 24.48 91.78 NA
Co 42.90 ± 3.50 43.35 ± 0.48 101.05 NA
Cd 0.76 ± 0.01 0.79 ± 0.27 103.69 NA
NA= not-analyzed
analysis of metals in samples of coal, bottom ash and fly ash.
Analysis of Coal
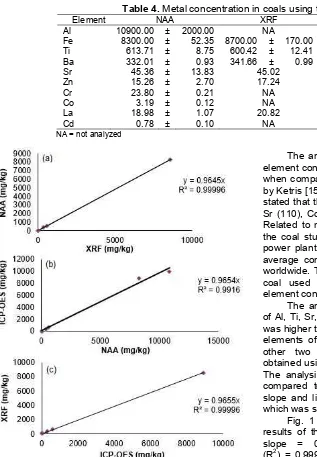
Analysis of samples of Pacitan CPP was done using three methods namely NAA, XRF and ICP-OES. The analysis results of coal samples detected some elements of major, minor and trace, have been 10 elements, namely Al, Fe, Ti, Ba, Sr, Zn, Cr, Co, La, and Cd will be discussed. The average concentration of the identified elements in the coal are shown in Table 4.
Table 4 shows that the relative abundance of the elements in the coal using 3 methods obtained the elements Al> Fe> Ti> Ba> Sr> Cr> La> Zn> Co> Cd. The order of element concentrations obtained in the coal being analyzed resembles a sequence of metallic elements found in the samples crust of the earth,
because coal is the material that is formed from the higher plants residue buried under layers of earth millions of years, so that the elements contained in the coal is not different much from the constituent elements in the earth's crust.
The results of analysis by using three methods showed that the elements of Al and Fe are found most abundantly were included into the two major elements, high concentration of Al at a guess was derived from clay minerals whereas Fe element derived from the pyrite and jarolite mineral. The elements of Ti, Ba, Sr, Cr, La, Zn, Co, and Cd found in low concentrations are expressed as minor elements and trace element.
Table 4.Metal concentration in coals using three methods
Element NAA XRF ICP-OES Unit
Al 10900.00 ± 2000.00 NA 990.00 mg.kg-1
Fe 8300.00 ± 52.35 8700.00 ± 170.00 8900.00 mg.kg-1
Ti 613.71 ± 8.75 600.42 ± 12.41 600.00 mg.kg-1
Ba 332.01 ± 0.93 341.66 ± 0.99 333.48 mg.kg-1
Sr 45.36 ± 13.83 45.02 45.28 mg.kg-1
Zn 15.26 ± 2.70 17.24 17.77 mg.kg-1
Cr 23.80 ± 0.21 NA 22.18 mg.kg-1
Co 3.19 ± 0.12 NA 3.13 mg.kg-1
La 18.98 ± 1.07 20.82 19.42 mg.kg-1
Cd 0.78 ± 0.10 NA 0.75 mg.kg-1
NA = not analyzed
Fig 1. Comparison the element concentration in coals sample obtained by using (a) NAA vs. XRF, (b) ICP-OES vs. NAA, (c) XRF vs. ICP-OES
where the concentration of Al found was most abundantly after Si which ranges from 3.21% and Cd found in coal was the least that was only about 0.37 mg/kg. Research conducted by Sutcu and Karagiyit [14] stated that the main elements such as Al and Fe from the coal sample were mostly associated with silicates and carbonate minerals. Al and Fe were associated with feldspar, quartz and clay mineral. Highly concentration of Al deriving from clay mineral and feldspar whereas Fe element derived from the minerals of pyrite, jarolite, and clay.
The analysis results of minor elements and trace element content of coal Pacitan power plant in Table 4 when compared with worldwide coal deposits reported by Ketris [15], Wang [16], Meravi [17], and Ghodke [18] stated that the range concentration of Cr was (1 to 61), Sr (110), Co (5.1), Zn (23), and Cd (0.01 to 1) mg/kg. Related to minor and trace element concentrations in the coal studied, the element content of coal Pacitan power plant was in the lower range compared to the average concentration of the element content of coal worldwide. This indicates that the kind and the type of coal used each country will produce the different element content.
The analysis results of elemental concentrations of Al, Ti, Sr, Cr, Co, and Cd in coal using NAA method was higher than that of XRF and ICP-OES while for the elements of Fe, Ba, Zn, and La was lower than the other two methods. Overall the analysis results obtained using the three methods were well correlated. The analysis results of coal of these three methods compared to plotting those three methods provides slope and linear regression approaches a value of 1, which was shown in Fig. 1.
Fig. 1 showed that comparison of the analysis results of the coal by using NAA and XRF gave the slope = 0.9645 and the correlation coefficient (R2) = 0.99996. Comparison of the analysis results of coal between ICP-OES versus NAA gave the slope = 0.9654 and R2 = 0.9916. As for the results of the XRF versus ICP-OES gave the slope = 0.9665 and R2 was 0.99996. The analysis result of the of coal using NAA, XRF and ICP-OES methods have a good relationship with each other in giving the analytical results. The study results also showed that the analysis results of the coal by using these three methods did not differ significantly which can be seen from the resulting correlation coefficient namely above 0.99.
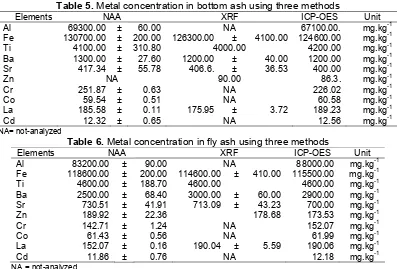
Table 5.Metal concentration in bottom ash using three methods
Elements NAA XRF ICP-OES Unit
Al 69300.00 ± 60.00 NA 67100.00. mg.kg-1
Fe 130700.00 ± 200.00 126300.00 ± 4100.00 124600.00 mg.kg-1
Ti 4100.00 ± 310.80 4000.00 4200.00 mg.kg-1
Ba 1300.00 ± 27.60 1200.00 ± 40.00 1200.00 mg.kg-1
Sr 417.34 ± 55.78 406.6. ± 36.53 400.00 mg.kg-1
Zn NA 90.00 86.3. mg.kg-1
Cr 251.87 ± 0.63 NA 226.02 mg.kg-1
Co 59.54 ± 0.51 NA 60.58 mg.kg-1
La 185.58 ± 0.11 175.95 ± 3.72 189.23 mg.kg-1
Cd 12.32 ± 0.65 NA 12.56 mg.kg-1
NA= not-analyzed
Table 6.Metal concentration in fly ash using three methods
Elements NAA XRF ICP-OES Unit
Al 83200.00 ± 90.00 NA 88000.00 mg.kg-1
Fe 118600.00 ± 200.00 114600.00 ± 410.00 115500.00 mg.kg-1
Ti 4600.00 ± 188.70 4600.00 4600.00 mg.kg-1
Ba 2500.00 ± 68.40 3000.00 ± 60.00 2900.00 mg.kg-1
Sr 730.51 ± 41.91 713.09 ± 43.23 700.00 mg.kg-1
Zn 189.92 ± 22.36 178.68 173.53 mg.kg-1
Cr 142.71 ± 1.24 NA 152.07 mg.kg-1
Co 61.43 ± 0.56 NA 61.99 mg.kg-1
La 152.07 ± 0.16 190.04 ± 5.59 190.06 mg.kg-1
Cd 11.86 ± 0.76 NA 12.18 mg.kg-1
NA = not-analyzed
Yet these two methods were an expensive method and NAA method requires a nuclear reactor and routine maintenance although this method could directly measure accurately in identifying the content in coal samples.
Analysis of Bottom Ash and Fly Ash
Analysis of coal combustion products (bottom ash and fly ash) was performed by using three methods namely: NAA, XRF and ICP-OES.
The analysis results of the major elements to trace elements in the samples of bottom ash and fly ash are detected some elements of major, minor and trace, have been 10 elements, namely Al, Fe, Ti, Ba, Sr, Zn, Cr, Co, La, and Cd will be discussed. The average concentration of the identified elements in the samples are shown in Tables 5 and 6. The total identified 10 elements was reported by Lim [8] were the elements that have a detrimental effect on humans, plants, and animals.
The analysis results in Table 5 and 6 showed that the relative abundance of the concentration of elements in the bottom ash found were Fe> Al> Ti> Ba> Sr> Cr> La> Zn> Co> Cd while on fly ash samples the elements concentration of Fe> Al> Ti> Ba > Sr> La> Zn> Cr> Co> Cd. In general, the chemical composition of the bottom was very similar to the fly ash. The concentration of Al and Fe in bottom ash and fly ash using all these three methods tend to be in large enough concentrations, which was expressed as a major element and to the
elements of Ti, Ba, Sr, Zn, Cr, Co, La, and Cd were in the lower concentrations expressed as a minor element and trace elements. The concentration of Al and Fe were within in the range of 6 and 12-13% at the bottom ash and fly ash ranged between 8 and 11%. Therefore, the both of bottom ash and fly ash samples could be used for cement material because they contained high alumina and iron [19].
The element concentrations of Fe using these three methods tend to be larger than that of the element of Al in the sample bottom ash and fly ash, and for elements of Al on fly ash higher than the bottom ash. This is in contrast to the results of research conducted by Tiwari et al. [6] in which the concentration of the element Al in the bottom ash and fly ash greater than the elements Fe, and Al elements found to be higher in the bottom ash compared with fly ash. This indicates that the element content in the combustion products (bottom ash and fly ash) from the power plant will have different characteristics from other power plants in addition to the type and origin of coal. Analysis results of metals in the bottom ash using NAA obtained metal concentrations of Al, Fe, Ba, Sr, and Cr is greater than the XRF method and ICP-OES. On the fly ash, the concentration of the elements Al, Ti, Cr, Co, La, and Cd using ICP-OES method is greater than in the two other methods that NAA and XRF.
Fig 2. Comparison of concentrations of elements in samples of bottom ash obtained by using (a) ICP-OES vs NAA, (b) XRF vs NAA, (c) ICP-OES vs. XRF
Fig 3.Comparison of the concentration of elements in fly ash samples obtained by (a) XRF vs. ICP-OES, (b) NAA vs XRF, (c) NAA vs. ICP-OES
giving analysis. Besides result, the use of various methods used to see how the correlation between these three methods to provide the results of the analysis element content in samples of bottom ash and fly ash Pacitan CPP. Correlation analysis results using NAA, XRF and ICP-OES were shown in Fig. 2 and 3.
The element concentration comparison in the samples of bottom ash in Fig. 2 shows that the comparison of the analysis results by using ICP-OES method vs NAA giving the slope = 0.9958 and correlation coefficient (R2) = 0.99920. Comparison between XRF vs NAA gave the slope = 0.9657 and R2= 0.99995 while the results of the comparison between the ICP-OES vs. XRF gave the slope = 0.9867 and R2 = 0.99995. Fig. 3 shows the results of elemental concentrations in fly ash by using XRF vs. ICP-OES gave the slope = 1.0187 and correlation coefficient (R2) = 0.99995. Comparison between NAA vs XRF gave the slope = 0.973 and R2= 0.99580 while the results of the comparison between NAA vs ICP-OES gave the slope = 0.9987 and R2= 0.99810. Analysis result by using three methods could be concluded that various methods used
in this research gave the good result one another in determining the element concentration in the fly ash and bottom ash.
Correlation of analysis results obtained by using the three methods was not much different from the results of research conducted by Damastuti [20] which stated that the correlation of analysis results for the concentration of elements in fly ash by using NAA, XRF and AAS methods yielded a good relationship with one another and did not differ significantly in providing analytical results. This is indicated by the correlation coefficient (R2) of the three methods, namely for the correlation between NAA vs XRF method yielded R2= 0.998, XRF vs. AAS method yielded R2= 0.99995 and for the NAA and AAS method yielded R2= 0.982.
Fig 4. Enrichment Ratio (ER) for the elements in the bottom ash and fly ash compared to the elements in the coal using (a) XRF, (b) AAN, and (c) ICP-OES
samples of coal, bottom ash and fly ash could be identified by using the methods of NAA and ICP-OES but they could not be identified by using the XRF method. This is due to the limitation of XRF method, for low concentration of the Cr, Co and Cd elements below the detection limit, while for Al element was not detected because the atomic number <18.
The results of analysis by using three methods also showed that the concentration of Zn in the bottom ash can be identified by methods XRF and ICP-OES whereas with NAA method cannot be identified. This matter was due to Sc element in the spectrum has a wide peak so that Sc covers up the peak of Zn, where both elements of Zn and Sc having the characteristic gamma energy which is close enough namely Zn element was 1112 keV and Sc element was 1120.55 keV [21]. Allegedly, if the levels of the elements Sc quite large compared to Zn in samples of bottom ash
as research Murniasih with volcanic ash [21], the spectrum has a peak width Sc so as to cover the peak of Zn. At the time of the determination of net area of Zn element is unreadable net value of the area so that Zn in bottom ash with NAA method can only be identified qualitatively and cannot be determined quantitatively.
Enrichment Ratio (ER)
Enrichment Ratio (ER) value was calculated as the ratio of the concentration of elements in the ash to the element concentration in the coal. The value of ER was calculated to determine the enrichment factor in the coal combustion waste associated with the used coal. Fig. 4 shows that ER for the elements in the bottom ash and fly ash were compared to the elements in coal. The elements tend to condense on fly ash as the result of decreasing the temperature resulted in the element enrichment in it. Fly ash was a finer fraction compared to that of the bottom ash which causes the larger surface area for the condensation process. The factors of ER from major, minor and trace elements have a high affinity for the smaller particles that ER of fly ash would be larger than the ER of bottom ash. Organic elements bonded are partly could evaporate and condense on the fine particles of fly ash which leads to higher concentrations in fly ash compared to the bottom ash [22].
The elements were analyzed using three methods showed that Al, Ti, Ba, Sr, Zn, and Co were found to be enriched in the fly ash compared with bottom ash except for the element La analyzed by NAA method further enriched in the bottom ash. The elements such as Fe, Cr, and Cd were analyzed using three methods were found to be enriched in the bottom ash. Among the elements analyzed, the maximum element enrichment observed in Co elements in fly ash and bottom ash.
Bhangare [23] stated that ER value below 1 indicates that the element was emitted together with off-gas because its volatile properties. Fig. 4 showed that as the whole ER value in the elements identified at the bottom ash and fly ash having the value >1. This matter identified that the properties of identified elements in general were non-volatile.
the analysis of elements in the sample, because the result is already qualified, and if compared to NAA method, moreover ICP-EOS method uses cheaper tool and its maintenance, simpler in operating, needs fewer workers, and does not produce radioactive waste.
CONCLUSION
Based on the data from the research and discussion, it could be concluded as follows: The analysis of multi elements simultaneously with NAA, ICP-OES and XRF methods showed that all of these three methods could generally be used for determining the concentration of an element of major, minor and trace elements in samples of coal, fly ash and bottom ash. Data of elemental analysis in the three samples, with three methods have an adjacent concentration value, which was shown by the value of R2closes to 1. ICP OES method was most satisfactory in this study. The method of NAA is the most expensive method, because it requires a nuclear reactor and a lot of human resources that have specialized expertise. In addition, because of its accuracy and reliability, NAA is generally recognized as the "referee method" of choice when new procedures that are being developed or when other methods yield results that do not agree in XRF or ICP-OES. The data showed that the overall value of ER in the elements identified in bottom ash and fly ash has a value of greater than 1 (one). It indicates that the elements identified are generally non-volatile.
ACKNOWLEDGEMENT
The author indebted to PSTA-BATAN who has allocated research funding of DIPA 2015. Sincerely thanks are also addressed to all the laboratory staffs of Nuclear Analysis Technique Division, for all your help so that this research could be completed.
REFERENCES
[1] Malik, M., Soni, N.K., Kanagasabapathy, K.V., Prasad, M.V.R., and Satpathy, K.K., 2016, Characterisation of fly ash from coal-fired thermal power plants using energy dispersive X-ray fluorescence spectrometry, Sci. Rev. Chem. Commun., 6 (4), 91–101.
[2] Smolka-Danielowska, D., 2006, Heavy metals in fly ash from a coal-fired power station in Poland,Pol. J. Environ. Stud., 15 (6), 943–946.
[3] Zhong, H., Zhao, Y., Muntean, M., Zhang, L., and Zhang, J., 2016, A high-resolution regional emission inventory of atmospheric mercury and its comparison with multi-scale inventories: A case
study of Jiangsu, China, Atmos. Chem. Phys., 16, 15119–15134.
[4] Guttikunda, S.K., and Jawahar, P., 2014, Atmospheric emissions and pollution from the coal-fired thermal power plants in India, Atmos. Environ., 92, 449–460.
[5] Mujuru, M., McCrindle, R.I., Botha, B.M., and Ndibewu, P.P., 2009, Multi-element determinations of N,N-dimethylformamide (DMF) coal slurries using ICP-OES,Fuel, 88 (4), 719–724.
[6] Tiwari, M., Sahu, S.K., Bhangare, R.C., Ajmal, P.Y., and Pandit, G.G., 2014, Elemental characterization of coal, fly ash, and bottom ash using an energy dispersive X-ray fluorescence technique,J. Appl. Radiat. Isot., 90, 53–57.
[7] Patra, K.C., Tapash, R., Rautray, T.R., Tripathy, B.B., and Nayak, P., 2012, Elemental analysis of coal and coal ash by PIXE, J. Appl. Radiat. Isot., 70 (4), 612–616.
[8] Lim, J.M., Jeong, J.H., and Lee, J.H., Instrumental neutron activation analysis of coal and its combustion residues from a power plant, 2013,J. Radioanal. Nucl. Chem., 298 (1), 201–208.
[9] Tuning, S.S., and Samin, 2012, Test of Homogeneity and Stability of SRM Sodium Zirconate Candidate with XRF Method, Proceedings of the Scientific Meeting and Presentation on Basic Research in Nuclear of the Science and Technology, Center for Accelerator Technology and Process Materials - BATAN Yogyakarta, 176–183.
[10] Musawwa, M.M., Taftazani, A., and Riyanto, 2013, Metal Distribution Fe, Ca, Ti, Ba, Sr, Zr and in Coal and Combustion Residues of Cilacap Coal Fired Plant using XRF, Proceedings of the National Seminar on Nuclear Analysis Techniques, Yogyakarta, 104–112.
[11] Anonymous, Standard test method for determination of major and minor elements in coal, coke, and solid residues from combustion of coal and coke by inductively coupled plasma—atomic emission spectrometry, ASTM D6349-13.
[12] Anonymous, Test methods for determination of trace elements in coal, coke, & combustion residues from coal utilization processes by inductively coupled plasma atomic emission, inductively coupled plasma mass, & graphite furnace atomic absorption spectrometry, ASTM D6357-11.
[14] Sutcu, E.C., and Karayigit, A.I., 2015, Mineral matter, major and trace element content of the Afşin–Elbistan coals, Kahramanmaraş, Turkey, Int. J. Coal Geol., 144-145, 111–129.
[15] Ketris, M.P., and Yudovich, Y.E., 2009, Estimations of Clarkes for Carbonaceous biolithes: World averages for trace element contents in black shales and coals,Int. J. Coal Geol., 78 (2), 135–148. [16] Wang, J., Yamada, O., Nakazato, T., Zhang, Z.G.,
Suzuki, Y., and Sakanishi, K., 2008, Statistical analysis of the concentrations of trace elements in a wide diversity of coals and its implications for understanding elemental modes of occurrence, Fuel, 87 (10-11), 2211–2222.
[17] Meravi, N., and Prajapati, S.K., 2014, Effects of heavy metals/metalloids present in fly ash from coal fired thermal power plant on photosynthetic parameters of Mangifera indica, Environ. Skep. Crit., 3 (4), 88–92.
[18] Ghodke, S., Kumar, R., Singh, N., and Khandelwal, H., 2012, Estimation of greenhouse gas emission from Indian coal based thermal power plant, IOSR J. Eng., 2 (4), 591–597.
[19] Kim, H.K., and Lee, H.K., 2015, Coal bottom ash in field of civil engineering: A review of advanced
applications and environmental considerations, KSCE J. Civ. Eng., 19 (6) 1802–1818.
[20] Damastuti, E., Sulaeman, A., and Santoso, M., 2014, Development of environmental reference material candidate of coal fly ash for air quality monitoring implementation: I. Homogeneity, stability and characterization, JASES, 9 (1), 17–26.
[21] Murniasih, S., and Taftazani. A., 2017, Comparison of the results of two laboratory analysis using different methods, Comparison of two laboratory analysis results using different methods,Ganendra Nucl. Sci. Technol. J., 20 (1), 23–30.
[22] Dai, S., Zhao, L., Peng, S., Chou, C.L., Wang, X., Zhang, Y., Li, D., and Sun, Y., 2010, Abundances and distribution of minerals and elements in high-alumina coal fly ash from the Jungar Power Plant, Inner Mongolia, China, Int. J. Coal. Geol., 81, 320–332.