HOW DOES CONGESTION MATTER FOR JAKARTA’S CITIZENS?
Sonny Harry Budiutomo Harmadi
Faculty of Economics and Business
Universitas Indonesia
(sonny_harmadi@yahoo.com)
Muhammad Halley Yudhistira
Faculty of Economics and Business
Universitas Indonesia
(mhyudhistira@gmail.com)
Decky Priambodo Koesrindartono
Faculty of Economics and Business
Universitas Indonesia
(decky.priambodo@gmail.com)
ABSTRACT
Jakarta, as the biggest city in Indonesia, faces many problems, one of which is congestion, that produces a high cost economy. It is predicted that if the government does not take immediate action to solve this problem, there will be a potential loss of IDR65 trillion by 2020 (Bappenas, 2007). This consists of IDR28.1 trillion in operational costs and IDR36.9 trillion in opportunity costs from time lost. This study is aimed at estimating how much Jakarta citizens’ are willing to pay to overcome the congestion problem. By using the stated preference method, the estimation result shows that the annual cost of congestion in Jakarta is estimated at IDR50.2 trillion a year. Furthermore, this result can be used as a baseline for a cost-benefit analysis by the government to generate a better public transportation policy in Jakarta.
Keywords:willingness to pay, congestion, stated preference method, conditional logit
INTRODUCTION
Congestion is a common phenomenon in every big city in the world, including in Jakarta. The increasing flow of vehicles into and out of Jakarta causes the roads in Jakarta to become more congested. This is not surprising given the fact that Jakarta is the economic center for the western Java area. In fact, one can also say that all of Indonesia’s economic activity is centered on Jakarta.
Although congestion has become inevitable, the condition of Jakarta’s congestion has reached worrying levels. Congestion is a form of
nega-tive externalities that could lead to economic inefficiency. The time taken to travel from one place to another becomes longer which implies greater opportunity costs. As a result, the cost of making one trip would also increase. These con-ditions are one of the problems slowing the eco-nomic growth and development of Jakarta, which also affects the development of the area around Jakarta.
have reached about IDR1 trillion per year. Moreover, it is predicted that if the congestion problem cannot be immediately resolved, then the potential losses will reach IDR65 trillion by the year 2020 (Bappenas, 2007). This predicted loss was calculated based on two parameters only, i.e. losses due to vehicle operating costs, amounting to IDR28.1 trillion and the time loss which is estimated to be worth around IDR36.9 trillion. These calculations do not include the costs of environmental deterioration (i.e. the costs from various kinds of pollution such as air pollution and noise pollution), failed transac-tions, declining productivity and competitiveness as compared to other major cities in the South-east Asian region (Bappenas, 2007).
Certainly, congestion in Jakarta has funda-mental problems that must be quickly resolved, one of which is the disproportional transporta-tion structure and systems. The numbers of vehi-cles on Jakarta’s roads grows faster than the existing roads. As an illustration, the transporta-tion modes in Jakarta and its surrounding areas were dominated by private vehicles (approxi-mately 53.4 percent) in 2002. Of this proportion, 40.3 percent consist of private passenger cars, while the rest are motorcycles. Compared to 1998, the number of private passenger cars has risen by 40 percent, from 1 million to 1.4 million units, while the number of motorcycles has increased by 60 percent, from 1.5 million to 2.4 million units (Asri & Hidayat, 2005).
It is well-known in transportation literature that adding a new link connecting two routes running between a common origin and a com-mon destination may not reduce congestion in the network, but instead increase the travel times for each network user. This phenomenon is called the Braess’ paradox, named after Dietrich Braess, an operations researcher who first pub-lished a paper explaining this finding.
In the literature, the Braess’ paradox is no longer a paradox because the cause of the para-dox has already been identified. Therefore, according to Yosef Sheffi, it and similar traffic flow phenomena should be called ‘pseudo-para-doxes’ (Pas and Principio, 1997). Zverovich and Avineri (2015) described discussions on the
development of the paradox. In their work, they explained that Anna Nagurney had proved that the paradox disappears under a higher demand, as well as how to avoid it by adding resources to a network in an efficient manner.
The situation which occurred in 2002 was most likely different when compared with the current conditions, especially for the number of motorcycles. The growth rate of motorcycles has increased due to the increasing economic stabil-ity present since 2001. The worsening conges-tion condiconges-tions also contribute to encourage people, especially the middle class citizens, to use motorcycles as an alternative mode of trans-portation.
The growth rates of private vehicles operat-ing on the roads of Jakarta were not accompa-nied by a growth in the available roads, either in their number or their width. Currently, the growth rate of road construction within Jakarta is only reaching less than 2 percent per year. The same is true for public transportation facilities, which in their quantity and quality are still below the standard required. If this situation continues, then it is predicted that Jakarta will experience total congestion by the year 2020.
Currently, the local government of DKI
(Daerah Khusus Ibukota or the capitol special
region) Jakarta is reviewing various alternatives to solve congestion problems in the long run. One of these is to increase and build mass trans-portation systems, such as the busway, which is now in the process of adding new corridors, or a monorail and subway system. The only problem with this solution is the government faces huge costs to fund these solutions, while their obtained benefits cannot be properly estimated. Therefore, the benefit measurement of various transportation policies becomes very important and of fundamental value.
Public infrastructure will be realized if the bene-fits obtained are greater than the incurred costs, and vice versa.
So far, all the studies ever conducted in Indonesia to measure the benefits were based on the calculation of the direct costs of congestion. In fact, the measurement of these benefits can also be viewed from the perspective of how much the society is willing to avoid congestion, which can be monetized by an amount of money. This calculation is more appropriate since this technique incorporates all the possible costs resulting from congestion problems. Therefore, the main objective of this study is to estimate the willingness to pay, by the people in Jakarta, to avoid their congestion problems. Congestion imposes greater travel costs for road users, thus they would have their own preference for avoiding congestion. These preferences are reflected through the amount they are willing to pay to avoid congestion.
LITERATURE REVIEW
Congestion is one of the urban problems that always produce interesting discussions. Conges-tion is an example of the negative externalities resulting from traffic flow passing along roads. Externalities can be formed as an increase in the travel time, noise pollution, air pollution, exces-sive fuel consumption, and car accidents (Button, 1995).
Of all the externalities arising from conges-tion, the problem of travel time has been the most discussed topic in research about urban congestion. Each road user, particularly the vehicle users or drivers, will compete with other vehicle users up to a certain degree. In other words, roads will have rivalry characteristics starting from a certain stage. Therefore, any additional vehicles passing along the road must
cause longer travel times to be faced by the other vehicle users. Hence, this would cause external-ities in the form of greater commuting costs for each vehicle user, along with larger opportunity costs (Sullivan, 2006).
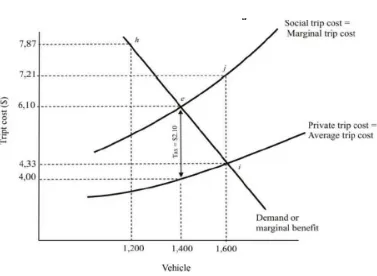
Externality in the form of greater commuting costs has caused the equilibrium not to reflect the optimum number of vehicles on a road. The nature of negative externality, as uncalculated costs, will eventually cause the number of vehi-cles on a road to exceed its optimum level. The result is the emergence of excessive traffic, or the so-called congestion. The internalization of this external cost can be performed through imposing the instrument of a congestion tax. This taxation shifts the marginal private cost faced by each driver to be equal to the marginal social cost to the economy, so the equilibrium will finally be at an optimum point. Within the larger framework, the existence of marginal congestion costs should be included in the valuation scheme for the road pricing (Anderson & Bonsor, 1974) as shown in Figure 1.
Source: Sullivan (2006)
Figure 1. Externalities and Congestion Tax
In practice, congestion taxes have various forms, such as toll road taxes, fuel taxes and parking taxes (Sullivan, 2006). Other forms of taxation include taxes on tires and other spare parts, as well as direct road taxes that are elec-tronically applied via smart cards, optical sys-tems, infrared scanners etc. (Johansson and Mattsson, 1995; Johansson-Stenman, 2005). Those forms of taxation could be implemented as long as they satisfy the benefit and equity principles (Stiglitz, 2000).
The optimal tax can be determined through the public road and vehicle users’ preferences about the existing congestion. It is necessary to determine how much the citizens are willing to pay to avoid congestion since the main objective of a congestion tax is to internalize the costs of congestion so that the existing congestion can be reduced. Congestion is also a loss to the econ-omy, so what needs to be determined here is the willingness of people to pay to overcome this loss (Pearce and Turner, 1990). In this case, public road users must determine how much cost they are willing to incur in averting congestion based on the current traffics’ congested condi-tion.
One example of a study concerned with the willingness to pay for congestion is the study conducted by Tretvik (1995). In his study, Tret-vik estimated the magnitude of the willingness to pay for time savings by the users of the Trond-heim toll road. The simulations were carried out by using panel data and by dividing the toll road users into three groups based on their travel pur-poses, i.e. commuting, business, and others. According to the simulation results, it was found that the value of the time saved by each group was different for each group. The group on busi-ness trips put the highest value on time saving, followed by the group of others and the com-muting group. Furthermore, the results of this study showed that the willingness to pay for the time saving by each Trondheim toll road user group were 73 NOK per hour for the commuting group, 120 NOK per hour for others group, and 138 NOK per hour for the business trip group.
several related studies that also use this method. Patunru et al. (2007) used SPM to estimate the benefits obtained from the cleaning up of pollut-ant substances in Waukegan Harbor, Illinois. By developing the determined attributes, it was con-cluded that the willingness to pay by the home-owners for the overall clean up would cost a minimum of US$582 million.
The method implemented by Tretvik can be classified as a contingent valuation method which is a common method to quantify, or, on some other occassions, to monetize, peoples’ preferences. In the early 1990s, the Contingent Valuation (CV) method was critized as dubious, at best, or even hopeless. Hausman (2012) found three enduring problems: 1) Hypothetical response bias leading the contingent valuation to overstate the value; 2) large differences between the willingness to pay and the willingness to accept; and 3) the embedding problem which encompasses scope problems. The last issue reflects that the answers by the respondents to the survey were implausible and inconsistent. The problems of the CV method have been dis-cussed for at least three decades.
Hypothetical bias means that the respondents have no market experience; in other words, their actions differ from their statements. In terms of willingness to pay, the tendency of bias is in an upward direction, meaning that the result meas-urement tends to be overstated. CV questions consist of two main ideas: How much the respondent would pay to avoid a negative out-come (or to achieve a positive outout-come) and how much the respondent would need to accept the negative outcome (or not to receive a posi-tive outcome). The first is commonly known as the willingness to pay approach and the later as the willingness to accept approach. Economic theory suggests that these two approaches should give, principally the same answer, but large and persistent disparities commonly arise in answers to CV surveys. The most fundamental challenge to the CV method, according to Hausman (2012) comes from concerns that the answers given by the respondent are invented, in response to the questions.
The CV method is not perfect, but the alter-native is to place a zero value on goods that the public cares about. A considerable body of evi-dence now supports the view that the CV method, if done appropriately, can provide a reliable basis for gauging what the public is willing to trade off to obtain well-defined public goods (Carson, 2012). In addition, despite the criticism, the last 20 years of research have shown that some carefully constructed number bases are now more likely to be useful than no number, in most instances, for both cost-benefit analysis and damage assessment. It serves as a model for the evaluation of other policy-critical techniques (Kling, et al., 2012).
Similar to the study conducted by Patunru et al. above, Shrestha and Alavalapati (2004) tried to estimate the environmental benefits of the sil-vopasture practice in Lake Okeechobee, Florida. The attributes used in this study included the water quality, absorption of CO2, biodiversity, and the increase of the state’s utility tax. This study concluded that the average willingness to pay of households ranged from US$0.21 to 71.7 per year for a period of 5 years. This amount would eventually reach up to US$924.4 million for a moderate improvement if all the willing-ness to pay from all the existing households were summed up.
METHODOLOGY
The benefits of the government’s efforts to reduce the traffic congestion problems in Jakarta can be measured by the costs which people are willing to pay to avoid the congestion. The in-crease of social utility, as a result of the reduced congestion, should be compensated by the amount of money that must be spent. This framework can be specifically described using the Hicksian demand curve, which is often referred to as the compensated demand curve and the compensating variation.
users of Jakarta today. On the other hand, improvements in transportation can be measured by shortened travel times, higher safety levels, and better connectivity.
Traffic congestion has increased travel times, so the public’s desire to avoid congestion can also be defined as the public’s desire to shorten their travel times. In other words, the public’s desire to increase their time saving during a trip is an alternative definition of a desire to avoid congestion, such that utility increases along with the increasing time saving. This desired improvement is then compensated for by the extent to which people are willing to pay for that improvement, which also represents the com-pensating variation of the utility function.
In order to estimate the amount of welfare (utility) change that would occur if congestion problems in Jakarta were reduced, this study used a random utility model which included the error term in the consumer utility function. This model was then approximated by choice-modeling analysis and solved by using the econometric method of conditional logit. In addition, the estimation of the willingness to pay for averting congestion in Jakarta involved pri-mary data which were obtained by using ques-tionnaires. The questionnaire was arranged based on predetermined attributes and distrib-uted to the respondents, who are the users of Jakarta’s roads.
1. Sampling Procedures
In order to obtain accurate estimates and generalizations, probabilistic sampling is re-quired. This technique requires a random sam-pling from the population list so it can provide equal opportunities for each individual in the population to be selected as the sample (Sugiyono, 2002). In this study, the unit of analysis of the population is any and all the citi-zens, both in Jakarta and also outside Jakarta, who use the transportation facilities within Jakarta. The ideal technique to use is a stratified random sampling, given the population structure. Hence, this study needed a list of the entire population that used the transportation facilities in Jakarta.
Problems arose when it was finally realized that acquiring a list of the transportation facili-ties users was almost impossible because the related population database was not available. Consequently, the sampling process that was originally planned for use, the stratified random sampling method, could not be used. In fact, no type of probabilistic sampling approach could be used, therefore the method used in this study was a non-probabilistic sampling, i.e. a purposive sampling method.
The scope of this research is mostly located in business and office center areas in Jakarta. These areas are the targeted areas where road pricing is going to be applied. The main criterion in determining the selected areas depended on the characteristics of the area itself. These areas are characterized as congested areas, and also areas containing many working citizens having relatively high education levels. The selected areas included: National Monument (Monas), Sudirman−Thamrin Street, HR Rasuna Said Street, Gatot Subroto Street (i.e. the end of Sudirman Street and HR Rasuna Said Street), and Prof. Dr. Satrio Street (which is bounded by Sudirman Street and HR Rasuna Said Street). Based on the Study on the Integrated Transpor-tation Master Plan for Jabodetabek (Jakarta, Bogor, Depok, Tangerang and Bekasi) (SITRAMP, 2004), these areas have the best qualifications, based on the simulation results, for observing which area is producing the high-est percentage reduction in the number of vehi-cles due to the implementation of the ‘3 in 1’ policy.
2. Questionnaire Design
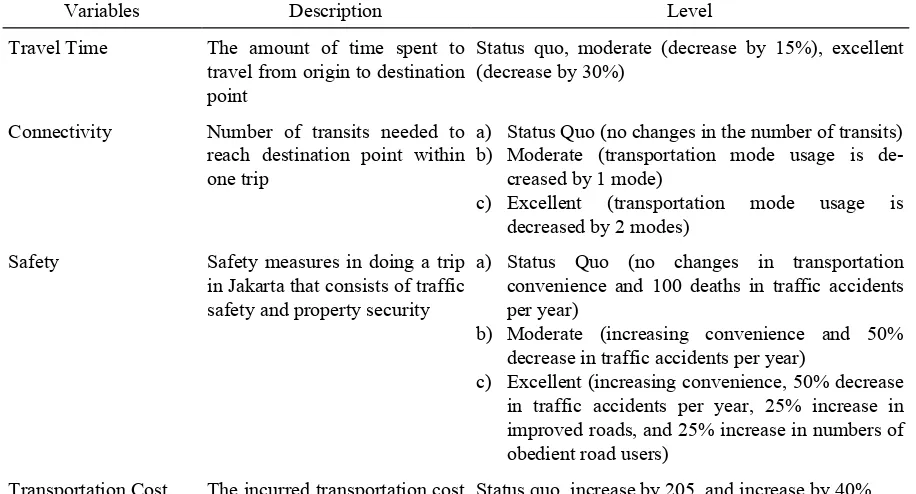
A conditional logit approach is used in this study to accommodate the discrete and binary dependent variables. The dependent variable is the conditional probability in choosing a travel scheme (i.e. the status quo or a new type of trip). The deterministic part of the utility is repre-sented by the various travel attributes, i.e. travel time, connectivity, safety, and transportation costs. The determination of these four attributes is carried out based on expert judgments of the factors that people consider in travelling to and from Jakarta. In general, the operational defini-tion of each attribute can be seen in Table 1 below.
The use of multiple attributes in an experiment design based on a choice-modeling approach requires a code transformation, such as that accomplished by Louviere (1988), which is also better known as an effect code. This effect code transforms the ordinal variables into a code system that can be used in econometric analysis. The code system is different from the ordinary
dummy variable approach. Its benchmark level is labeled with a value of −1. For example, the attribute of connectivity (K) has three levels, i.e. the status quo (KQ), moderate connectivity (KM), and excellent connectivity (TO) in which the status quo level becomes the benchmark level.
These levels, KQ, KM, and KE, are given a value of -1, 0, and 1 respectively. Thus, the value of the status quo level is a negative summation of the utilities obtained from the moderate and excellent levels. There are also other variables used in this study, i.e. travel time and safety. These variables do not need to use effect codes because both of these variables are ratio variables. Of the four attributes, only the connectivity attribute requires a transformation by using effect codes, given that this attribute is not continuous. On the other hand, other attributes are continuous so they do not require a similar transformation.
Table 1. Operational Definition of Each Attribute
Variables Description Level
Travel Time The amount of time spent to travel from origin to destination point
Status quo, moderate (decrease by 15%), excellent (decrease by 30%)
Connectivity Number of transits needed to reach destination point within one trip
a) Status Quo (no changes in the number of transits) b) Moderate (transportation mode usage is
de-creased by 1 mode)
c) Excellent (transportation mode usage is decreased by 2 modes)
Safety Safety measures in doing a trip in Jakarta that consists of traffic safety and property security
a) Status Quo (no changes in transportation convenience and 100 deaths in traffic accidents per year)
b) Moderate (increasing convenience and 50% decrease in traffic accidents per year)
c) Excellent (increasing convenience, 50% decrease in traffic accidents per year, 25% increase in improved roads, and 25% increase in numbers of obedient road users)
Transportation Cost The incurred transportation cost per month in term of money
Status quo, increase by 205, and increase by 40%
A survey method with primary data is the main point of the experiment’s design in order to get the magnitude of the welfare change. The core of the survey is to ask questions to the
attrib-utes that have been determined previously, i.e. travel time, connectivity, safety, and transporta-tion costs. There are three levels for each attrib-ute, thus there are 81 possible types of trip that can be selected by the respondents. Certainly, this amount of choice for the respondents is too much, and could lead to weariness and bias in the respondents. The option’s simplification was done through a trivial game approach, without reducing the existing generalities, so it can ac-quire 52 possible types of questions. The whole group of questions is then divided into five sets, in which the respondents were asked to answer 10 sets of options in each set.
3. Attribute-Based Stated Choice Method
A technique used in estimating the willing-ness to pay for averting congestion is a choice-based conjoint, which is part of the conjoint analysis. A choice-based conjoint, often referred to as choice-modeling analysis, is a method of-ten used in the calculation of economic valua-tions. In the context of this research, an individ-ual's decision in choosing a certain trip is based on certain conditions. Thus, this decision is obtained through analysis of the choice-model-ing and Random Utility Model (RUM) approach. The random utility model states that consumers obtain utility by choosing various alternative bundles of consumption. In fact, the observable information in determining consumers’ prefer-ences is the choices made by the consumers along with its various attributes.
The RUM decomposes utility into two com-ponents, namely the deterministic component and the probabilistic (random) component. The random component can be taken either from the characteristics of the consumer or the attributes of commodities which are defined by the ponents in econometrics (Hanemann, 1984). Formally, this utility function is written as fol-lows (Adamowictz et al., 1998):
i
component of the utility (systemic utility), and εi
denotes the random component of the utility.
The basic concept of the RUM model can be written into mathematical equations for utility maximization. In general, the RUM model is formally written as follows:
) of predetermined specific attributes (travel time, connectivity, and safety). z denotes a composite fraction of the consumption of other goods, y denotes income, and p denotes the price of each commodity. The last part of the utility function (e~) is a random factor that shows the stochastic
nature of such a utility function.
The RUM model in the four equations above reflects that consumers maximize their utility function in equation (2) subject to three con-straints, i.e. equation (3), (4), and (5). The first constraint shows the budget constraint, where income is assumed to be allocated for travel and the consumption of composite goods. The sec-ond constraint shows that either choice i or j cannot be simultaneously selected. Consumers cannot travel with the attributes of choice i as well as of choice j at the same time. The third constraint ensures positive values for each con-sumed commodity.
The RUM model can then be derived into the unconditional utility function. This function is formally defined as follows:
The equation above illustrates how a con-sumer would decide his consumption decisions based on the various available choices. A ra-tional consumer will maximize his utility of a number of N choices. Furthermore, if consumers have decided to choose to consume goods i, then this will have formed the conditional utility function, given the consumers have already selected travel ti:
Then, the probability of the choice of travel i being selected by consumers is given by the
Rational consumers always prefer to con-sume goods that can give them greater utility, so the difference between the utility levels of two goods is an important factor in determining the consumers’ choice. Consumers would prefer the choice of good i relative to good j if the differ-ence between the systemic utilities of good i and j (Vi – Vj) is greater than the errors difference.
The probabilistic approach used in estimating the random utility function within this study is the conditional logit model, which will be de-tailed in subsection (the Conditional Logit Model).
Moreover, this study assumes the consumers want to increase their utility by reducing con-gestion, so they are willing to pay an amount of money as compensation for this. Hence, the Hicksian model of a compensated demand func-tion must be used to explain the consumers demand. Hanemann (1984) suggested that the Marshallian demand function would be equal to the Hicksian demand function when the utility function is a monotonic transformation, which is written as follows:
The symbol γ denotes the marginal utility of income. By assuming that f(.) meets the
condi-tion of a weak complementary, equacondi-tion (9) can be transformed into a conditional utility function as shown in equation (10) below:
e
The conditional utility function in equation (10) above is then transformed into the uncondi-tional utility function, which is then used to estimate the welfare change. If this conditional utility function is applied to an unconditional utility function, then the new function can be written as the following equation:
1 in the welfare or the CV, one must determine the ‘before and after’ conditions. Suppose the this condition is formally written as follows:
) (Jehle & Reny, 2000). If the CV is implemented in the unconditional utility function as defined before, then we can obtain the following
equa-Thus, the amount of the unconditional CV is defined through an equation as follows:
⎥
By assuming the error value (εij) is following
condi-tional logit model, the value of the CV is deter-mined by the following equation:
}
The value of the CV obtained from equation (14) above is a value for one single individual in this study involves four predetermined attrib-utes, i.e. travel time, connectivity, safety, and transportation costs. The linear equation is for-mally written as follows:
+ KONMOD denote excellent and moderate con-nectivity, respectively (the status quo condition is used as the basis variable), SAFE denotes safety, and (Y–P) is a numeraire, where Y and P denote monthly income and transportation costs, respectively.
Equation (17) represents the estimation of the main effects of each attribute on the utility function. It estimates only the effects of every single attribute on the utility level without con-sidering the interaction effects between these attributes. In fact, it is most likely that there is interaction between the attributes and individual characteristics (e.g. income level). The resulted interaction effects reflect the preferences of individual characteristics on a certain attribute. For instance, it is strongly predicted that high-income individuals would have higher parameter values than low-income individuals. In other words, individuals whose higher income would have a larger decrease in its utility level due to congestion (i.e. longer travel times) as they bear a greater opportunity for the cost of congestion.
Hence, the equation (17) is modified to include the interaction effects between the attributes and individual characteristics. Equation (18) repre-sents the estimation of the interaction effects of the attributes and individual characteristics on the utility function: represent the middle-income group and high-income group of individuals, respectively. Thus, the parameter values (β) of each attribute will be different for each income group.
4. Conditional Logit Model
The usage of conditional logit was firstly introduced by McFadden (1974) through the Random Utility Model (RUM) analysis which has been discussed in the previous section. Con-ditional logit assumes that there is a latent vari-able Yi∗ which is used to show the degree of
indirect utility on the choice of i1. Therefore, Yi
can be defined as follows:
1
Conditional logit also assumes the error term
ij
error term εij It also assumes the error term is
independent and identically distributed (iid) with type I extreme value distribution, or better known as the Gumbel distribution. Thus, the probability of individual i selecting the choice j is given by the following equation:
ij ij
ij ij
Z Z
V V
ij
je e
je e
P '
'
α α
λ λ
Σ
=
Σ
= (21)
The Gumbel distribution is characterized by the scale parameter λ and also the location parameter δ. In practice, it also assumes that λ=1 and δ=0 (Ben-Akiva and Lerman (1985) in Seenprachawong, 2002).
The application of the conditional logit model in the RUM model requires the inclusion of an ASC (Alternative Specific Constant), a constant used to distinguish between alternative options. The ASC is required to accommodate all the attributes that cannot be fully captured by the explanatory variables. The ASC is constant for each of the estimations that have been esti-mated, reflecting the average effects of the fac-tors that influence consumer choices but these factors are not included in the model. Thus, in this study, the ASC value is equal to zero for the status quo (current travel condition) and to 1 for the hypothetical choice (new selected travel route). The estimated results would violate the assumption of a zero mean of error term if the alternative specific constant is not included in the estimation model (Train (1996) in Patunru, 2001).
The problem of heterogeneity is one of the problems that arise due to variations in the respondents preferences. This is clearly inevita-ble given the respondents have heterogeneous individual characteristics. Heterogeneity can be
either observed or not observed. Observed heterogeneity can be systemically calculated in the model through the interaction between the individual characteristics.
FINDINGS AND DISCUSSION
1. Traffic Congestion in Jakarta
SITRAMP (2004) had identified some of the causes and sources of traffic congestion in Jakarta. Generally, there were four main causes of traffic congestion in Jakarta, and if these issues are not resolved soon, they will develop into more severe congestion problems.
a. Road Network Problems
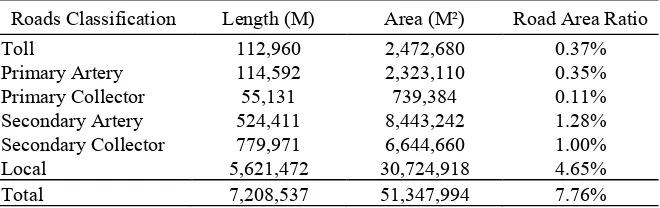
Moreover, the number and length of the roads in Jakarta is relatively small compared to the size of Jakarta. Table 2 shows that the ratio of the road to land area in Jakarta is at 7.76 per-cent, which is well under the ideal conditions for metropolitan cities (e.g. London and Tokyo), where it is supposed to be at 12−15 percent.
The problems of infrastructure are also char-acterized by the different roads’ capacities, causing bottleneck effects, the lack of traffic signs, signals or traffic control lights, mixed types of cargo and passenger transportation, and damaged roads that are not immediately repaired.
b. The abuse of road facilities and undisci-plined road users
The existence of the illegal use and abuse of road facilities, such as street vendors and illegal parking, can decrease roads’ capacity. Decreas-ing road capacity due to side friction can result in the reduced performance of these roads. It is characterized by the slowing of the flow of traf-fic, which thereby extends the travel time of the road users. The behavior of the roads’ users, such as pedestrians, passengers and drivers, either in private or public transportation, can also affect the road network’s performance as a whole. Violations of the traffic rules such as improperly crossing the road, passing through red lights, haphazardly stopping vehicles, and loading/offloading passengers at improper places are risky for the roads’ users, and likely to cause traffic congestion.
c. Insufficient growth of road infrastructure
Data from the local transportation agencies in Jakarta state that there was an expansion of the road system in Jakarta by 159,293.99 meters (equivalent to an increase of 2.09 percent) dur-ing the period from 2000-2003. This suggests that the expansion was less than 1percent per year (Jakarta Macro Transportation Pattern, 2007). The slow road construction, relative to the rapid increase in the demand for travel, is perhaps one answer why traffic congestion has become a daily problem in Jakarta. Road con-struction requires large amounts of land, which for cities such as Jakarta, is very difficult to get as the price of land is expensive and also there is resistance from the affected communities who have to be moved away. The availability of sub-stantial funds and the persuasive ability of the local government become very important. There-fore, it can be expected that the construction of new roads in urban areas such as Jakarta will require long periods of time for the process of the socialization, planning, and implementation phases.
In addition, the rules and regulations restricting the usage of land for the construction of new roads, such as the regulations regarding land usage and the green area requirements, can also hamper government efforts to increase the road network to offset the rapid growth in the travel demand in Jakarta.
d. High growth rate of private vehicles
Table 2. Road Length and Road Area Ratio in Jakarta
Roads Classification Length (M) Area (M²) Road Area Ratio Toll 112,960 2,472,680 0.37% Primary Artery 114,592 2,323,110 0.35% Primary Collector 55,131 739,384 0.11% Secondary Artery 524,411 8,443,242 1.28% Secondary Collector 779,971 6,644,660 1.00% Local 5,621,472 30,724,918 4.65% Total 7,208,537 51,347,994 7.76%
The growth rate in the number of vehicles far exceeds the growth rate of the road network in Jakarta, and is a major cause of the traffic con-gestion in Jakarta. In other words, the huge demand for private motor vehicles is not accom-panied by an adequate increase in the road net-work. This condition is shown by the table below which illustrates that during the period from 2005-2009, the growth in the number of motor vehicles in Jakarta averaged 9.7 percent per year. Although the growth rate had a decreasing trend during the 2005-2009 period, the average growth rate in the number of vehi-cles in Jakarta during that 2005-2009 period had increased compared to the average growth rate in vehicle numbers during period from 1999-2004, which was about 6.3 percent per year.
Despite the decreasing growth rate during 2005-2009, motorcycles remain ranked as the transportation mode with the highest growth rate among all the other transportation modes used by road users in Jakarta. Table 3 above shows that the growth rate in motorcycles during 2005-2009 was always above 10 percent for each year. It also shows that there is a tendency for road users to prefer private motor vehicles (i.e. motorcycles and passenger cars) as their main transportation modes. If this trend is going to continue in the future, then the number of private
motor vehicles will continue to grow, and experience an enormous growth in the coming years. Traffic congestion will thus become increasingly severe and much more difficult to overcome.
On the other hand, the demand for travel in Jakarta has also been predicted to increase rap-idly in the near future. Based on the study results of SITRAMP (2004), the commuter trips from Bogor-Tangerang-Jakarta-Depok to the Jakarta area reached about 76,340 trips per day in 2002. This number was predicted to increase almost ten times, to reach around 740,089 trips per day by 2010. The combination of ten-fold growth in the demand for travel, and the strong preference for private motor vehicles (motorcycles and pas-senger cars) will eventually lead to an explosive number of private motor vehicles in the future. Thus, without making some effort to restrain the growth rate of private motor vehicles from now on, severe traffic congestion problems will occur within the near future. Traffic congestion will be seen almost evenly throughout all the road net-works and the public will experience total con-gestion since the existing road networks in Jakarta would not be able to accommodate all the vehicles.
2. Descriptive Results
Table 3. Number of Registered Motor Vehicles in Jakarta, 2005-2009
Year Motorcycles Passenger Cars Cargo Cars Buses Total Growth Rates
2009 7,518,098 2,116,282 550,924 309,385 10,494,689 8.78% 2008 6,765,723 2,034,943 538,731 308,528 9,647,925 10.54% 2007 5,974,173 1,916,469 518,991 318,332 8,727,965 9.54% 2006 5,310,068 1,835,653 504,727 317,050 7,967,498 10.20% 2005 4,647,435 1,766,801 499,581 316,502 7,230,319
Source: Ditlantas Polda Metro Jaya from data of Jakarta in Figure 2010
Year Motorcycles Growth Rates Passenger Cars Growth Rates
2009 7,518,098 11.12% 2,116,282 4.00% 2008 6,765,723 13.25% 2,034,943 6.18% 2007 5,974,173 12.51% 1,916,469 4.40% 2006 5,310,068 14.26% 1,835,653 3.90% 2005 4,647,435 1,766,801
Our survey was conducted over a period of five days, and collected 416 samples, with a validity rate of 100 percent. However, for some of the information collected, the validity rate did not reach 100 percent. For instance, the validity rate reached 99 percent for information on alter-native transportation modes, 97 percent for in-formation related to transportation considera-tions, and 98 percent for the information about the frequency that respondents were troubled by congestion, the information on the respondents’ opinion about congestion in Jakarta, and the in-formation on the respondents’ educational level.
The sampled respondents consisted of 58.8 percent male and 41.2 percent female, while their ages ranged from 17 to 70 years old, and with various minimum educational levels rang-ing from elementary school until doctoral de-grees. The number of respondents whose educa-tion level was only up to elementary level was only 1 respondent, while 48 percent of the respondents were undergraduates. There were 22 percent and 9 percent of the respondents who had completed high school and diploma levels respectively, whereas 15 percent and 2 percent of the total respondents were graduates and post-graduates.
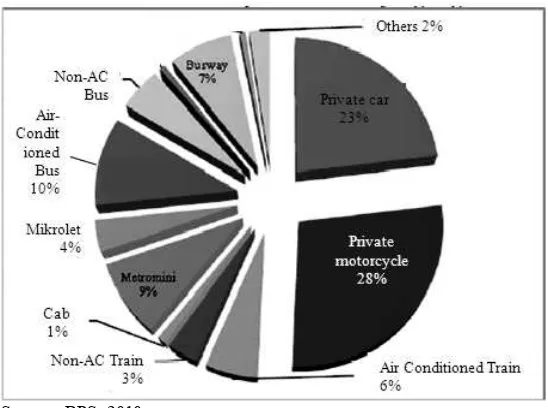
According to Figure 2 below, the main transportation modes used by road users in Jakarta are private motorcycles, with a propor-tion of 28 percent, and private passenger cars with 23 percent. This implies the road users mainly rely on private vehicles. Meanwhile, there is an alternative and available
transporta-tion mode but it is not selected as the primary transportation mode, namely the Metromini (public bus) system. Only 14.9 percent of the respondents chose the Metromini as an alterna-tive mode of transportation. According to the SITRAMP, if there is no improvement in public transportation services, such as bus (Metromini) services, then its share would decline because road users would switch their modes of trans-portation to private vehicles.
In addition, the main attributes that the respondents emphasized in selecting their trans-portation modes were the travel time, safety, and the transportation cost, as shown in Figure 3. The average time required for respondents to travel toward Jakarta is 70.9 minutes, despite the fact that it actually only requires 37.7 minutes if there is no traffic congestion. Of the 416 respon-dents, 222 (55 percent) chose the journey time as their primary consideration in selecting their transportation mode. Of these 222 respondents, 110 use private vehicles, i.e. motorcycles and private passenger cars. Most respondents chose private vehicles, especially motorcycles as their primary transportation mode, because motorcy-cles can shorten their travel time.
Source: based on authors’
calculation
Figure 3.
Import ant Attributes in Selecting Transportation Modes
Source:: BPS, 2010
Note: Mikrolets are small public passenger cars run by the private sector to provide transportation services based on different routes
Furthermore, most respondents also consid-ered transportation costs as an important factor in selecting their transportation modes. The amount put aside for their transportation costs varied across the respondents, ranging from IDR100,000 per month to IDR4 million per month. The respondents incur transportation costs of IDR654,506 per month, on average. As many as 38 percent of the private passenger car users are willing to pay an additional transporta-tion cost of less than IDR100,000 per month if the government can provide better alternative transportation modes. On average, the respon-dents who are private passenger car users are willing to pay another 17 percent in additional transportation costs in order to avoid traffic con-gestion in Jakarta by using the public transporta-tion systems provided by the government.
In addition, 80 percent of the respondents who are motorcycle users are willing to pay not more than IDR 100,000 in additional transporta-tion costs, but only if the government can pro-vide better alternative modes of transportation. This additional cost represents their compensa-tion for using better public transportacompensa-tion modes provided by the government which may help in reducing traffic congestion. In general, the respondents who were regular train and bus users are also willing to pay an additional trans-portation cost of less than IDR 100,000 per month to avert traffic congestion in Jakarta.
Figure 4 shows that the benefit from the main transportation modes over the alternative modes lies with the factors of connectivity and cost. The main transportation modes include pri-vate motorcycles and pripri-vate passenger cars, as previously shown in Figure 2. In the case of motorcycles (as the most frequently used trans-portation mode), the respondents do not need to switch transportation modes during the journey to their destination.
3. Regression Results
a. Main Effects
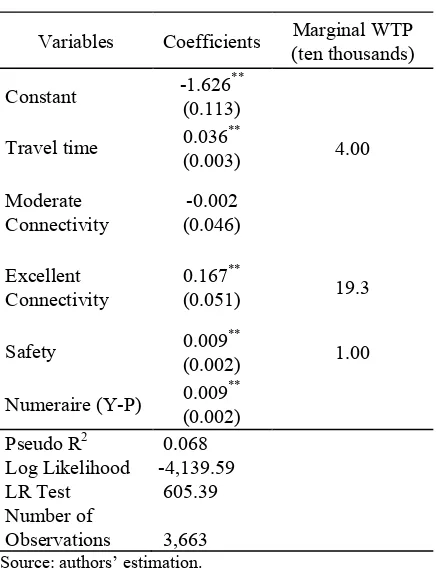
The estimation results for the main effects model as illustrated in the table below show that the value of the Marginal Willingness To Pay (MWTP) for travel time is about IDR 40,000 per
minute. This figure is obtained from the ratio of the time-savings coefficient to the Marginal Utility of Income (MUI), the numeraire attribute (Y−P). This ratio shows the amount of additional utility measured in terms of money.
Source: based on authors’ calculation
Figure 4. Comparison between Main Transportation Mode and Alternative Transportation
Mode
Table 4. Summary of Estimation Results with Main Effects
Variables Coefficients Marginal WTP (ten thousands)
Constant -1.626
**
(0.113)
Travel time 0.036
**
(0.003) 4.00
Moderate Connectivity
-0.002 (0.046)
Excellent Connectivity
0.167**
(0.051) 19.3
Safety 0.009
**
(0.002) 1.00
Numeraire (Y-P) 0.009
**
(0.002) Pseudo R2
Log Likelihood LR Test Number of Observations
0.068 -4,139.59 605.39
3,663
Source: authors’ estimation.
Note: Values in parantheses are standard deviations. *, **, and *** indicate statistical significance at the 10%, 5%, and 1% respectively.
meaning that in general, the respondents tend to choose the status quo condition rather than the offered alternative trips. There are two possible reasons behind this result. Firstly, the respon-dents are already satisfied with the current con-ditions so they refuse to choose the offered alternative options. Secondly, the predetermined attributes levels in the questionnaire are so high, especially for the attribute of transportation costs, that the respondents might tend to choose the status quo option. Besides, all the attributes except the attribute of moderate connectivity, show significant positive values in line with the hypothesis, which suggests that greater positive attribute values are preferred. In other words, the respondents prefer shorter travel times (i.e. greater time savings), excellent connectivity, and also lower transportation costs. The insignificant value for the attribute of moderate connectivity also shows that respondents prefer greater im-provements in connectivity, by reducing two transportation modes at once.
Moreover, the MWTP of IDR40,000 must be carefully interpreted. Such values cannot be di-rectly interpreted as the monetary value that Jakarta’s road users put on their travel times. Instead, this estimation model is a model that estimates preferences, thus the value of the MWTP is defined as the amount Jakarta’s road users are willing to pay to reduce their travel time per minute for one trip per month. In other words, for an individual with a current travel time of one hour, then the IDR40,000 per month is the monetary amount that he is willing to pay to reduce his travel time from one hour to 59 minutes for each trip. Hence, IDR40,000 repre-sents his MWTP to reduce his travel time. It as-sumes that the reason for an individual to make a trip to Jakarta is for work purposes, with an average of 25 working days each month. Hence, there are 50 trips per month per individual. Then, the value of the IDR40,000 equates to 50 minutes of time savings per month or equal to IDR800 per minute of time savings2.
2
This assumption is quiet reasonable considering the survey results show that more than 95 percent of respondents are going to Jakarta for work.
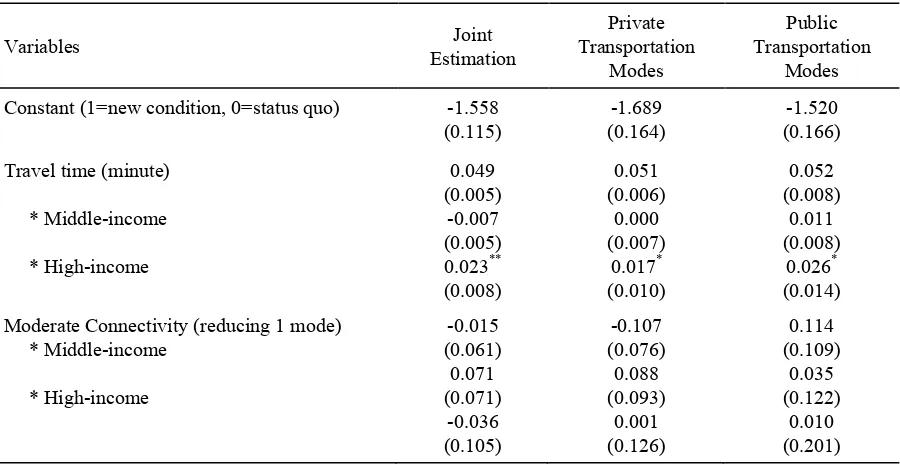
b. Interaction Effects
In order to accommodate the effect of in-come on the utility function, this study also involves the interaction of all its attributes along with the respondents, who are classified into three income groups (based on their income per month). These groups comprise the low-income group (whose income is less than IDR2.5 mil-lion), the middle-income group (whose income ranges from IDR2.5 to 8.5 million), and the high-income group (whose income is more than IDR8.5 million). The estimation result is shown in Table 4 below. The MWTP values for the attribute of travel time are specifically shown in Table 3.
The estimated result of the MWTP for the attribute of travel time is consistent with the pre-viously proposed hypothesis. From Table 3, it is seen that the income groups with the lowest MWTP for each minute are the low-income group, the middle-income, and then the high-income groups, consecutively. As an illustration of the joint estimation results, the MWTP per minute of the low-income group is IDR18,200. Also, the MWTP per minute for the middle-income group and high-middle-income group are IDR33,800 and IDR49,500 respectively. By us-ing the same analogy as in the main effects, the benefits of time saving per minute for the low-income, middle-income, and high-income groups are IDR364, IDR676, and IDR990 respectively.
Another attribute, besides the travel time, that could also be the focus of discussion is the attribute of connectivity. Estimation results show that in general, people who work in Jakarta do not just demand a moderate change in connec-tivity, but they tend to demand excellent con-nectivity. In this case, there is no difference in the MWTP between the income groups, in which the MWTP is about IDR155,200 per month.
vehi-cles. It can be concluded that the low quality of connectivity encourages road users to use private transportation modes rather than public trans-portation. For public transportation users, the existing connectivity has been deemed sufficient so they are not likely to demand changes for the connectivity’s improvement. This finding can be used as one of the considerations for Jakarta’s mass transportation policy, that connectivity can encourage people to shift from private transpor-tation to public transportranspor-tation.
Safety conditions for transportation also get different responses from the different income groups. The high-income group remains as the group with the highest MWTP, IDR14,300. It was also interesting to find that the value of the MWTP for the middle-income group was lower than that of the low-income group. The value of the MWTP for the middle-income group is esti-mated at around IDR3,570, which is a long way below the value for the low-income group (IDR7,860).
Table 5. Marginal Willingness to Pay for Travel Time (In ten thousands IDR)
Income Groups
Joint Estimation
Private Transportation Modes
Public Transportation Modes
Low-income Middle-income High-income
1.821 3.383 4.945
2.621 3.942 5.264
1.645 3.239 4.832
Source: authors’ estimation
Table 6. Summary of Estimation Results with Interaction Effects
Variables Joint
Estimation
Private Transportation
Modes
Public Transportation
Modes
Constant (1=new condition, 0=status quo) -1.558 (0.115)
-1.689 (0.164)
-1.520 (0.166)
Travel time (minute)
* Middle-income
* High-income
0.049 (0.005)
-0.007 (0.005) 0.023** (0.008)
0.051 (0.006)
0.000 (0.007)
0.017* (0.010)
0.052 (0.008)
0.011 (0.008)
0.026* (0.014)
Moderate Connectivity (reducing 1 mode) * Middle-income
* High-income
-0.015 (0.061) 0.071 (0.071)
-0.036 (0.105)
-0.107 (0.076) 0.088 (0.093)
0.001 (0.126)
0.114 (0.109)
0.035 (0.122)
Excellent Connectivity (reducing 2 modes) * Middle-income
* High-income
0.224*** (0.067) -0.121 (0.067) 0.153 (0.115)
0.397*** (0.085) -0.198** (0.099) 0.135 (0.136)
-0.013 (0.122)
0.027 (0.136)
0.009 (0.224)
Safety (deaths)
* Middle-income
* High-income
0.012*** (0.002) -0.007*** (0.002) 0.008** (0.003)
0.012*** (0.003) -0.006 (0.003) 0.003 (0.004)
0.015*** (0.004) -0.010 (0.004) 0.016*** (0.006)
(Y-P) (IDR ten thousands) 0.014*** (0.002)
0.013*** (0.003)
0.016*** (0.005)
Pseudo R2 0.077 0.08 0.071
Log likelihood -4,102.35 -2,096.44 -2,006.95
LR test 679.81*** 364.66*** 305.1***
Number of Observation 3,663 1,880 1,783
Source: authors’ estimation
Note: Values in parentheses are standard deviations. *, **, and *** indicate statistical significance at the 10%, 5%, and 1% respectively.
CONCLUSION
According to the SITRAMP (2004), there are at least four factors causing the worsening traffic congestion problem in Jakarta. These factors include (1) the problem of the road net-work; (2) the abuse of the road facilities and the indisciplined nature of many road users; (3) the relatively low growth rate of road infrastructure; and (4) the high growth rate of private vehicles. Of these four factors, the high growth rate of private vehicles is considered as the main factor causing the severe traffic congestion in Jakarta.
Survey results show that most road users still rely on private vehicles as their main transporta-tion mode. The estimatransporta-tion results also justify that road users are willing to pay compensation, in terms of money, for averting traffic conges-tion. It is estimated that the MWTP per minute of the low-income group is IDR18,200. Also, the MWTP per minute for the middle-income and high-income groups are IDR33,800 and IDR49,500 respectively. Besides, the low quality of connectivity due to the lack of public infra-structure also becomes a strong incentive for road users to prefer private transportation modes rather than public transportation. Therefore,
im-provements in the connectivity of transportation modes become more important in encouraging people to shift to public transportation.
In summary, the aggregation process of the estimated results in Section 4 will result in bene-fits for traffic congestion management. There-fore, it needs a set of underlying assumptions. By relying on the results obtained from SITRAMP, it was found that there were about 11,678 million trips per day by road users, from both Jakarta and the surrounding commuter areas such as Bogor-Depok-Tangerang-Bekasi3.
By taking the estimation results which were obtained earlier, there is around IDR 9.34 billion in benefits derived from time savings for each minute from all the trips in Jakarta. Furthermore, by assuming that the desired time savings is 15 minutes, then the benefits that can be obtained are estimated to be around IDR51.3 trillion. In addition, by also assuming that the number of trips increases by ten percent per year, the num-ber of trips in 2008 would have reached 20.87
3
million trips per day, nearly twice as much as in 2002.
A further assumption that is also important to note is the income structure. Income structure adjustments are needed in the estimation results to take account of the income structure of Jakartans, to determine the value of the total benefits. Based on data from Susenas 2006, the average income of Jakartans is IDR2.44 million per month, with average values in the lowest and highest quartiles of IDR917,400 and IDR5.4 million, respectively. According to that interval, the amount of total benefits is equal to an aver-age of IDR43.2 trillion with interval of IDR16.2 to 95.9 trillion4.
REFERENCES
Adamowicz, W., J. Louviere, and J. Swait, 1998. Introduction to Attribute-Based Stated Choice Methods. Canada: Advanis.
Asri, D. U. and B. Hidayat, 2005. “Current Transportation Issues in Jakarta and Its Im-pacts on Environment”. Proceedings of the Eastern Asia Society for Transportation Studies, 5, 1792-1798.
Best, J. W. and J. V. Khan, 1993. Research in Education. 7th ed. Needham Heights: Simon & Schuster, Inc.
Carson, R. T., 2012. “Contingent Valuation: A Practical Alternative When Prices Aren't Available”. The Journal of Economic Per-spectives, 26 (4), 27-42.
Christiadi, B. C., 2007. “Conditional Logit, IIA, and Alternatives for Estimating of Interstate Migration”. Presented at The 46th Annual Meeting of the Southern Regional Science Association, Charleston.
Dinas Perhubungan, Pemda DKI Jakarta. 2007. Pola Transportasi Makro Jakarta.
Evans, A. W., 1992. “Road Congestion: The Diagramatic Analysis”, in: Button, K. (Ed.), Recent Developments in Transport Eco-nomics. Northampton: Elgar Reference Collection.
4
The minimum and maximum values of each interval are obtained through assuming that the Jakartans’ willingness to pay is categorized in the low-income and high-income groups only.
Hanemann, W. M., 1984. “Discrete/Continous Models of Consumer Demand”. Economet-rica, 52 (3), 541-561.
Harmadi, S. H. B., 2006. “Megapolitan in Eco-nomic Perspective”. Paper presented at The Seminar of Megapolitan in Multiperspective Discussion, FISIP University of Indonesia.
Hausman, J., 2012. “Contingent Valuation: from Dubious to Hopeless.” The Journal of Eco-nomic Perspectives, 43-56.
Jehle, G. A. and P. J. Reny, 2001. Advanced Mi-croeconomic Theory. 2nd Ed. United States: The Addison-Wesley.
Johansson, B. and L-G Mattsson, 1995. “Princi-ples of Road Pricing”, in: Johansson, B. and L-G Mattson, eds., Road Pricing: Theory, Empirical Assessment and Policy. Dordrecht: Kluwer Academic Publishers.
Kling, C. L., Phaneuf, D. J., & Zhao, J., 2012. “From Exxon to BP: Has Some Number become Better than No Number?” The Journal of Economic Perspectives, 3-26.
Maddala, 1983. Limited-Dependent and Quali-tative Variables in Econometrics. Cam-bridge: Cambridge University Press.
Nam, K. P. and T. V. H. Son, 2005. “Household Demand for Improved Water Services in Ho Chi Minh City: A Comparison of Contin-gent Valuation and Choice Modelling Esti-mates”. EEPSEA Research Report.
O’Sullivan, A., 2006. Urban Economics. 6th ed. New York: McGraw- Hill Irwin.
Pas, E. I., & Principio, S. L., 1997. “Braess' Paradox: Some New Insights”. Transporta-tion Research Part B: Methodological, 31(3), 265-276.
Patunru, A. A., 2003. “Three Essays on Choice-Based Estimations of the Economic Benefits of Contamined Site Cleanups”. Unpublished Dissertation. University of Illinois at Urbana Champaign.
Pearce, D. W. and R. K. Turner, 1990. Econom-ics of Natural Resources and the Environ-ment. Hertfordshire: Harvester Wheatsheaf.
Seenprachawong, U., 2003. “An Economic Valuation of Coastal Ecosystems in Phang Nga Bay, Thailand”. EEPSEA Research Report.
Shrestha, R. K. and J. R.R. Alavalapati, 2004. “Analysis Valuing Environmental Benefits of .ilvopasture Practice: A Case Study of The Lake Okeechobee Watershed in Florida”. Ecological Economics, 49,
349--359. Available at:
www.elsevier.com/locate/ecolecon.
SITRAMP. (2004). The Study on Integrated Transportation Master Plan for Jabodetabek. National Development Planning Agency of Republic of Indonesia & Japan International Cooperation Agency.
Tretvik, T., 1995. “Willingness to Pay for Time Savings: The Torndheim Toll Road
Experi-ences”, in: Johansson, B. and L-G Mattson, eds., Road Pricing: Theory, Empirical As-sessment and Policy. Dordrecht: Kluwer Academic Publishers.
Stiglitz, J. E., 2000. Economics of the Public Sector. 3rd ed. New York: W.W. Norton & Company.
Stover, V. G., 1988. Transportation and Land Development.
Sugiyono, 2002. Metode Penelitian Bisnis. Bandung: CV. Alfabeta.
“Rugi Akibat Macet Capai 43 Trilyun”. Kom-pas, November 6th 2007. Available at: www.bappenas.go.id. Accessed on Decem-ber 2007.