The high-resolution global map of 21st-century forest cover change from the
University of Maryland (‘Hansen Map’) is hugely overestimating deforestation in
Indonesia
Franz-Fabian BellotA
, Technical Coordinator: Forest Carbon Monitoring (franz-fabian.bellot@giz.de); Mathias BertramA
FORCLIME Forests and Climate Change Programme, Deutsche Gesellschaft für Internationale
Zusammenarbeit (GIZ) GmbH, Manggala Wanabakti Building, Block VII, Jl. Jenderal Gatot Subroto, Jakarta 10270, Indonesia
B
Remote Sensing Solutions GmbH, Isarstraße 3, 82065 Baierbrunn bei München, Germany
The first-ever high-resolution map of global deforestation produced by the University of Maryland (UM) (Hansen et al. 2013)1 has attracted high attention among international policy makers, forest practitioners and scientists. Data on platforms like Global Forest Watch are based on the ‘Hansen Map’. In order to assess the reliability of UM data on district level, the Forests and Climate Change Programme (FORCLIME) jointly implemented by Deutsche Gesellschaft für Internationale Zusammenarbeit (GIZ) GmbH and the Indonesian Ministry of Forestry compared deforestation rates derived from Hansen and FORCLIME studies within three districts in Kalimantan (Kapuas Hulu, Berau, Malinau). Results show that due to the classification used by UM, non-forest land such as smallholder agriculture, shrubland or plantations is wrongly classified as forest area. Consequently the ‘Hansen Map’ is largely overestimating forest cover and deforestation rates at the local level. Hence, the dataset compiled by UM cannot be regarded as reliable tool for assessing deforestation in Indonesia. Research based on the ‘Hansen Map’ has to be checked cautiously as it might produce wrong results as well.
Conclusions drawn from the ‘Hansen Map’, especially the increasing rates of forest loss detected for Indonesia raised concerns about the country’s compliance with its ambitious greenhouse gas (GHG) emission reduction targets. The Global Forest Watch platform, the first tool to monitor global forests promoted by the World Resource Institute (WRI) and developed over several years with more than 40 partners is also based on the ‘Hansen Map’ and consequently the results must be questioned, at least for countries with tropical forest ecosystems similar to the ones of Indonesia.
The ‘Hansen Map’ is based on remote sensing
only and is using a global definition of ‘forest’.
Hansen quantifies global annual forest loss between the years 2000 and 2012 based on the evaluation of more than 650,000 Landsat satellite images at a spatial resolution of 30 meter. A forest cover benchmark map generated for the year 2000 forms the basis for the analysis. The benchmark map is based on remotely sensed pixel analysis without ground truthing to verify pixel values for individual countries. In addition to that, a unified definition of forest (vegetation above 5 m,) and forest loss (stand-replacement or complete removal of tree cover) is globally applied.
FORCLIME used a combination of remote
sensing and ground truthing methods.
The Forests and Climate Change Programme (FORCLIME) jointly implemented by Deutsche Gesellschaft für Internationale Zusammenarbeit (GIZ) GmbH and the Indonesian Ministry of Forestry has conducted land-cover analyses in the districts of Kapuas Hulu (West Kalimantan Province), Berau (East Kalimantan Province) Malinau (North Kalimantan Province) for the years 1990, 2000, 2005 and 2010.2 Object-based classifications of Landsat satellite images in combination with extensive ground truthing data provide the basis for the analysis. Identified image objects are assigned with predefined land-cover classes according to decision rules based on spectral,
1
Hansen, M. C., P. V. Potapov, R. Moore, M. Hancher, S. A. Turubanova, A. Tyukavina, D. Thau, S. V. Stehman, S. J. Goetz, T. R. Loveland, A. Kommareddy, A. Egorov, L. Chini, C. O. Justice, and J. R. G. Townshend. 2013. “High-Resolution Global Maps of 21st-Century Forest Cover Change.” Science 342 (15 November): 850–53. Data available online from: http://earthenginepartners.appspot.com/science-2013-global-forest.
2
spatial, shape, thematic, and topologic criteria. The Land Cover Classification System (LCCS) established by the Food and Agricultural Organization (FAO) is used to describe the earth’s surface. Natural forest loss is quantified from changes among forest land-cover classes.
Hansen overestimates forest cover in the
analyzed districts of Kalimantan, Indonesia.
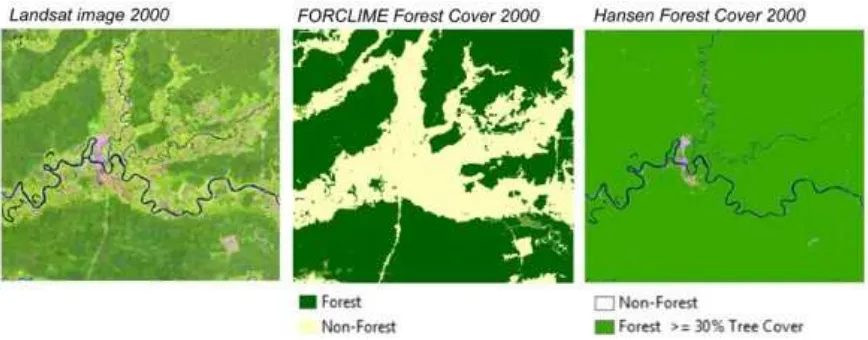
The comparison of Hansen’s forest benchmark map from the year 2000 with Landsat satellite imagery and FORCLIME derived forest cover maps from the same year reveals a high overestimation of forest cover within Hansen datasets (Figure 1). Non-forest areas such as shrubland, plantations and agricultural land can clearly be identified in the Landsat image as well as the FORCLIME natural forest cover map. However, these forest cover and deforestation patterns cannot be recognized in the benchmark map compiled by Hansen. Furthermore, a high overestimation of forest cover remains prevalent within Hansen’s benchmark map, even if forest cover thresholds for the pixel values are set to 50% or 75%.
Figure 1: Comparison of Landsat satellite image (band combination 543), FORCLIME forest map and Hansen forest benchmark map for
greater Putussibau area, Kapuas Hulu, West Kalimantan, Indonesia
Hansen detects high rates of phantom
deforestation.
In addition to that, superimposing Hansen deforestation datasets (2005-2010) with FORCLIME land-cover classification (2005) indicates that large quantities of forest loss appear outside of forest land-cover classes. In fact, this illustrates that deforestation detected by Hansen predominately appears in areas, which are not regarded as natural forests. The example shown in Figure 2 shows that only 23,227 ha of forest loss identified by Hansen between 2005-2010 in Kapuas Hulu appear on natural forest land-cover classes. 57,450 ha of deforestation was detected within non-forest land-cover classes. Consequently, Hansen datasets for Kapuas Hulu result in an overestimation of deforestation by 347%. If this so called phantom deforestation is excluded from Hansen forest loss datasets, deforestation appears to be similar to FORCLIME results.
Very high phantom deforestation rates indicate an
overestimation of forest loss in the ‘Hansen Map’.
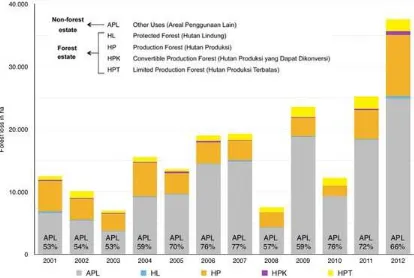
To illustrate these findings an additional comparison of forest loss was conducted using two land use types only: forest (‘kawasan hutan’) and non-forest estate (APL). Superimposing Hansen derived forest loss data with forest and non-forest estate boundaries from the Ministry of Forestry, reveals that deforestation detected by Hansen predominately occurs outside forest estates (Figure 3). 68.46% of deforestation encountered by Hansen in Berau (East Kalimantan) between 2000-2012 was found outside of forest estate boundaries. Even though, forest losses on APL areas undoubtedly occur, only 6.75% (6.2 Mha) of Indonesian forests were located on APL areas in 2009.3 Therefore, the high rate of deforestation on non-forest estates suggests that the Hansen dataset erroneously identifies non-forest land cover types as forest (e.g. shrubland, shifting cultivation, regrowth…Figure 2) Therefore the high deforestation rate on non-forest land can be regarded as an additional indicator for the overestimation of forest loss detected by Hansen.
Figure 3: Hansen forest loss per legal land estate and percentage of deforestation on APL areas in Berau, East Kalimantan, Indonesia
The dataset in its current publicly available
version has to be regarded as impractical and
unreliable for the quantification of forest loss in
humid tropical areas with high land-use dynamics.
The comparison of forest cover and deforestation datasets on district level clearly indicates that even though Hansen’s dataset shows significant potential for forest monitoring, his main intention to provide a globally consistent and locally relevant dataset of forest change has not been achieved. We show that the globally unified forest definition in combination with the per-pixel estimates of tree cover used by Hansen et al, leads to a significant overestimation of tree cover and consequently forest extent.
Therefore, the dataset in its publicly available version has to be regarded as impractical and unreliable for the quantification of forest loss in Indonesia. Furthermore it is questionable if the dataset and its interpretation is able to detect the real forest cover and forest cover changes in similar climatic zones around the globe. Consequently it needs to be verified if the application of the Global Forest Watch tool and other results based on the ‘Hansen Map’ are applicable at all in the context of good forest governance, climate change mitigation (REDD+) and biodiversity conservation.

