FOR THIRD QUARTER 2002
Contents
Page
Financial Highlights 2
Net Interest Income 5
Non-Interest Income 6
Operating Expenses 7
Provisions 7
Asset Quality 8
Balance Sheet 9
Financial Highlights
DBS prepares its financial statements in accordance with Singapore Generally Accepted Accounting Principles (“Singapore GAAP”).
Unaudited Financial Performance Summary For Third Quarter 2002
9 Mths 2002
9 Mths 2001
3rd Qtr 2002
2nd Qtr 2002
3rd Qtr 2001
S$'m S$'m S$'m S$'m S$'m
For the period (GAAP basis)
Operating profit 1,434.1 1,289.8 462.1 474.8 510.5
Net Profit before tax 1,119.2 1,053.0 323.7 380.5 286.6
Net Profit after tax attributable 734.6 830.5 199.1 257.8 201.0
to members
For the period (excluding goodwill amortisation)
Operating profit 1,639.6 1,353.4 531.3 543.6 574.1
Net Profit before tax 1,324.7 1,116.6 392.8 449.2 350.2
Net Profit after tax attributable 940.2 894.0 268.2 326.5 264.6
to members
At period-end
Shareholders' funds 14,089.4 11,183.7 14,089.4 14,067.4 11,183.7
Customer loans 63,442.3 67,957.9 63,442.3 64,561.2 67,957.9
Customer deposits 100,418.7 105,835.2 100,418.7 102,984.1 105,835.2
Total assets 148,117.1 147,414.1 148,117.1 152,008.9 147,414.1
S$ S$ S$ S$ S$
Per share
Basic earnings excluding goodwill 0.85 0.90 0.72 0.88 0.42
amortisation (annualised)
Basic earnings (annualised) 0.66 0.80 0.53 0.69 0.30
Fully diluted earnings (annualised) 0.63 0.76 0.51 0.66 0.30
Net tangible asset value at period-end 5.80 4.56 5.80 5.74 4.56
Performance ratios (annualised)
9 Mths 2002
9 Mths 2001
3rd Qtr 2002
2nd Qtr 2002
3rd Qtr 2001
(%) (%) (%) (%) (%)
On a GAAP basis
Return on assets 0.65 0.83 0.53 0.67 0.26
Return on equity 7.09 9.16 5.66 7.37 3.49
Excluding goodwill amortisation
Return on assets 0.84 0.94 0.71 0.85 0.34
Return on equity 9.07 10.34 7.62 9.34 4.63
Efficiency and revenue mix ratios
Cost to income ratio (excluding goodwill 45.7 47.3 46.0 46.2 44.7
amortisation)
As a percentage of total operating income:
- Net interest income 66.4 60.4 68.2 65.6 56.6
- Non-interest income 33.6 39.6 31.8 34.4 43.4
BIS Capital ratios (at period-end)
- Tier 1 capital 13.7 9.1 13.7 12.6 9.1
Adoption of New Accounting Standards
Effective for financial periods beginning on or after April 1, 2001, companies in Singapore are required to adopt the revised Statement of Accounting Standard 12 on Income Taxes. As a result, DBS Group Holdings and its subsidiary companies (“DBSH Group”) have applied the revised Standard with effect from January 1, 2002. There is no material impact on the Group financial statements for nine months 2002.
Change of Accounting Policies
The assets and liabilities of foreign subsidiary companies and branch operations are translated into Singapore dollars at the exchange rates prevailing at the balance sheet date whilst the income and expense items are translated at the average rates for the financial period. This change was effected retrospectively from January 1, 2002.
Unaudited Financial Performance Summary For Third Quarter 2002
S$'m
9 Mths 2002
9 Mths 2001
3rd Qtr 2002
2nd Qtr 2002
3rd Qtr 2001
Profit and Loss Account
Net interest income 2,003.3 1,549.9 670.6 663.4 588.4
Non-interest income 1,014.5 1,016.4 312.6 347.6 449.7
Income before operating expenses 3,017.8 2,566.3 983.2 1,011.0 1,038.1
Operating expenses (1,378.1) (1,212.9) (452.0) (467.5) (464.0)
Goodwill amortisation (205.6) (63.6) (69.1) (68.7) (63.6)
Operating profit 1,434.1 1,289.8 462.1 474.8 510.5
Provisions (353.3) (292.0) (150.2) (107.2) (245.5)
Associated and joint venture 38.4 55.2 11.8 12.9 21.6
companies
Net profit before tax 1,119.2 1,053.0 323.7 380.5 286.6
Net profit after tax attributable 734.6 830.5 199.1 257.8 201.0
to members (NPAM)
NPAM excluding goodwill 940.2 894.0 268.2 326.5 264.6
amortisation
Profit and Loss
DBSH Group’s operating profit increased by 11.2% to S$1,434 million in nine months 2002 over the same period in 2001. Financial results of Dao Heng Bank Group Limited (DHG) and DBS Vickers Securities Holdings Pte Ltd (DBSV) were consolidated from June 29, 2001 and September 12, 2001 respectively. Consequently, the Group’s financial results had the full nine-month impact of the acquisitions in 2002. The consolidation is based on current ownership interest of 71.6% for DHG and 59.5% for DBSV.
Net profit attributable to members (NPAM) decreased by 11.5% to S$735 million as a result of the higher provision charge. Provision charge for nine months 2002 was S$353 million reflecting the uncertain economic environment and a soft property market. Cost-to-income ratio was 45.7% compared to 47.3% for nine months 2001.
Contributions from Dao Heng Bank Group Limited (DHG)
DHG’s operating profit for 3rdQtr 2002 increased by 10.3% compared to the previous quarter. Non-interest
income was higher due to income from sale of investment products. The 2nd Qtr 2002 accounts included a S$69 million provision charge for valuation shortfall in DHG owned properties.
Unaudited Financial Performance Summary For Third Quarter 2002
S$'m
9 Mths 2002
9 Mths 2001
3rd Qtr 2002
2nd Qtr 2002
3rd Qtr 2001
Profit and Loss Account
Net interest income 471.3 149.8 157.1 154.4 149.8
Non-interest income 171.7 68.9 60.2 49.4 68.9
Income before operating expenses 643.0 218.7 217.3 203.8 218.7
Operating expenses (278.8) (100.4) (92.3) (90.5) (100.4)
Operating profit 364.1 118.4 125.0 113.3 118.4
Provisions (133.1) (23.6) (21.8) (74.3) (23.6)
Associated and joint venture 2.1 3.6 (1.6) 1.1 3.6
companies
Net profit before tax 233.2 98.3 101.5 40.2 98.3
Net profit after tax 188.4 83.6 88.3 25.6 83.6
Note:
1/ Appropriate adjustments have been made to Dao Heng Bank Group Limited accounts to bring them in line with the Singapore Generally Accepted Accounting Principles.
Exhibit 1
Group Net Interest Income and Net Interest Margin
1 , 4 3 0
2 , 0 3 5 2 , 0 3 9 2 , 2 5 7
1 , 5 5 0 2 , 0 0 3
5 8 8
6 6 3 6 7 1
0 5 0 0 1 ,0 0 0 1 ,5 0 0 2 ,0 0 0 2 ,5 0 0
1 9 9 8 1 9 9 9 2 0 0 0 2 0 0 1 9 M th s 2 0 0 1
9 M th s 2 0 0 2
3 r d Q tr 2 0 0 1
2 n d Q tr 2 0 0 2
3 r d Q tr 2 0 0 2
S $ ' m
2 .0 0 1 .9 6 2 .0 0
1 .7 7 1 .7 8
1 .8 7 2 .0 2 2 .0 2 1 .7 7
0 1 2 3 ( %)
Net Interest Income and Net Interest Margin
Nine month 2002 net interest income increased by 29.3% to S$2,003 million. A large part of the increase was due to the inclusion of nine months of DHG’s net interest income compared to three months for the same period last year. Excluding DHG, net interest income was 9.4% higher than nine months 2001, reflecting the benefit of lower funding costs.
Compared with 2nd quarter 2002, net interest income increased by 1.1% to S$671 million. Net interest margin was 2.00% for nine months 2002, an improvement of 0.22 percentage points over same period last year. The benefit of lower funding costs, which resulted in improved margin, was partially offset by lower lending spreads, limited lending opportunities and reduced benefits for net free funds.
For the quarter, net interest margin was 2.00% compared to 1.96% for second quarter 2002, despite highly competitive market conditions and intense interest margin pressure for both
Table 1
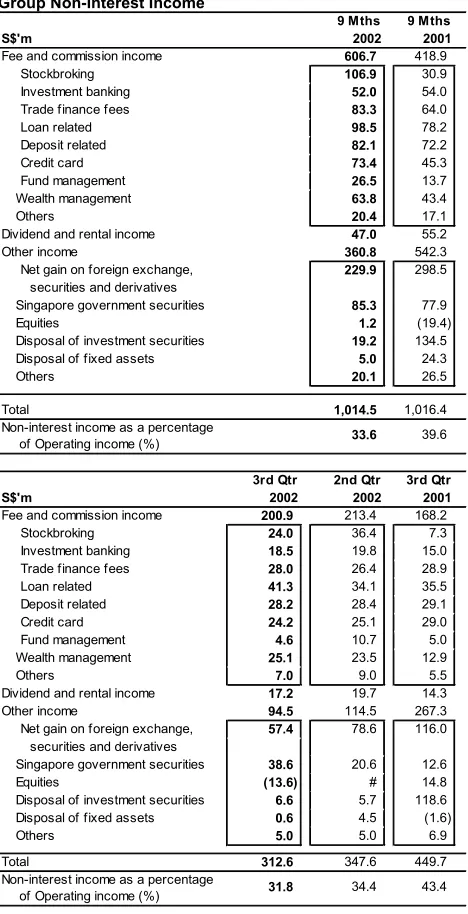
Non-interest income as a percentage of Operating income (%) Non-interest income as a percentage
of Operating income (%) 31.8 43.4
Fee and commission income increased by 44.8%. The increase was mainly driven by the full nine-month contributions from DHG and DBSV. Excluding the contributions from these acquisitions, fee and commission was 13.4% higher than the same period last year. The increase was due mainly to fees received from fund management, sale of wealth management products and growth in loan related fees. Credit card fees grew by S$6 million or 20.0%, following the increase in the number of credit cards issued.
Compared to 2nd Qtr 2002, fee and commission income was 5.9% lower in the third quarter. The decline in stockbroking and fund management fees over the previous quarter was due to the less favourable conditions in the equity markets.
Other income for nine months 2002 declined 33.5%. Nine month 2001 results included a S$181 million profit from the sale of shares in The Insurance Corporation of Singapore Limited and Keppel Capital Holdings Limited.
Table 2 (excluding Goodw ill amortisation)
Staff Head Count Number 12,102 13,687 (excluding Goodw ill amortisation)
Staff Head Count Number 12,102 12,335 13,687 (at period-end)
Operating Expenses
Excluding operating expenses of DHG and DBSV, and goodwill amortisation, nine month 2002 operating expenses declined 8.4% over the same period in 2001.
Staff costs were lower as a result of lower staff bonuses and headcount reduction that arose from rationalisation of workflow and businesses. Other operating expenses also declined as a result of the implementation of cost management initiatives. Last year’s divestment of the Group’s stake in former subsidiaries, The Insurance Corporation of Singapore Limited and DBS Bank Philippines Inc., also resulted in lower costs as their operating expenses have been excluded.
The Group’s cost-to-income ratio (excluding goodwill amortisation) was 45.7% for nine months 2002 compared with 47.3% for the same period in 2001.
Compared to the second quarter, third quarter operating expenses were 5.4% lower, reflecting the Group’s effort in cost discipline. Cost-to-income ratio was maintained at 46.0%.
Table 3
Provision charge was S$353 million for nine months 2002. Specific provisions for loans and valuation shortfall for properties in Hong Kong dominated the charge.
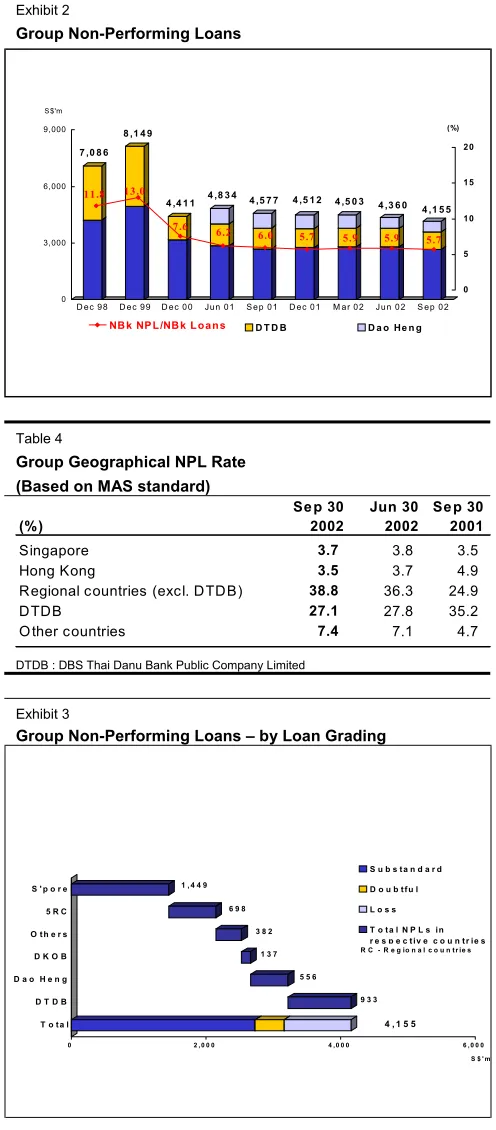
Exhibit 2
Group Geographical NPL Rate (Based on MAS standard)
(%)
DTDB : DBS Thai Danu Bank Public Company Limited
Exhibit 3
Group Non-Performing Loans – by Loan Grading
9 3 3
The volume of non-performing loans (NPLs) declined to S$4.2 billion at the end of September 2002. The ratio of NPLs to the total non-bank loans (NPL rate) decreased from 5.9% at the end of June 2002 to 5.7% as at the end of September 2002 due mainly to recoveries and write-off of previously provided debts.
The NPL rate for Hong Kong operations was 3.5% at the end of September 2002. Our Hong Kong credit card business recorded a 1.16% loan delinquent rate for 90 days past due. The net charge-off rate rose to 10.8%, reflecting the higher unemployment rate and increases in personal bankruptcy filings.
Of the total S$4.2 billion NPLs as at the end of September 2002, 66% were in the substandard category, 10% in the doubtful category and the remaining 24% in the loss category.
Exhibit 4
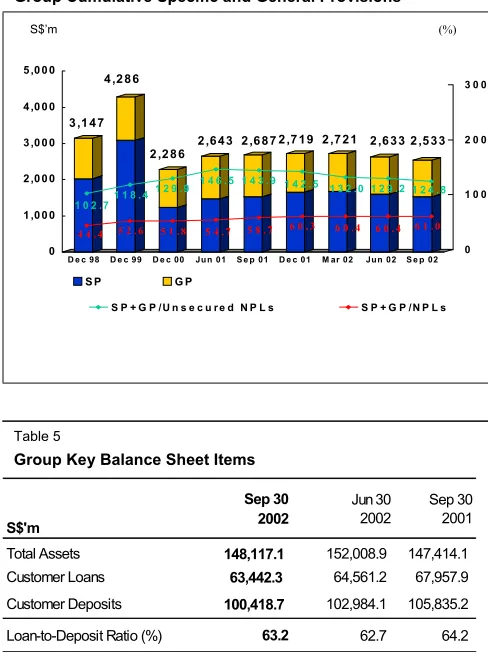
Group Cumulative Specific and General Provisions
0 1 ,0 0 0 2 ,0 0 0 3 ,0 0 0 4 ,0 0 0 5 ,0 0 0
D e c 98 D e c 99 D e c 00 Ju n 01 S e p 01 D e c 01 M ar 02 Jun 02 S e p 02
S P G P 3 ,1 4 7
2 ,6 4 3 4 ,2 8 6
2 ,6 8 7 2 ,2 8 6
2 ,7 1 9 2 ,7 2 1 2 ,6 3 3 2 ,5 3 3
1 2 4 . 8 1 2 9 . 2 1 3 2 . 0 1 4 2 . 5 1 4 3 . 9 1 4 6 . 5 1 2 9 . 9 1 1 8 . 4 1 0 2 . 7
6 1 . 0 6 0 . 4 6 0 . 4 6 0 . 3 5 8 . 7 5 4 . 7 5 1 . 8 5 2 . 6 4 4 . 4
0 1 0 0 2 0 0 3 0 0
S P + G P / U n s e c u r e d N P L s S P + G P / N P L s
Cumulative Specific and General Provisions
Total cumulative specific and general provisions at the end of September 2002 was 124.8% of unsecured NPLs, and 61.0% of total NPLs (or 63.5% of total NPLs of S$3,989 million under US SEC guidelines).
Table 5
Group Key Balance Sheet Items
S$'m
Sep 30 2002
Jun 30 2002
Sep 30 2001
Total Assets 148,117.1 152,008.9 147,414.1
Customer Loans 63,442.3 64,561.2 67,957.9
Customer Deposits 100,418.7 102,984.1 105,835.2
Loan-to-Deposit Ratio (%) 63.2 62.7 64.2
Balance Sheet
At the end of September 2002, total assets was S$148.1 billion. Customer loans decreased by 6.6% to S$63.4 billion, due mainly to the limited loan demand in a highly competitive environment. Customer deposits decreased by 5.1% to S$100.4 billion. The Group’s loan-to-deposit ratio at the end of September 2002 was 63.2%.
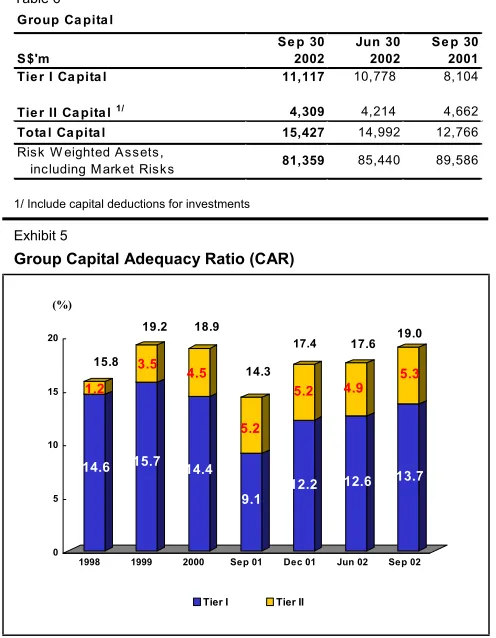
Table 6
Group Ca pita l
S$'m
Se p 30 2002
Jun 30 2002
Se p 30 2001 Tie r I Ca pita l 11,117 10,778 8,104
Tie r II Ca pita l 1/ 4,309 4,214 4,662
Tota l Ca pita l 15,427 14,992 12,766 Risk W eighted A ssets,
including M ark et Risks 81,359 85,440 89,586 1/ Include capital deductions for investments
Exhibit 5
Group Capital Adequacy Ratio (CAR)
14.6 1.2
15.7 3.5
14.4 4.5
9.1 5.2
12.2 5.2
12.6 4.9
13.7 5.3
0 5 10 15 20
1998 1999 2000 Sep 01 Dec 01 Jun 02 Sep 02
Tier I Tier II (%)
15.8
19.2 18.9
17.4 14.3
17.6 19.0
Capital Adequacy Ratio (CAR)
At the end of September 2002, the total CAR for the DBSH Group, measured according to the Bank for International Settlements (BIS) guidelines was 19.0%, more than twice the minimum CAR requirement of 8.0%. The Tier 1 CAR ratio was 13.7% after deducting goodwill of S$5.0 billion in connection with the acquisitions of DHG and DBSV.