1 THE GROWTH OF INDONESIAN EXPORT-IMPORT AND ITS INCIDENTAL MATTERS
Tulus Tambunan Kadin Indonesia-Jetro
June 2006
[image:1.609.64.557.370.542.2]The Growth in the Aggregate Level
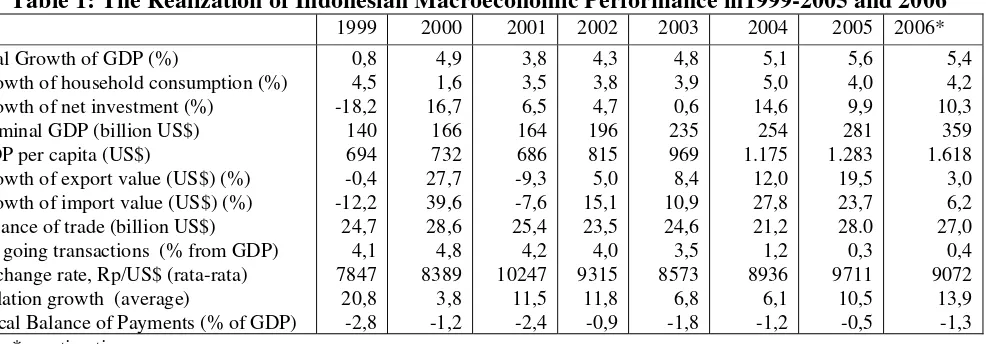
Table 1 explains data related to the growth of several significant variables of Indonesian macroeconomic during 1999 and estimation of 2006 including the growth of export-import activities (namely foreign trade balance of payments). Following the growth of Indonesia’s export value up to 19.5% in 2005, it is estimated that in 2006 the value will decline to the low 3.0%. At the same time, the imports value also steeply fall from 23.7% in 2005 to 6.2% in 2006. Assumptions behind these trend lies in the presumable decline in economic growth since most of domestic economic activities are heavily depended upon the import of processed raw materials, capital and supportive goods, and services as well. However, considering that primary sectors still play an important role in Indonesian economy particularly oil and gas sectors, then a relative high rise in the balance of payments in the future is likely to be achieved.
Table 1: The Realization of Indonesian Macroeconomic Performance in1999-2005 and 2006
1999 2000 2001 2002 2003 2004 2005 2006*
Real Growth of GDP (%)
Growth of household consumption (%) Growth of net investment (%)
Nominal GDP (billion US$) GDP per capita (US$)
Growth of export value (US$) (%) Growth of import value (US$) (%) Balance of trade (billion US$) On going transactions (% from GDP) Exchange rate, Rp/US$ (rata-rata) Inflation growth (average)
Fiscal Balance of Payments (% of GDP)
0,8 4,5 -18,2 140 694 -0,4 -12,2 24,7 4,1 7847 20,8 -2,8
4,9 1,6 16,7 166 732 27,7 39,6 28,6 4,8 8389 3,8 -1,2
3,8 3,5 6,5 164 686 -9,3 -7,6 25,4 4,2 10247 11,5 -2,4
4,3 3,8 4,7 196 815 5,0 15,1 23,5 4,0 9315 11,8 -0,9
4,8 3,9 0,6 235 969 8,4 10,9 24,6 3,5 8573 6,8 -1,8
5,1 5,0 14,6 254 1.175 12,0 27,8 21,2 1,2 8936 6,1 -1,2
5,6 4,0 9,9 281 1.283 19,5 23,7 28.0 0,3 9711 10,5 -0,5
5,4 4,2 10,3 359 1.618 3,0 6,2 27,0 0,4 9072 13,9 -1,3 Note: * = estimation
Source: BPS and Citigroup for the estimation of 2006
Data from BPS (Central Bureau of Statistics) presents that the exports value in January 2006 including oil/gas and non-oil/gas each represents 7.56 billion and 5.73 billion US$, while import side valued 4.39 and 3.18 billion US$ respectively. As a result, Indonesia’s net foreign trade balance for the period of January 2006 for oil/gas and non-oil/gas enjoyed a surplus of 3.17 billion and 2.55 billion US$ subsequently.
and non-oil/gas sectors during January 2006 each improved up to 6.49% and 3.89% compared to the same period of the previous year. Imports in January 2006 were still dominated by imports of raw materials valued 3.23 billion US$ or increased by 1.41% compared to the same period back in 2005.
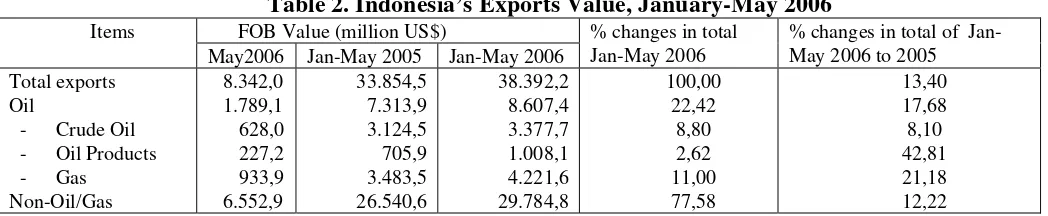
[image:2.609.46.570.221.329.2]Hence, the last data of BPS stated that exports value in May 2006 recorded as the highest number in the history. The exports value in that particular month reached up to 8.34 billion US$ or improved 9.79% compared to value in April 2006. The cumulative exports during the months of January – May set at 38.39 billion US$ or an increase of 13.40% from the same period in 2005 (Table 2).
Table 2. Indonesia’s Exports Value, January-May 2006 FOB Value (million US$)
Items
May2006 Jan-May 2005 Jan-May 2006
% changes in total Jan-May 2006
% changes in total of Jan-May 2006 to 2005 Total exports
Oil
- Crude Oil - Oil Products - Gas
Non-Oil/Gas
8.342,0 1.789,1 628,0 227,2 933,9 6.552,9
33.854,5 7.313,9 3.124,5 705,9 3.483,5 26.540,6
38.392,2 8.607,4 3.377,7 1.008,1 4.221,6 29.784,8
100,00 22,42
8,80 2,62 11,00 77,58
13,40 17,68 8,10 42,81 21,18 12,22
In general, high exports value recorded in May 2006 mostly due to the price increase of several commodities such as crude palm oil (CPO), rubber and coal as well as the price of crude oil in the world market. During the last five months, rubber exports amounted to 776 million US$, CPO to 360 million US$, and coal reached 800 million US$. Based on these facts, BPS predicted that the total exports of Indonesia during the year of 2006 could reach up to 100 million US$ assuming the favorable world economic condition and high world demand toward Indonesian export products (Kompas, Tuesday, July 4, 2006, p.17).
On the import side, as it was recorded in May 2005, the value reached 5.96 billion US$ or up by almost 6.50% compared to the value in April 2006. During the period of January-May 2006, imports value reached a high of 23.14 billion US$ or dropped by 2.12% from the same period in 2005.
3 Figure 1: Trend of Indonesia’s Foreign Trade Balance (NP), Exports (X) and Imports (M),
during 2000-2005 (million US$).
0 10000 20000 30000 40000 50000 60000 70000 80000 90000 100000
2000 2001 2002 2003 2004 2005
NP X M
Source: BPS.
The Development of Export, Import and Trade Balance Structures
Due to its high dependent on oil/gas sectors, although showing a declining trend it its proportion, then the development of Indonesia’s trade balance structure in terms of oil/gas and non-oil/gas becomes extremely has crucial. As it is shown in Table 3, oil/gas sector is yet hold the most significant sources of surplus for Indonesia’s foreign trade balance. Without oil/gas sector, the average/year surplus in foreign trade balance was lower than the surplus in non-oil/gas sector even recorded a deficit balance in certain years.
Table 3. Indonesia’s Trade Balance of Oil/Gas and Non-Oil/Gas, in 1994-January 2006 (billion US$) Including Oil/Gas Excluding Oil/Gas
Year
Export Import Export Import
1994 1995 1996 1997 1998 1999 2000 2001 2002 2003 2004 2005 Jan.2006
40,1 45,4 49,8 53,4 48,9 48,7 62,1 56,3 57,2 61,1 71,6 85,7 7,6
31,9 40,6 42,9 41,7 27,3 24,0 33,5 30,96
31,3 32,6 46,5 57,7 4,4
30,4 34,95
38,1 41,8 40,98
38,9 47,8 43,7 45,1 47,4 55,94
66,4 5,7
29,6 37,7 39,3 37,8 24,7 20,3 27,5 25,5 24,8 24,9 34,8 40,2 3,2 Source: BPS
Indonesia. Especially those export of machinery and transportation utilities have soared sharply from 3.1 billion US$ in 1994 to almost 14 billion US$ in 2005. Exported manufacturing products based on its material during the same period have also indicated rapid growth though within a relatively lower growth from 9.5billion US$ to 14.4 billion US$ (Table 4).
As it is explained earlier that the exports value in May 2005 enjoyed a significant improvement. From that standpoint, non-oil/gas exports value increased by 10.52% and the exports of oil/gas sector increased by 7.22% from April within the same year. According to the clarification by BPS (Kompas, Tuesday, July 4, 2006 (p.17), the improvement in exports value in May were most contributed to the increase in exports of mining sectors particularly products such as, ore/grains, crusts as well as dust metal. The exports value of those mentioned products improved by 113 million US$ compared to the value reached in April.
Table 4. The Growth of Export Value Based on SITC Goods, in Indonesia, in 1994-Jan.2006 (billion US$)
Year 0 1 2 3 4 5 6 7 8 9 Total export
1994 1995 1996 1997 1998 1999 2000 2001 2002 2003 2004 2005 Jan.2006 3,6 3,6 3,8 3,6 3,7 3,7 3,5 3,3 3,6 3,7 3,97 4,6 0,4 0,14 0,2 0,23 0,3 0,3 0,23 0,23 0,3 0,3 0,2 0,3 0,3 0,02 3,2 5,03 5,1 4,4 3,7 3,4 4,3 4,2 4,5 5,3 6,4 9,0 0,9 10,5 11,5 12,9 13,4 9,4 11,2 15,7 14,3 13,9 15,7 18,6 23,7 2,4 1,4 1,4 1,6 2,3 1,5 1,8 1,8 1,5 2,7 3,0 4,5 5,0 0,4 1,0 1,5 1,7 1,9 2,1 2,4 3,2 2,8 2,97 3,4 4,0 4,5 0,4 9,5 10,4 10,8 9,7 8,8 11,0 12,3 11,2 10,9 11,2 12,9 14,4 1,2 3,1 3,8 5,0 4,6 4,7 5,3 10,8 9,1 9,8 9,8 11,5 13,6 1,01 7,6 7,8 8,9 6,98 6,7 8,2 9,95 9,3 8,2 8,5 9,2 10,3 0,88 0,2 0,05 0,1 6,6 8,0 1,5 0,4 0,44 0,3 0,3 0,25 0,2 0,07 40,1 45,4 49,8 53,4 48,9 48,7 62,1 56,3 57,2 61,1 71,6 85,7 7,6
Note; 0=foods & live animals; 1=beverages & tobacco; 2=raw materials; 3=fuel, lubricating oil & so on; 4=oil/vegetable & animal fat; 5=chemical; 6=manufacturing products based on its materials; 7=machinery & transportation utilities; 8=other manufacturing products ; 9= other certain goods & transactions.
Source: BPS
Now, looking at the import side, the non-oil/gas imports value in May 2006 reached 3.37billion US$ or increase by a mere 0.81% from previous month, whereas during the period of January to May 2006 it amounted to 16.34 billion US$ or declined by 3.89% compared to the same period in 2005. Meanwhile, the import of oil/gas sector in May 2006 reached the level of 1.69 billion US$ or up by 19.94% from April 2006 with cumulative total of 6.80billion US$ during the first five months of 2006 or an increase by 2.39% during same period in the previous year.
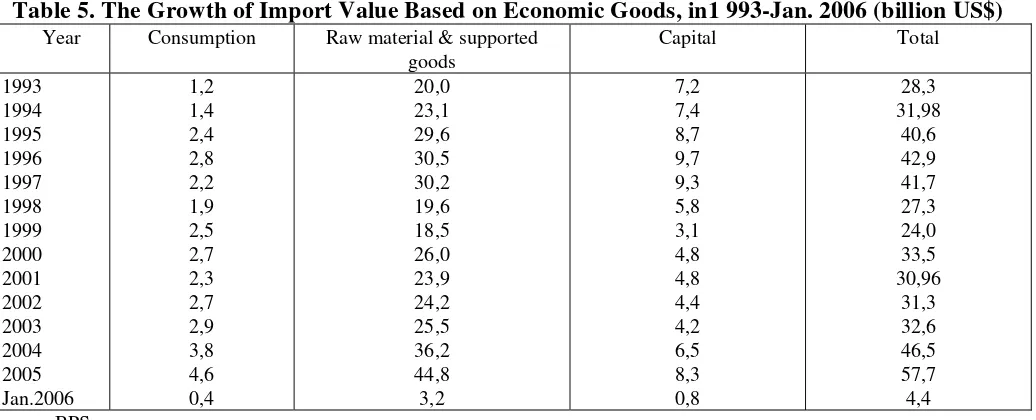
5 development of those goods may be observed in the following tables. The numbers actually reflect government efforts in implementing its industrialization policy has not successfully reduced it dependant toward those imported goods. Table 5 pointed out the increasing trend of imports value growth from those 3 groups of economic goods where raw materials and supported goods recorded as the highest value each years. Highly dependant towards raw materials and supported goods also reflects that the middle stream industry in Indonesia has not been fully developed. Ironically, Indonesia has actually imported a number of raw materials in the form of processed goods, half-ready & ready to use products applied in domestic industries.
Table 5. The Growth of Import Value Based on Economic Goods, in1 993-Jan. 2006 (billion US$) Year Consumption Raw material & supported
goods
Capital Total
1993 1994 1995 1996 1997 1998 1999 2000 2001 2002 2003 2004 2005 Jan.2006
1,2 1,4 2,4 2,8 2,2 1,9 2,5 2,7 2,3 2,7 2,9 3,8 4,6 0,4
20,0 23,1 29,6 30,5 30,2 19,6 18,5 26,0 23,9 24,2 25,5 36,2 44,8 3,2
7,2 7,4 8,7 9,7 9,3 5,8 3,1 4,8 4,8 4,4 4,2 6,5 8,3 0,8
28,3 31,98
40,6 42,9 41,7 27,3 24,0 33,5 30,96
31,3 32,6 46,5 57,7 4,4 Source: BPS
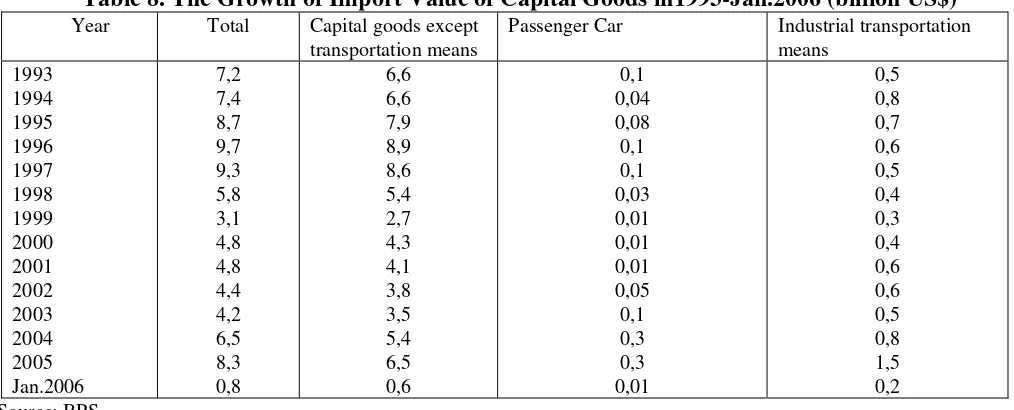
The following tables, Table 6, Table 7 and Table 8, further indicated in more detail the increasing trend of imports value for each goods; consumption goods, raw materials and supported goods, and capital goods during the same period. It can be seen that the biggest components of consumption goods imports came from food preserved with raw materials processed in Indonesia. On the other hand, the biggest components from raw materials and supported goods are preserved oils and fuels; whereas capital goods constituted from capital goods used for production process except transportation means.
Table 6. The Growth of Import Value of Consumptions Goods in 1993-Jan.2006 (billion US$) Foods & beverages for
households
Unclassified Consumption Goods Year Total
Primary Preserve d Preserved fuels & oils Non Industrial transportation
means Durable ½ Durable Endurable
Others 1993 1994 1995 1996 1997 1998 1999 2000 2001 2002 2003 2004 2005 Jan.2006 1,2 1,4 2,4 2,8 2,2 1,9 2,5 2,7 2,3 2,7 2,9 3,8 4,6 0,4 0,1 0,2 0,3 0,3 0,3 0,1 0,2 0,3 0,3 0,4 0,4 0,5 0,4 0,05 0,2 0,4 0,9 1,3 0,6 1,0 1,4 0,7 0,5 0,7 0,8 0,8 1,1 0,1 0,06 0,09 0,1 0,2 0,1 0,1 0,3 0,6 0,5 0,5 0,4 0,8 1,3 0,1 0,01 0,01 0,02 0,01 0,02 0,003 0,01 0,07 0,03 0,08 0,2 0,3 0,3 0,02 0,1 0,1 0,2 0,2 0,3 0,1 0,08 0,2 0,2 0,2 0,3 0,3 0,3 0,02 0,2 0,3 0,3 0,3 0,3 0,2 0,2 0,3 0,2 0,3 0,3 0,4 0,4 0,03 0,2 0,3 0,3 0,4 0,4 0,2 0,2 0,4 0,4 0,5 0,5 0,7 0,7 0,06 0,2 0,1 0,2 0,2 0,2 0,2 0,1 0,1 0,1 0,04 0,08 0,07 0,02 0,0004 Source: BPS
Table 7. The Growth of Import Value of Raw Materials & Supporting Goods in 1993-Jan.2006 (billion US$) Raw material for industry Spare parts & other tools Foods & beverages for
industry
Fuels & Oils Year Total
Primary Preserve d
Primary Preserved
Primary Preserved
[image:6.779.78.703.325.558.2]7
achievement in machinery industry and transportation means in Indonesia was the weak performance by supporting industries as well as poor technology capability. Not to mention that these product category is highly sensitive to any technological changes.
Table 8. The Growth of Import Value of Capital Goods in1993-Jan.2006 (billion US$) Year Total Capital goods except
transportation means
Passenger Car Industrial transportation means 1993 1994 1995 1996 1997 1998 1999 2000 2001 2002 2003 2004 2005 Jan.2006 7,2 7,4 8,7 9,7 9,3 5,8 3,1 4,8 4,8 4,4 4,2 6,5 8,3 0,8 6,6 6,6 7,9 8,9 8,6 5,4 2,7 4,3 4,1 3,8 3,5 5,4 6,5 0,6 0,1 0,04 0,08 0,1 0,1 0,03 0,01 0,01 0,01 0,05 0,1 0,3 0,3 0,01 0,5 0,8 0,7 0,6 0,5 0,4 0,3 0,4 0,6 0,6 0,5 0,8 1,5 0,2 Source: BPS
Table 9. The Growth of Import Values Based on SITC Classified Goods in 1994-Jan.2 (billion US$)
Year 0 1 2 3 4 5 6 7 8 9 Total
import 1994 1995 1996 1997 1998 1999 2000 2001 2002 2003 2004 2005 Jan.2006 1,9 3,0 3,9 2,98 2,6 3,2 2,8 2,5 2,9 3,1 3,8 4,0 0,35 0,1 0,2 0,2 0,3 0,09 0,2 0,2 0,2 0,2 0,2 0,2 0,2 0,02 2,7 3,6 3,5 2,98 2,4 2,5 3,3 3,2 2,7 2,6 3,5 2,4 0,3 2,4 3,0 3,7 4,1 2,7 3,7 6,1 5,5 6,6 7,7 11,8 17,5 1,2 0,1 0,1 0,1 0,1 0,05 0,03 0,05 0,04 0,05 0,05 0,07 0,07 0,01 4,9 6,3 6,0 5,9 4,1 4,5 5,9 5,4 5,3 5,3 7,6 8,1 0,6 5,2 6,7 6,6 6,5 4,5 3,5 5,0 4,3 4,2 4,2 6,2 7,8 0,5 13,5 16,3 17,5 17,6 9,9 5,7 9,2 9,1 8,6 8,6 12,2 15,3 1,3 1,2 1,4 1,4 1,3 0,9 0,7 0,98 0,8 0,8 0,9 1,2 1,3 0,1 0.02 0,04 0,003 0,004 0,001 0,002 0,01 0,01 0,01 0,01 0,00 0.004 0,00 31,98 40,6 42,9 41,7 27,3 24,0 33,5 30,96 31,3 32,6 46,5 57,7 4,4 Note: see Table 4.
Source: BPS
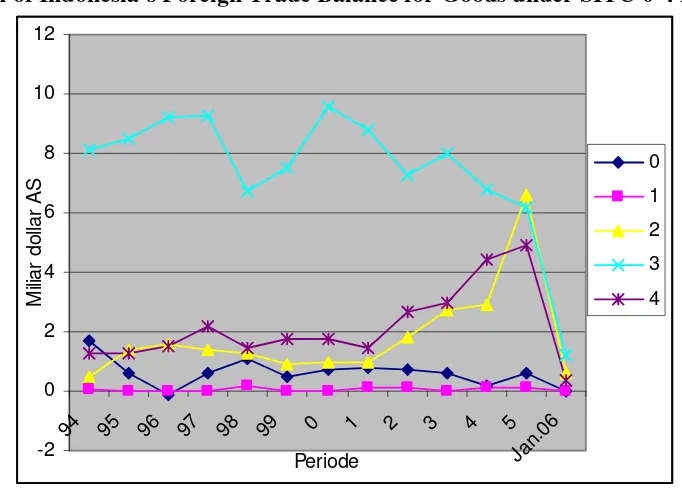
[image:8.609.56.554.377.576.2]9 gradually lessening after 1990’s. Net balance from foreign trade balance of chemical products suffer deficit as well yet its long term growth moving in a positive direction (Figure 3)
Figure 2: The Growth of Indonesia’s Foreign Trade Balance for Goods under SITC 0-4 in 1994-Jan.2006
-2 0 2 4 6 8 10 12
94 95 96 97 98 99 0 1 2 3 4 5
Jan .06 Periode
M
ilia
r d
o
lla
r A
S
0
1
2
3
4
Source: BPS.
Figure 3: The Growth of Indonesia’s Foreign Trade Balance for Goods under SITC in1994-Jan.2006
-15 -10 -5 0 5 10 15
94 95 96 97 98 99 0 1 2 3 4 5
J
an.06
Periode
M
ilia
r d
o
lla
r
A
S
5 6 7 8 9
Source: BPS
The Growth of Industrial Goods Trade Balance
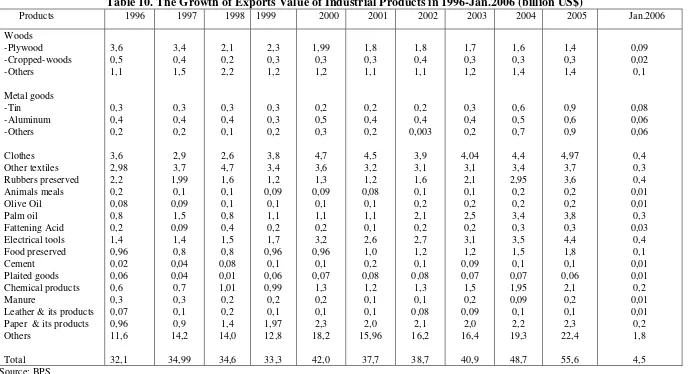
[image:9.609.173.445.411.606.2]such as textiles, clothing and footwear which have been rapidly grow since 1980’s to 1999 as a result of a big jump of their export activities. Further, this industry might benefited from rupiah’s depreciation against US$ during and after the economic crisis in 1998/99. However, following the year of 2000, the export growth of these industries has been fairly stagnating whereas leather products suffered a deficit in the past few years. The main reason behind these facts were on one side the slower trend on its average export per year, and on the other side due to its dependant on imported raw materials such raw leather (Table 10).
The stagnancy of Indonesia’s TPT export following the crisis in 1998 was mainly derived from the inability of this labor intensive industry to compete with TPT from China as well as other countries which were well operated with low production costs (Aswicahyono & Hill, 2004). During the last five years, Chinese products including clothing are flooding the domestic market, not only here in Indonesia but also in European Union (EU) and United States of America ( USA).
A market analysis conducted by Aswicahyono & friends (2005) revealed that Indonesia has started to loose its competitiveness in the TPT industry, particularly garment, even though the labor cost/unit that is the cost of wages in conformity with work productivity remains competitive. Added by the fact that for the past few years, there were none foreign investment (FI) involvement in this industry. Japan’s investment in TPT industry which was somewhat dominant during the New Governance Era has been sharply declined following the crisis in 1997/1998. For example, 4 years prior to the crisis, Japan’s textile industries invested an average of 119 million US$/year into those of Indonesians. However, during 2003 and 2004 the value invested by Japan in this industry was only amounted to 7 million US$/year (Aswicahyono & Hill,2004).
11 Table 10. The Growth of Exports Value of Industrial Products in 1996-Jan.2006 (billion US$)
Products 1996 1997 1998 1999 2000 2001 2002 2003 2004 2005 Jan.2006
Woods -Plywood -Cropped-woods -Others Metal goods -Tin -Aluminum -Others Clothes Other textiles Rubbers preserved Animals meals Olive Oil Palm oil Fattening Acid Electrical tools Food preserved Cement Plaited goods Chemical products Manure
12 industries in terms of reserved condition, particularly rapid growth in production costs of both industries compared to other countries (Thee, 2006).
During the period of 2001 – 2002, general price level in Indonesia has risen by 24% due to increase of electricity tariff (102%), fuel (BBM in Indonesian) (52%), diesel oil (159%), water (27%) and transportation (32%) (James, Ray & Minor, 2003:99). Sharp increase in BBM price at the second semester of 2005 had driven even rapid increase in inflation rate up to 2 digits (Thee, 2006). Besides the increase in BBM price, the rise in minimum wages established by provincial government has strongly burdened TPT industries in Indonesia. Furthermore, several government constitutions regarding labor including separation pay for labor who voluntarily quit or being fired due to criminal acts as well as government constitutions related to regional taxes and other collections has also burdened garment and textile industries (James & friends, 2003).
Other than high production costs to further diminished the competitive edge of Indonesia’s TPT industries, both industries have to deal with low quality level. Consequently, it became more and more difficult for these industries to enter such high quality TPT market caused by low rate of designing and finishing capability. Generally, most of Indonesia’s TPT producers failed to conduct thorough research and development as well as designing activities (Thee, 2006). Any production act was only based on purchasing order received from foreign buyers with all the design specifications and other information required for TPT production. Thus, the weaknesses of both industries in terms of innovation and technology skill are worsened by the obsolete tools used in their production process (James & friends, 2003).
Furniture and wood industries has long becomes the leader of Indonesian manufacturing sector supported by natural and human resources as the comparative advantages of Indonesia as well. During the past few years, these industries proceeds surplus and high exports value in its trade balance. However, wood and plywood sectors shows declining trend as a result of the scarcity of raw materials and encouraged wood price to increase due to degraded potential of Indonesia’s forests as well as bulky woods smuggling to foreign country.
13 Wednesday, June 28, 2006, p.17). From the total of 120 plywood factories in Indonesia, the factory which is currently running in production and exporting their products are merely 52 factories. However, their average production used is less than 50% of normal capacity (Kompas, Wednesday, June 28, p.17).
In contrast, wood industry and forest products have been grow steeply in competitor countries such as China, Malaysia and Vietnam even without their own wood’s raw materials. Indonesia’s furniture exports recorded at 1.79 million US$ or improved in an average 0.088 billion US$/year in the last 8 years. At the same period, furniture exports from China grow in an average 1.1billion US$. China who prohibited wood-cutter in their country did in fact exported furniture amounted to 14 billion US$ in the year of 2005.
However, many believes that Indonesia’s wood industry may survived the competition due to the ability to fit in the market condition by improving quality control, superior design, ability to meet the international environment standard, and enhancing marketing effort in international market (Aswicahyono & Hill, 2004).
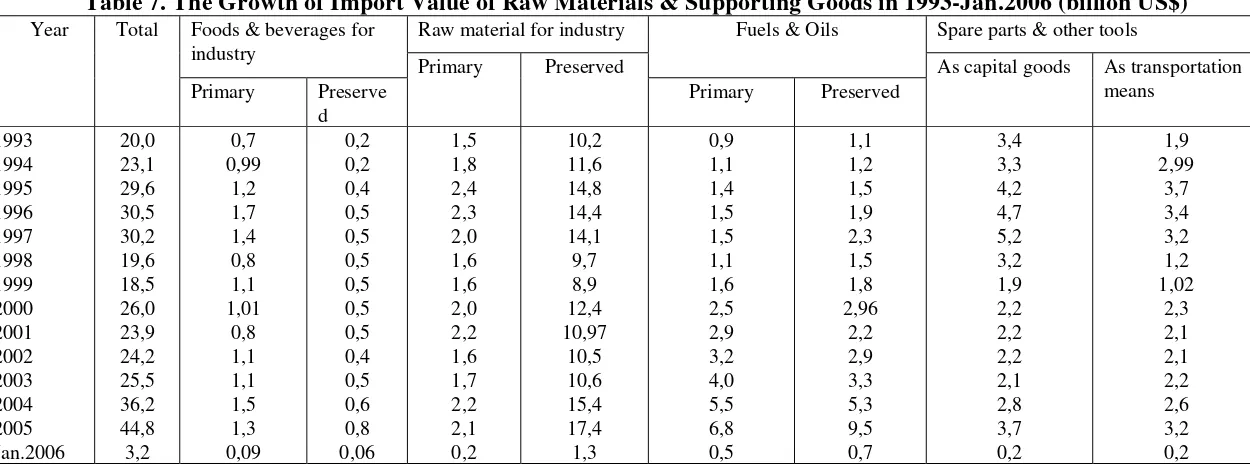
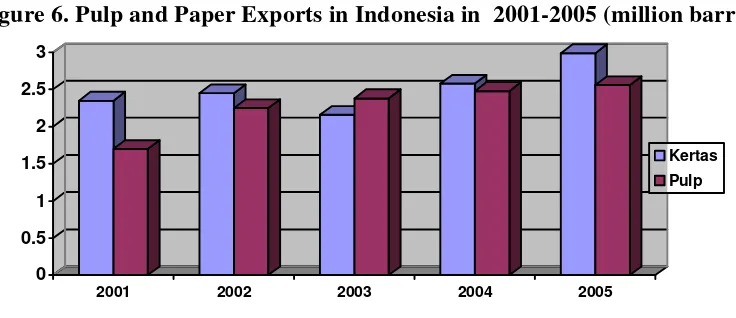
Other industry groups to be the leader in Indonesia’s manufacturing exports are paper, pulp and printing industries. Nonetheless, in the past few years, exports value of this industry tends to decline and the same occurred in imports value. Major contributions of this industry mostly originated by pulp and paper trading, and the export potential in the long run is estimated to be flourish. The growth of paper demand in world market is 2% -3% per year and as a result Indonesian paper and pulp have been much sought for in the international market. Supported by endless raw materials from Industrial Plantation Forest (HTI in Indonesian) has motivated the industry to maintain high competitive edge assuming that Indonesia might also improved its ability to uphold the quality of its paper and pulp products. Latest data revealed that Indonesia’s share in the world market for these particular products has increase from 2.4% to 3% and it is going strong given the demand growth from China. The combination of robust economic growth per year with massive total population in China has driven high demand of pulp and paper from Indonesia (Kompas, June 29, 2006, p.18).
14 Figure 4. Industry Capacity of Pulp and Paper in Indonesia in 2001-2007 (million barrels)
0 2 4 6 8 10 12
2001 2002 2003 2004 2005 2006 2007
Kertas
Pulp
[image:14.609.115.494.269.425.2]Source: Kompas (June 29,2006, p.18).
Figure 5. Pulp and Paper Production in Indonesia in 2001-2005 (million barrels)
0 2 4 6 8 10
2001 2002 2003 2004 2005
Kertas
Pulp
Source: Kompas (June 29,2006, p.18).
Figure 6. Pulp and Paper Exports in Indonesia in 2001-2005 (million barrels)
0 0.5 1 1.5 2 2.5 3
2001 2002 2003 2004 2005
Kertas
Pulp
Source: Kompas (June 29,2006, p.18).
[image:14.609.124.492.449.608.2]15 The development of rubber, rubber products and plastic industries in the trade balance shows surplus value with a tendency to move upward. The positive growth mainly attributed to larger exports of rubber as well as rubber products whereas the imports value experienced insignificant growth or tend to stay stagnate. (Silvia, 2006).
Other industry plays an important role in Indonesia’s manufacturing exports is non-metal excavation industry goods and non-oil/gas industries. This specific group of industry consisting of glass, drinking-glass, cement as well as gypsum. Generally, these products are mainly directed to domestic market, especially cement since it is bulky in nature and cheaper in terms of value compare to its volume. Consequently, the export value of this sector rarely supported and influenced its trade balance which is tend to be stagnate even further declining in conjunction with the increase of domestic needs (Silvia, 2006).
Metal goods industry as well as machinery and transportation means, photography and advance tools has also regarded as the leader in Indonesian manufacturing exports. In the period of 1990’s prior to the economic crisis in 1997/1998, this industry shows a huge deficit in its trade balance mainly for machinery and transportation means. However, the post crisis period indicated the otherwise where the deficit value tends to decline, even reached a surplus in trade balance since the period of 2002-2003. Meanwhile, year 2004 brought back the deficit value in its balance. Trade balance surplus during 2000-2003 mainly attributed to major decline in import value deriving from machinery, since the crisis up to 2003. On the contrary, machinery export value booked a high time increase since 2000 thus the value exceeding its import value. This was indicated by the relocation of foreign investment abroad and resulting in the export of machinery used by those foreign investment to its designated location, and obviously the import value tend to decrease as well (Silvia, 2006)
Main Factors Influential to Hamper the Growth of Indonesia’s Manufacturing Exports in Recent Years
16 1. Declining cost competitiveness due to higher appreciation of rupiah’s and inflation rate in comparison with
inflation rate in the counter trade partner. IMF suggested that labor cost/unit in Indonesia nowadays is 35% higher than prior to the crisis. Low cost competitiveness of Indonesia’s manufacturing industry also a result of a high domestic transaction costs in Indonesia.
2. Declining trend of investment. Poor business condition in Indonesia is also considered to be another main problem in preventing export growth due to the inability to attract foreign investments which was the prominent player in boosting non-oil/gas exports, including industrial products. The absent of foreign investment also means that new investment required to product upgrading is poorly performed. Foreign investment may also contributed to the increase of non oil/gas exports, industrial products in particular, as can be observed through the rapid growth of industrial products exports at the end of 1980’s up until 1996. Outstanding export growth achievement came from China as most of its business activities directed to maintain exports from foreign investment.
3. Fierce International Competition. China and Vietnam has been the biggest competitors for Indonesia since they are competing in the exports of product from labor intensive industry similar to those in Indonesia, such as textile, garment and footwear, and rapidly growing compared to Indonesia’s exports. As a result, Indonesia lost its market share in 30 non-oil/gas export to China and Vietnam, including industrial products such as textile, footwear and other labor intensive products (Pangestu, 2005).
4. Poor Trade Facility. Numerous restrictions in harbor and physical facility have been one of the main factors to enlarge the costs of exported products. Although the tariff of using Indonesian harbor/port is relatively low but almost all exports from Indonesia transshipped through Singapore or Malaysia due to lack of efficiency in Indonesia’s harbor/port. According to the analysis related to the efficiency of Indonesia’s harbor, namely Jakarta International Container Terminal, JICT), as the main terminal in Tanjung Priok which is the biggest terminal throughout Indonesia is in fact the most inefficient Terminal in the South East Asia. Judging from the productivity side (as in total container to be loaded in one hour) and the cost/unit side (cost to lift a container measuring 40 foot high in an hour) then JICT in Tanjung Priok is again the most inefficient terminal comparing to other harbor in South East Asian, such as Singapore and Port Klang in Malaysia (Ray, 2003).
Resources
Arlini, Silvia Mila (2006), ”Arah Pengembangan Industri Manufaktur Indonesia”, makalah dalam Kongres ISEI ke-X, Menado, 18-20 Juni.
17
Aswicahyono, Haryo; Raymond Atje & Thee Kian Wie (2005), “Indonesia’s Industrial Competitiveness – A Study of the Garmenyt, Auto Parts, and Electronics Industries”, Report for the Development Economics Research Group, The World Bank, Jakarta, March.
Dhanani, Shafiq (2000), “Indonesia: Strategy for Manufacturing Competitiveness”, Vol. II. Main Report, UNDP/UNIDO Project no. NC/INS/99/004, Jakarta, November.
Hill, Hal & Thee Kian Wie (editor) (1998), Indonesia’s Technological Challenge, Institute of Southeast Asian Studies, Singpore.
James, William E; David J. Ray & Peter J. Minor (2003), “Indonesia’s Textiles and Apparel: The Challenges Ahead,
Bulletin of Indonesian Economic Studies,39(3).
Lall, Sanjaya & Kishore Rao (1995), “Indonesia: Sustaining Manufactured Export Growth”, Report submitted to Bappenas, Jakarta, August.
Pangestu, Mari, 2005, “Developing the Trade Sector: Challenges and Strategy Towards Strengthening Industreial Competitiveness”, Ceramah di Symposium “Reinventing Indonesia’s Industrial Competitiveness”, Jakarta, 1 Maret. Ray, David J. (2003), “Survey of Recent Developments”, Bulletin of Indonesian Economic Studres, 39(3).