Eur. J. Pers.17: 347–373 (2003)
Published online 24 September 2003 in Wiley InterScience (www.interscience.wiley.com).DOI: 10.1002/per.491
The Five-Factor Personality Inventory: Cross-Cultural
Generalizability across 13 Countries
A. A. JOLIJN HENDRIKS1,*,y, MARCO PERUGINI2, ALOIS ANGLEITNER3,
FRITZ OSTENDORF3, JOHN A. JOHNSON4, FILIP DE FRUYT5, MARTINA HRˇ EBI´CˇKOVA´6, SHULAMITH KREITLER7, TAKASHI MURAKAMI8, DENIS BRATKO9, MARK CONNER10, JANOS NAGY11, ANTONI RODRI´GUEZ-FORNELLS12,z and IMRICH RUISEL13
1
Department of Medical Psychology, Academic Medical Center/University of Amsterdam, Amsterdam, The Netherlands
2
Department of Psychology, University of Essex, Colchester, UK
3
Department of Psychology, University of Bielefeld, Bielefeld, Germany
4
Department of Psychology, Pennsylvania State University, DuBois, PA, USA
5
Department of Psychology, Ghent University, Ghent, Belgium
6
Institute of Psychology, Academy of Sciences of the Czech Republic, Brno, Czech Republic
7
Department of Psychology, Tel Aviv University, Tel Aviv, Israel
8
School of Education, Nagoya University, Nagoya, Japan
9
Department of Psychology, University of Zagreb, Zagreb, Croatia
10
School of Psychology, University of Leeds, Leeds, UK
11
Department of Personality and Health Psychology, Eotvos Lorand University, Budapest, Hungary
12
Department of Neuropsychology, Otto von Guericke University, Magdeburg, Germany
13
Institute of Experimental Psychology, Slovak Academy of Sciences, Bratislava, Slovakia
Abstract
In the present study, we investigated the structural invariance of the Five-Factor Personality Inventory (FFPI) across a variety of cultures. Self-report data sets from ten European and three non-European countries were available, representing the Germanic (Belgium, England, Germany, the Netherlands, USA), Romance (Italy, Spain), and Slavic branches (Croatia, Czech Republic, Slovakia) of the Indo-European languages, as well as
Received 7 August 2002 *Correspondence to: A. A. Jolijn Hendriks, Personality and Assessment, Psychological Institute, University of Zu¨rich, Treichlerstrasse 10, CH-8032 Zu¨rich, Switzerland. Tel:þ41 1 634 15 65. Fax:þ41 1 634 15 89. E-mail: [email protected]
yA. A. Jolijn Hendriks is now at the Department of Psychology, University of Zu¨rich, Zu¨rich, Switzerland. zAntoni Rodrı´guez-Fornells is now at the Faculty of Psychology, University of Barcelona, Barcelona, Spain.
Contract/grant sponsor: Grant Agency of the Czech Republic; contract/grant numbers: 406/99/1155; 406/01/1507. Contract/grant sponsor: National Scientific Research Projects of the Hungarian Academy of Sciences; contract/ grant number: OTKA T 018466.
Contract/grant sponsor: Netherlands Organization for Scientific Research (NWO); contract/grant number: 575-68-068.
the Semito-Hamitic (Israel) and Altaic (Hungary, Japan) language families. Each data set was subjected to principal component analysis, followed by varimax rotation and orthogonal Procrustes rotation to optimal agreement with (i) the Dutch normative structure and (ii) an American large-sample structure. Three criteria (scree test, internal consistency reliabilities of the varimax-rotated components, and parallel analysis) were used to establish the number of factors to be retained for rotation. Clear five-factor structures were found in all samples except in the smallest one (USA, N¼97). Internal consistency reliabilities of the five components were generally good and high congruence was found between each sample structure and both reference structures. More than 80% of the items were equally stable within each country. Based on the results, an international FFPI reference structure is proposed. This reference structure can facilitate standardized communications about Big Five scores across research programmes. Copyright#2003 John Wiley & Sons, Ltd.
And the Lord came down to see the city and the tower which the sons of men had built. And the Lord said, ‘Behold, they are one people, and they all have the same language. And this is what they began to do, and now nothing which they propose to do will be impossible for them. Come, let Us go down and there confuse their language, that they may not understand one another’s speech’. So the Lord scattered them abroad from there over the face of the whole earth; and they stopped building the city (Genesis 11: 5–8).
The Five-Factor Personality Inventory (FFPI; Hendriks, unpublished doctoral disserta-tion; Hendriks, Hofstee, & De Raad, 1999a, 1999b; Hendriks, Hofstee, De Raad, & Angleitner, unpublished manuscript) is an instrument to assess a person’s position on the dimensions Extraversion, Agreeableness, Conscientiousness, Emotional Stability, and Autonomy. The first four dimensions are well established basic factors of personality; the status of the fifth factor, Autonomy, needs yet to become clear. The FFPI consists of 100 brief and simple behaviourally descriptive items in the third person singular (e.g. takes risks, avoids company) that can be used for other-ratings as well as self-ratings. Ratings are made on a five-point scale running fromnot at all applicabletoentirely applicable. A person’s position on each of the five dimensions is based on (differentially) weighted sums of all his or her 100 item responses (Hofstee, Ten Berge, & Hendriks, 1998). This scoring procedure according to rotated principal components, yielding uncorrelated factor scores, maximizes internal consistency reliability and amount of variance explained (Ten Berge & Hofstee, 1999).1
Preliminary findings suggested the FFPI to be a reliable and valid instrument (Hendriks, unpublished doctoral dissertation). Both internal consistency (¼0.83–0.89) and six-month test–retest reliability (r¼0.79–0.83) of the factor scores were satisfactory to high and correlations with convergent measures substantial (e.g. self/mean peer: r¼0.54– 0.72). Subsequent studies confirmed this first impression. In a variety of Dutch and Flemish samples, the replicability of the five-factor structure was demonstrated and, overall, the FFPI showed good psychometric properties (Hendriks et al., 1999a). 1
Substantial correlations (r¼0.58–0.83) were found between the FFPI factors Extraver-sion, Agreeableness, Conscientiousness, and Emotional Stability and their respective counterparts in convergent measures such as NEO-PI-R (Costa & McCrae, 1992) and the Berkeley Personality Profile (BPP; Harary & Donahue, 1994); FFPI-Autonomy showed a clear relationship (r¼0.4) to BPP-Intellectual style. Comparably good results and further clarification of the construct validity of Autonomy were found in Italian and Spanish samples (Perugini & Ercolani, 1998; Rodrı´guez-Fornells, Lorenzo-Seva, & Andre´s-Pueyo, 2001). See further Hendriks, Hofstee, and De Raad (2002) for a more detailed overview of the reliability and validity of the FFPI. The present paper adds to the information on its psychometric properties obtained so far as it reports on the replicability and generalizability of the FFPI across a variety of European and non-European cultures.
The FFPI is a product of the lexical paradigm in which it is assumed that all stable individual differences in behaviour that are of social importance become encoded into everyday language (Cattell, 1943, p. 483; Goldberg, 1981). Trait-taxonomic research based on this assumption typically starts with an unabridged dictionary, which is culled for trait-descriptive terms. Self- or other-ratings are collected on domain-representative subsets of traits and subjected to principal component analysis to reveal the underlying structure. In a wide variety of cultures trait-taxonomic research within the lexical paradigm has been carried out; history and findings are extensively documented elsewhere (e.g. De Raad, 2000; Digman, 1990; John, 1990; John, Angleitner, & Ostendorf, 1988). In recent years, agreement emerged that five factors adequately summarize individual differences that exist at the level of traits, called the Big Five (Goldberg, 1981) or Five-Factor Model (FFM; McCrae & Costa, 1997). In spite of serious criticism regarding the number and nature of the factors (Block, 1995; Eysenck, 1991; McAdams, 1992), the FFM has currently become the most widely accepted working hypothesis of personality structure (McCrae & Costa, 1997).
Among the adherents of the lexical hypothesis, good agreement exists on four of the five factors, which are generally labelled Extraversion, Agreeableness, Conscientiousness, and Emotional Stability. Dispute is still going on with respect to the precise content and therefore name of the fifth factor (De Raad & Van Heck, 1994). Whereas initially called Culture (Tupes & Christal, 1961), labels now in use are Intellect (Goldberg, 1992; Ostendorf, 1990), Openness to Experience (Costa & McCrae, 1992), and Creativity or Imagination (Saucier, 1992). Since the development of the FFPI, Autonomy has become another serious candidate to constitute the fifth basic factor (Hendriks, unpublished doctoral dissertation; Hendriks et al., 1999a; Perugini & Ercolani, 1998; Rodrı´guez-Fornells et al., 2001).
There are several Big Five instruments available by now (De Raad & Perugini, 2002), most of them adjective rating lists or lists of items that revolve around adjectives. Examples are Goldberg’s Big Five adjective markers (Goldberg, 1990, 1992), the Interpersonal Adjective Scale Revised for Big Five (IAS-R-B5; Trapnell & Wiggins, 1990), the Big Five Inventory (BFI; John, Donahue, & Kentle, 1991), the B5BBS-25 (Mervielde, 1992), and the Big Five Questionnaire (BFQ; Caprara, Barbaranelli, Borgogni, & Perugini, 1993).
the fact that its factor labels have become almost synonymous with the five-factorial personality model, although the instrument does not originate from the psycholexical approach to personality (De Raad, 1994).
The FFPI does originate from the psycholexical paradigm. In writing the item pool, however, the authors have been inspired by the NEO item format: instead of selecting a representative set of trait adjectives from the trait domain, brief personality-descriptive sentence items were written, referring to observable and concrete behaviour. Adjectives represent the word classpar excellenceto convey trait meaning, but they do not constitute the most adequate language units to be used in a questionnaire aimed to be widely applicable. Because of their abstractness, many trait terms are not very well known at lower levels of education. In turn, the FFPI item format inspired others. Goldberg and co-workers wrote several hundreds of items in the same brief and simple (albeit first person) item format and pooled them with the large majority of 914 items of the FFPI trilingual item pool to constitute the International Personality Item Pool (IPIP), and made these available to other researchers through the world wide web for scientific collaboration (Goldberg, 1999).
The FFPI item pool was largely based on the Abridged Big Five Dimensional Circumplex taxonomic model of traits (AB5C-model; Hofstee & De Raad, 1991; Hofstee, De Raad, & Goldberg, 1992), which integrates the Big Five and circumplex approaches to trait structure. While staying within five dimensions, the AB5C-model maps nuances in trait meaning that can be reliably established, thus offering a more comprehensive starting point than the Big Five dimensions alone for the production of items representing the trait space. The core meaning of the clusters of Dutch trait adjectives in all 65 well filled facets of a total of 90 of the AB5C-model (see De Raad, Hendriks, & Hofstee, 1992) were taken as a point of departure for constructing items. To represent content of the domain not yet fully covered by these 65 facets, additional items were written around personality-descriptive verbs, and complemented with items representing Intellect, at that time taken to be the most robust fifth factor in the psycholexical paradigm (for details, see Hendriks, unpublished doctoral dissertation). Explicit guidelines (Hofstee, 1991) were followed to ensure creating items for an instrument that can be used for a broad range of educational levels, avoids discrimination of certain people or groups of people, and elicits ratings as objectively as possible. These guidelines address the items’ format (phrase items in the third person singular and in observable terms) and wording (avoid idiom, difficult words and expressions, suggestive formulations, etc).
Of the initial pool of 1311 items, only those 914 items that had proven to be translatable into at least two other languages (American English and German) were considered eligible candidates for the final instrument. This strategy was chosen to arrive at an instrument that, in principle, would be suitable for international use: if items proved to be translatable into two other languages, the chance of being translatable into still other languages was expected to be greatly enhanced. To date, the FFPI has been succesfully translated into some 15 languages, confirming the validity of this assumption.
Whereas the authors of the FFPI set out to arrive at an Intellect factor by purposefully over-representing Intellect items in the item pool, they ended up with one that would be best interpreted as Autonomy (Hendriks, unpublished doctoral dissertation). Its core meaning is conveyed by items such ascan easily link facts together,wants to form his/her own opinions, thinks quickly, and analyses problems loading on the positive pole and
(Conscientiousness). Given the lack of robustness of a fifth basic factor (see e.g. De Raad, Perugini, & Szirma´k, 1997) it could have been chosen to construct a four-factor personality instrument. However, Autonomy is an interesting variable in its own right and considered an important concept in many fields of psychology (see Hendriks et al., 2002). As can be inferred from its item content, FFPI-Autonomy seems closely related to the dominant conception of (personal) autonomy in political philosophy, in which critical reflection and making one’s own choices is the core meaning (Metaal, 1992). Perugini and Ercolani (1998) found FFPI-Autonomy to be significantly related not only to other measures conceptually related to Autonomy, such as Self-Awareness (r¼0.59), Sensitivity to Others (r¼0.38), and Generalized Self-Efficacy (r¼0.34), but also to measures of cognitive/intellectual activity and situational exploration; the latter correlations (r¼0.3–0.4) were of comparable size to those of Intellect (correlated with Need for Cognition) and Openness to Experience (correlated with both Capacity for Managing New Situations and Need for Cognition). In comparison with Intellect and Openness to Experience, Autonomy thus seems a broader concept. More recently, FFPI-Autonomy appeared related to non-impulsive risk-taking (Rodrı´guez-Fornells et al., 2001) and non-impulsive or non-conforming buying behaviour (Verplanken & Herabadi, 2001), yielding additional evidence of construct validity of this fifth factor as a measure of independent decision-making.
In the present study, we investigated the psychometric properties of the FFPI in a variety of cultures. We analysed data from ten European and three non-European countries. As regards the European countries, data were available from Belgium, Croatia, Czech Republic, England, Germany, Hungary, Italy, the Netherlands, Slovakia, and Spain. As regards the non-European countries, data were available from Israel, Japan, and the USA. These countries represent the Germanic (Belgium, England, Germany, the Netherlands, USA), Romance (Italy, Spain), and Slavic branches (Croatia, Czech Republic, Slovakia) of the Indo-European languages. In addition, representatives of the Semito-Hamitic (Israel) and Altaic (Hungary, Japan) language families were included. For all translations not yet available from the construction phase of the FFPI, a translation/back-translation procedure was followed. Initial translations were produced by the respective researchers and their co-workers in each country. The back-translations were carried out in the Netherlands, by professionals not familiar with personality language. Two of the Dutch authors of the FFPI independently checked the results for possible shifts in meaning. If necessary, a second round of translation and back-translation followed.
We compared the structure of the FFPI in each country and across countries to Dutch (N¼2494) and American (N¼766) large-sample reference structures. Our aims were
(i) to check whether the five-factor structure could be recovered in each country; (ii) to check the generalizability of the five-factor structure; and
(iii) to establish an international FFPI reference structure, if warranted by the findings.
METHOD
Study and reference samples Belgium
N¼265, 84 males and 179 females (sex of two subjects unknown). Age: 17–62 years,
economy students, participating in a study on personality and vocational preferences (Berings, De Fruyt, & Bouwen, manuscript submitted for publication), and 105 second-year psychology students and their relatives, participating in a study on personality correlates of emotional expression (De Fruyt, 1997).
Croatia
N¼678, roughly balanced for sex. Age: 15–21 years, M19 years. Educational level: above average. The sample comprised three data sets: (i) 264 subjects representative for the twin population in Zagreb, taking part in a longitudinal twin study, 147 males and 117 females, aged 17–21 years; (ii) 255 high-school students taking part in a study on personality and educational achievement, 88 males and 167 females, aged 15–18 years; and (iii) 159 second-year students of computer science, for which, unfortunately, age and sex data were missing. It is known, however, that the majority of the participants were 20–21 years old, and that this subsample was roughly balanced for sex.
Czech Republic
N¼258, 136 males and 120 females (sex of two subjects unknown). Age: 18–62 years,
M¼35 years, SD¼13 years. Educational level: above average. Subjects took part in a research project aimed at validating hypotheses on relations between personality characteristics on various levels of specificity.
England
N¼277, 58 males and 219 females. Age: 17–60 years, M¼21 years, SD¼7 years. Educational level: above average. The sample comprised two data sets: (i) 144 psychology students of the University of Leicester, 33 males and 101 females; and (ii) 143 psychology students of the University of Leeds, 25 males and 118 females.
Germany
N¼417, 163 males and 254 females. Age: 15–74 years, M¼30 years, SD¼11 years. Educational level: above average. The sample comprised four data sets: (i) 41 (33.1%) psychology students and their friends, relatives or others who knew the target person well, to a total of 124 subjects, who took part in a study comparing the FFPI to alternative Big Five instruments (Rosendahl, unpublished diploma thesis); (ii) 63 subjects, mainly psychology students (82%), who took part in a study on the relationship between personality and grade points; (iii) 99 subjects (45% university students) who took part in a study comparing the reliability and convergent and discriminant validity of alternative Big Five instruments (Scharf, Tu¨nte, Brinkmeier, & Benne, unpublished manuscript); and (iv) 131 subjects (63% university students) from the normal population who participated in a study aimed at clarifying the relationship between the structure of personality and the structure of personality disorders (Dieckmann, unpublished diploma thesis; Ostendorf, Dieckmann, & Steiner, 1998).
Hungary
N¼271, 103 males and 160 females (sex of eight subjects unknown). Age: 17–65 years,
M¼27 years, SD¼10 years. Educational level: above average. Subjects were mainly high school (58%) and university (19%) students; for 21% of the subjects, data on educational level were missing.
Israel
in a study on cognitive correlates of the Big Five personality traits within the framework of Meaning Theory (Nussbaum & Kreitler, 1998). They participated in partial fulfillment of course requirements.
Italy
N¼337, 144 males and 191 females (sex of two subjects unknown). Age: 18–73 years,
M¼28 years, SD¼11 years. Educational level: above average. The sample comprised two data sets: (i) 137 psychology students and their friends or relatives who took part in a study concerning the validity of the FFPI in Italy (Perugini & Ercolani, 1998); and (ii) 200 subjects (63% university students) who participated in a study aimed at validating a measure of the personal norm of reciprocity (Perugini, Presaghi, Gallucci, & Ercolani, unpublished manuscript).
Japan
N¼388, 198 males and 189 females (sex of one subject unknown). Age: 18–50 years,
M¼20 years, SD¼3 years. Educational level: above average. Subjects were university students of diverse disciplines. The data were collected in the context of validating the FFPI in Japan by investigating its convergent and discriminant relations with the Japanese Adjective Check List Scales of the Big Five (Wada, 1996).
Netherlands
N¼260, 74 males and 185 females (sex of one subject unknown). Age: 18–71 years,
M¼22 years, SD¼7 years. Educational level: above average. Subjects were first-year students (95%) and staff members of psychology. The data were collected in the context of the construction of the FFPI (Hendriks, unpublished doctoral dissertation; Hendriks et al., 1999a).
Slovakia
N¼573, 259 males and 314 females. Age: 16–19 years, M¼17 years, SD¼1 year. Educational level: above average. Subjects were gymnasium students in six Slovakian cities, on whom data were collected in the context of validating the FFPI in Slovakia.
Spain
N¼567, 87 males and 480 females. Age: 17–45 years, M¼19 years, SD¼3 years. Educational level: above average. Subjects were undergraduate college students enrolled in an introductory course of Psychology at the University of Barcelona. The data were collected in the context of validating the FFPI in Spain (Rodrı´guez-Fornells et al., 2001).
United States of America (USA)
N¼97, 38 males and 49 females. Age: 18–50 years, M¼21 years, SD¼6 years. Educational level: above average. Subjects were high school graduates now enrolled at Penn State University, who participated in a project to replicate and extend a study on the relative ability of self-report inventories to predict acquaintance ratings based on the AB5C conception of the FFM (Johnson, 2000). Subjects received ten extra points toward their course grade (based normally on 180 exam points) for participating in the project. The opportunity to participate was announced in class.
Dutch (NL) reference structure
agreed to periodically complete various questionnaires in return for having free use of a personal computer. These questionnaires are downloaded, and uploaded after completion.
American (USA) reference structure
N¼766, 332 males and 434 females. Age: 18–89 years, M¼50 years, SD¼13 years. Educational level: above average. Subjects were participants in the Eugene–Springfield (Oregon) community sample, who are periodically mailed questionnaires and inventories, which they are paid to complete.
Data analyses
The analyses followed a three-step strategy, corresponding to the three aims of our study.
1. Replicability of the five-factor structure in each country
To check whether the five-factor structure could be recovered in each country, a principal component analysis (PCA) was performed for each country separately. Prior to PCA, acquiescence variance was partialled (Ten Berge, 1999), because it may seriously disturb the factor structure (Hofstee et al., 1998; Ten Berge, 1999).2 Acquiescent responding refers to differential inconsistencies in responding to opposite items (e.g. does things according to a plan versus acts without planning, takes the initiative versus waits for others to lead the way). From a logical standpoint, a person’s mean score on a sizeable number of pairs of opposite items should be the scale midpoint (e.g. ‘3’ on a five-point scale), but this is often not the case. Acquiescence variance can be reliably established and partialled if an instrument contains enough (i.e. 25–30) such pairs of opposite items spread over all factors while the total set of items is sufficiently balanced qua content and, consequently, social desirability (see Hofstee et al., 1998). The 100 FFPI items (20 items per factor, ten per pole) were indeed selected to be balanced on their primary loadings and, as much as possible, their secondary loadings (see Hendriks, unpublished doctoral dissertation, Table 12). The FFPI Acquiescence scale consists of 28 pairs of opposite items (five, four, seven, six, and six pairs from Factors I–V, respectively) that are balanced on both their primary and secondary loadings. In the study samples, internal consistency reliability of this scale ranged from 0.67 (Netherlands) to 0.79 (Czech Republic and the USA), with a mean value of¼0.75. Mean scores on the Acquiescence scale ranged from 2.87 (Italy) to 3.10 (Japan), with a grand mean of 2.97; standard deviations ranged from 0.15 (Netherlands) to 0.25 (USA), with an average value of SD¼0.21. The list of items constituting the Acquiescence scale can be obtained from the first author.
2
PCA on raw item responses typically yields components of which one or more are unipolar rather than bipolar (Hendriks, unpublished raw data). This phenomenon reflects common variance in the item responses that is stylistic (acquiescence response set) rather than content related (see Hofstee et al., 1998). In studies on the structure of personality, it has therefore become common practice to ipsatize variables—i.e. subtracting the individual mean response from all responses per individual—prior to component analysis, to remove this undesired source of variation (see e.g. Goldberg, 1992; Ostendorf, 1990, pp. 151–159). Ten Berge (1999) suggests a more elegant procedure.
Two criteria were used to determine the optimal number of factors to be retained for rotation: (i) the scree test (Cattell, 1966), and (ii) the internal consistency reliabilityof the components (Hofstee, 1999). As suggested by one of the referees, results were compared to those of a parallel analysis (100 simulated random data sets generated from the real data), indicating the absolute maximum number of factors that should be extracted (Reise, Waller, & Comrey, 2000). An SPSS procedure is made available by O’Connor (2000). As regards the scree test, the eigenvalues of the first 14 factors were inspected, to locate the flattening in the curve. As regards the reliability criterion, Hofstee (1999, pp. 116 and 131) states that the lowest, still defensible,of a rotated component (‘total score’) would be¼0.75, yielding the rule of thumb to retain that many components that, after rotation, even the one with the loweststill satisfies this criterion. Hofstee’s argument is that the correlation (r) of a total score and the ideal (‘true’) score is the square root of its reliability, thus, if 0.75, r0.87. A correlation of 0.87 approximates the value to which two vectors, hence their interpretation, can be considered equal (Haven & Ten Berge, 1977). Starting at four rotated components, as suggested by thevalues for the unrotated ones, as many varimax-rotated components were inspected for theiruntil one or more dropped below the lowest defensible value. Instead of0.75, however, we adopted a slightly less conservative criterion of0.72, which is the square root of the value (0.85) for vector identity actually mentioned by Haven and Ten Berge (1977). The values for unrotated and rotated components were computed according to the formulae given by Ten Berge and Hofstee (1999).
2. Generalizability of the five-factor structure across countries
To check the generalizability of the five-factor structure, congruence coefficients (Tucker, 1951) were calculated between each sample structure and two references, also based on self-ratings: the Dutch normative structure (N¼2494) and an American large-sample structure (N¼766). Congruence was established at the level of factors and items, after varimax rotation and after orthogonal Procrustes rotation to optimal agreement (McCrae, Zonderman, Costa, Bond, & Paunonen, 1996).
Both references proved to be clear five-factor structures according to the two criteria for the optimal number of factors listed above. In the Dutch reference structure, the five factors explained 35.8% of the variance, in the American reference structure 29.6%. Acquiescence accounted for another 3 (American reference) to 4% (Dutch reference) of the variance. The values of the varimax-rotated factors were 0.86, 0.82, 0.82, 0.83, and 0.77 (Dutch reference) and 0.84, 0.78, 0.78, 0.80, and 0.77 (American reference) for Extraversion, Agreeableness, Conscientiousness, Emotional Stability, and Autonomy, respectively. The amount of congruence between the two reference structures ranged from 0.87 (Conscientiousness) to 0.96 (Extraversion) for the varimax-rotated components (M¼0.92), and from 0.93 (Conscientiousness) to 0.97 (Extraversion) after orthogonal Procrustes rotation of the American structure to optimal agreement with the Dutch normative structure (M¼0.94). Overall congruence (cf. McCrae et al., 1996) between the two reference structures was 0.93 after varimax rotation and 0.95 after orthogonal Procrustes rotation.
3. Establishing the FFPI international structure
orthogonally Procrustes rotated to a joint Dutch and American reference structure established in the combined data sets (N¼3260) of the two references, to constitute the FFPI international reference structure. The psychometric properties of the FFPI inter-national reference structure and its congruence with the inter-national structures were ascertained.
RESULTS
Replicability of the the five-factor structure
For each country except the USA, the flattening in the curve of eigenvalues occurred between the fifth and sixth eigenvalue (Appendix A). Thus, the scree test almost always suggested a five-factor solution. The internal consistency reliabilities (Appendix B) corroborated this conclusion: according to this criterion (0.72, after rotation), five factors were almost always to be retained because of having sufficient internal consistency reliability. Again, the exception was the USA sample. According to the parallel analyses, the absolute maximum number of factors to be retained varied from seven (Israel and the Netherlands) to nine (Italy and Spain). Further analyses were based on the results of the scree test and the-criterion.
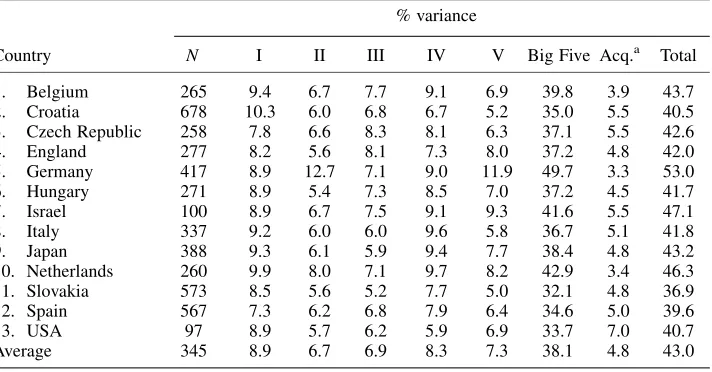
Table 1 summarizes for each country the percentage of variance explained by each of the Big Five factors alone, by the Big Five together, and by acquiescent responding, and the total amount of variance explained. The Big Five factors together explained on average 38.1% of the variance: the lowest percentage (32.1%) was found for Slovakia, the highest percentage (49.7%) for Germany. Acquiescence variance varied from 3.3% (Germany) to 7.0% (USA), with an average value of 4.8%. On average, Extraversion (I), Emotional Stability (IV), and Autonomy (V) appeared somewhat larger in size than Agreeableness (II) and Conscientiousness (III). This finding reflects the selection of items in the FFPI,
Table 1. Percentage of variance explained by each Big Five factor, the Big Five together, and acquiescence, and in total
% variance
Country N I II III IV V Big Five Acq.a Total
1. Belgium 265 9.4 6.7 7.7 9.1 6.9 39.8 3.9 43.7
2. Croatia 678 10.3 6.0 6.8 6.7 5.2 35.0 5.5 40.5
3. Czech Republic 258 7.8 6.6 8.3 8.1 6.3 37.1 5.5 42.6
4. England 277 8.2 5.6 8.1 7.3 8.0 37.2 4.8 42.0
5. Germany 417 8.9 12.7 7.1 9.0 11.9 49.7 3.3 53.0
6. Hungary 271 8.9 5.4 7.3 8.5 7.0 37.2 4.5 41.7
7. Israel 100 8.9 6.7 7.5 9.1 9.3 41.6 5.5 47.1
8. Italy 337 9.2 6.0 6.0 9.6 5.8 36.7 5.1 41.8
9. Japan 388 9.3 6.1 5.9 9.4 7.7 38.4 4.8 43.2
10. Netherlands 260 9.9 8.0 7.1 9.7 8.2 42.9 3.4 46.3
11. Slovakia 573 8.5 5.6 5.2 7.7 5.0 32.1 4.8 36.9
12. Spain 567 7.3 6.2 6.8 7.9 6.4 34.6 5.0 39.6
13. USA 97 8.9 5.7 6.2 5.9 6.9 33.7 7.0 40.7
Average 345 8.9 6.7 6.9 8.3 7.3 38.1 4.8 43.0
Varimax-rotated components: I¼Extraversion, II¼Agreeableness, III¼Conscientiousness, IV¼Emotional Stability, V¼Autonomy.
which have mainly secondary loadings on Factors I, IV, and V in common (see Hendriks, unpublished doctoral dissertation; Hendriks et al., 1999a).
Generalizability of the five-factor structure
Table 2 shows the congruence coefficients (; Tucker, 1951) between the sample structures and the Dutch and American reference structures. The varimax-rotated factors were more congruent with the Dutch reference (average0.91) than the American reference (average 0.86). However, after orthogonal Procrustes rotation to optimal agreement generally good congruence was found with both the Dutch (average0.92) and American (average 0.91) reference structures. Small deviations in factor meaning were still observed between the Czech (0.84), German (0.81), and USA study sample (0.84) Factors II and Israeli Factor III (0.84) and the American reference structure. Note that the values averaged across factors (M) in this table are also indicative of overall congruence (table with overall-values available from the first author).
Also in Table 2, we present the values of the Procrustes-rotated components. On average,was highest for Extraversion (Dutch reference 0.84–0.88, American reference 0.83–0.88) and lowest for Autonomy (Dutch reference 0.73–0.84, American reference 0.75–0.86).
Finally in Table 2, we summarize the amount of congruence at the item level (cf. McCrae et al., 1996). Again, we limit ourselves to reporting on the orthogonally Procrustes-rotated components. At the item level,ranged from 0.27 (USA study sample, Dutch reference) to 0.99 (all study samples, both references). On average, the-values were high. Given the Dutch reference, we observed an overall median value of 0.95 (range Mdn¼0.91 to Mdn¼0.98). Given the American reference, we observed an overall median value of 0.94 (range Mdn¼0.91 to Mdn¼0.95).
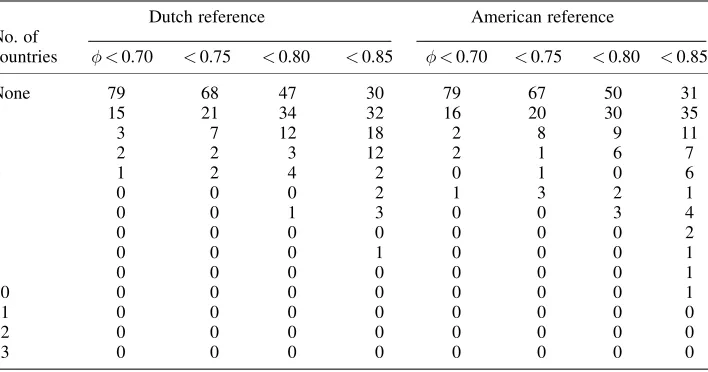
In Table 3, we present the percentage of problem items according to different criteria ranging from a lenient cut-off of0.70 to the stringent one of0.85 that applies to factor identity (Haven & Ten Berge, 1977). The entries denote the percentage (¼number) of items that showed-values according to the column heading, in the number of countries given in the row heading. There is no clear indication in the literature on what constitutes the most appropriate criterion value at the item level. As a rule of thumb, considering that factors are more stable than items due to aggregation and reduction of errors,0.80 may represent a conservative threshold expressing good stability at the level of the items. Overall, slightly more items in more countries failed to replicate the American reference structure than the Dutch reference structure. According to the criterion of 0.80, (3þ4þ1¼) 8% of the items failed to replicate the Dutch reference structure and (6þ2þ3¼) 11% of the items failed to replicate the American reference structure in three (about one-quarter) or more of the countries.
Within countries, the percentage of items that failed to replicate (according to0.80) the Dutch reference structure ranged from 0% (Belgium and the Netherlands) to 15% (USA), with a mean value of 6.5% (SD¼4.8%) and a median value of 6%. The percentage of items that failed to replicate (0.80) the American reference structure ranged from 2% (England and the Netherlands) to 16% (USA), with a mean value of 7.2% (SD¼4.2%) and a median value of 7%. Appendix C shows the problematic items and countries in which they occurred, for the Dutch and American references separately.
after varimax rotation after Procrustes rotation after Procrustes rotation per itema
Country N Reference I II III IV V M I II III IV V M I II III IV V M Range M Mdn
1. Belgium 265 NL 95,94,95,95,90 94 96,96,95,94,94 95 86,85,87,87,76 84 81–99 95 96 USA 93,90,83,94,79 88 93,91,91,94,91 92 86,85,85,87,78 84 68–99 92 94 2. Croatia 678 NL 95,92,94,94,90 93 95,93,94,94,91 93 86,83,84,79,73 81 72–99 94 96 USA 94,88,85,94,81 88 94,88,89,94,90 91 85,83,83,79,75 81 69–99 92 94 3. Czech Republic 258 NL 92,82,83,92,80 86 94,88,89,92,90 91 88,84,85,85,84 85 62–99 91 94 USA 93,81,64,92,69 80 94,84,86,92,90 89 88,83,84,85,86 85 34–99 91 94 4. England 277 NL 91,91,94,94,90 92 94,92,94,95,92 93 87,82,86,84,80 84 64–99 94 95 USA 92,88,87,94,86 89 94,90,92,95,93 93 87,81,84,85,83 84 76–99 93 94 5. Germany 417 NL 95,84,93,93,89 91 95,85,95,93,88 91 86,88,84,83,84 85 47–99 91 94 USA 93,81,79,93,82 86 94,81,92,92,87 89 86,88,83,84,85 85 29–99 89 93 6. Hungary 271 NL 94,91,92,92,92 92 95,93,92,92,93 93 86,81,86,83,80 83 71–99 93 95 USA 91,88,86,93,86 89 91,89,91,93,91 91 85,81,84,84,82 83 61–99 92 93 7. Israel 100 NL 93,79,89,90,86 87 95,85,90,90,90 90 88,85,86,85,84 86 55–99 90 93 USA 91,80,74,91,80 83 92,85,84,91,91 89 88,85,84,86,86 86 51–99 89 91 8. Italy 337 NL 95,90,91,91,90 91 96,92,92,90,91 92 87,84,82,85,77 83 51–99 92 95 USA 94,90,81,93,86 89 94,87,91,94,91 91 87,84,79,84,80 83 54–99 92 95 9. Japan 388 NL 91,87,93,91,90 90 92,90,93,91,90 91 88,81,81,85,81 83 55–99 91 95 USA 91,84,82,92,87 87 91,86,90,92,90 90 88,81,80,86,83 83 69–99 91 93 10. Netherlands 260 NL 98,97,95,98,93 96 98,97,97,98,97 97 87,88,87,86,82 86 88–99 98 98 USA 94,92,77,95,79 87 94,93,90,95,93 93 87,88,86,87,83 86 74–99 94 95 11. Slovakia 573 NL 92,92,93,94,87 92 93,92,93,94,90 92 87,81,79,81,74 80 47–99 93 95 USA 92,90,83,91,77 87 93,90,91,91,88 91 86,81,80,80,75 80 41–99 91 94 12. Spain 567 NL 94,91,92,92,93 92 96,92,93,92,94 93 84,83,84,83,78 82 54–99 94 96 USA 94,87,82,91,84 88 94,88,90,91,93 91 83,83,82,84,80 82 49–99 93 95 13. USA 97 NL 93,73,82,82,83 83 93,85,86,89,86 88 87,82,85,82,80 83 27–99 88 91 USA 92,73,82,84,80 82 93,84,86,90,86 88 86,82,85,83,80 83 30–99 88 92 Average 345 NL 94,88,91,92,89 91 95,91,92,93,91 92 87,84,84,84,79 83 59–99 93 95 USA 93,85,80,92,81 86 93,87,89,93,90 91 86,83,83,84,81 83 54–99 91 94
I¼Extraversion, II¼Agreeableness, III¼Conscientiousness, IV¼Emotional Stability, V¼Autonomy. Decimal points omitted.
A.
A.
J.
Hendri
ks
et
al.
#
2003
John
W
iley
&
Sons,
Ltd.
Eur
.
J.
P
ers.
17
:
347–373
more than half of the countries. Moreover, more than 80% of the items were almost equally stable within each country. Finally, we found no systematic pattern in the problems (Appendix C). Problematic items represent all five factors, suggesting that, occasionally, translations may be non-optimal or that subtle differences between cultures might shift the positioning of a few items.
Establishing an overall FFPI structure
The results regarding the replicability and generalizability of the five-factor structure of the FFPI across countries warranted to establish the overall structure using all 13 countries and all 100 items.3 As in the foregoing analyses, a PCA was performed after having partialled the acquiescence factor, and five factors were retained for rotation. The amount of variance explained by each varimax-rotated factor was 8.6% for Extraversion, 6.9% for Agreeableness, 6.5% for Conscientiousness, 7.7% for Emotional Stability, and 6.5% for Autonomy; together they explained 36.3% of the variance. Acquiescence accounted for another 4.2%; thus, in total, 40.5% of the variance was explained. Thevalues of the components were 0.85, 0.84, 0.83, 0.83, and 0.78 for Extraversion, Agreeableness, Conscientiousness, Emotional Stability, and Autonomy, respectively.
The next step was to calculate congruence coefficients between each sample structure and the overall structure, in order to establish the extent to which the overall structure represents each of the 13 countries (a table with the-coefficients is available from the first author). With only a few exceptions—Czech Republic Factors II (0.84) and V (0.82),
Table 3. Percentage of problem items according to different levels of the criterion ()
Dutch reference American reference
No. of
countries <0.70 <0.75 <0.80 <0.85 <0.70 <0.75 <0.80 <0.85
None 79 68 47 30 79 67 50 31
1 15 21 34 32 16 20 30 35
2 3 7 12 18 2 8 9 11
3 2 2 3 12 2 1 6 7
4 1 2 4 2 0 1 0 6
5 0 0 0 2 1 3 2 1
6 0 0 1 3 0 0 3 4
7 0 0 0 0 0 0 0 2
8 0 0 0 1 0 0 0 1
9 0 0 0 0 0 0 0 1
10 0 0 0 0 0 0 0 1
11 0 0 0 0 0 0 0 0
12 0 0 0 0 0 0 0 0
13 0 0 0 0 0 0 0 0
After orthogonal Procrustes rotation to optimal agreement. The entries denote the percentage (¼number) of items with-values according to the column heading in the number of countries according to the row heading.
Israeli Factor II (0.84), and USA Factors II (0.76), III (0.82), and IV (0.83) —the varimax-rotated components already showed high congruence. Averaged (across countries) -values were 0.95 for Extraversion, 0.90 for Agreeableness, 0.93 for Conscientiousness, 0.95 for Emotional Stability, and 0.91 for Autonomy. After orthogonal Procrustes rotation to optimal agreement, all factors in all samples reached -values well beyond the minimum value of 0.85 to call factors invariant, except for Agreeableness (0.83) in the USA study sample. Moreover, for each sample, except for the USA sample (M¼0.88), averaged (across factors) -values were well beyond 0.90. The overall structure can therefore be considered as an excellent representation of the individual sample structures. Appendix D shows the facet positions of the 100 items in the overall varimax-rotated structure as compared with their facet positions in the Dutch normative data. A total of 28 items (28%) do not match completely (facet position typed in bold). Of these 28 items, 26 show a difference in secondary loading only, which suggests that their connotations differ slightly in the two structures, and two items (numbers 2 and 16) show rotations of 30 (primary and secondary loading interchanged).
Finally, the overall structure was orthogonally Procrustes rotated to the Dutch and American reference structures, in order to establish its final factor positions. These final positions constitute the FFPI international reference structure. Given the amount of congruence between the Dutch and American reference structures, we decided to take a joint Dutch and American reference structure (N¼3260) as the final target. This target structure showed the following psychometric properties: in total, 37.4% of variance was explained, of which 33.3% by the Big Five factors and 4.1% by Acquiescence. The five varimax-rotated components explained 7.4% (Extraversion), 5.8% (Agreeableness), 5.6% (Conscientiousness), 8.4% (Emotional Stability), and 6% (Autonomy) of the variance. The values were 0.84, 0.81, 0.81, 0.84 and 0.77 for Extraversion, Agreeableness, Conscientiousness, Emotional Stability, and Autonomy, respectively.
Coefficients between the overall structure (13 countries) and the final target were remarkably high, for both varimax-rotated (0.96, 0.96, 0.97, 0.98, and 0.94 for I–V) and orthogonally Procrustes-rotated components (0.96, 0.95, 0.97, 0.98, and 0.95 for I–V). By being located almost exclusively in the high nineties, these values underscore the preservation of the original factor meaning in the FFPI international reference structure. As all off-diagonal elements in the rotation matrix were essentially zero (0.07), the values for the components in their final positions of the axes are identical to the ones in the varimax-rotated structure (0.85, 0.84, 0.83, 0.83, and 0.78 for Factors I–V, respectively). In Table 4 we present the congruence coefficients of each sample structure with the FFPI international reference structure, after varimax and after orthogonal Procrustes rotation. This table shows that congruence to the international reference structure was good to high for almost all sample structures, even with respect to their varimax-rotated factors. Exceptions were found for the Czech Republic sample (Agreeableness 0.84; Autonomy 0.82) and the USA sample (Agreeableness 0.77; Conscientiousness 0.84; Emotional Stability 0.82). After orthogonal Procrustes rotation to optimal agreement, however, only the USA sample still showed one factor (Agreeableness 0.82) that did not replicate the international structure.
Table 4. Congruence (, Tucker, 1951) of each sample structure with the FFPI international reference structure and internal consistency reliability () of the components
FFPI international reference structure (N¼4488)
after varimax rotation after Procrustes rotation after Procrustes rotation
Country N I II III IV V M I II III IV V M I II III IV V M
1. Belgium 265 96,93,95,96,94 95 96,94,95,97,94 95 86,85,87,88,78 85 2. Croatia 678 97,92,97,97,94 95 97,94,96,98,95 96 84,82,83,81,74 81 3. Czech Republic 258 94,84,87,95,82 88 95,88,92,95,90 92 87,83,85,86,84 85 4. England 277 95,93,96,94,93 94 95,93,96,96,93 95 85,81,86,86,82 84 5. Germany 417 96,93,96,97,91 95 97,92,97,95,94 95 85,89,84,85,83 85 6. Hungary 271 94,95,95,96,94 95 95,95,95,96,94 95 84,80,85,85,81 83 7. Israel 100 93,85,92,94,86 90 94,88,92,95,88 91 87,85,85,87,84 86 8. Italy 337 96,90,94,95,93 94 96,92,94,95,94 94 86,84,82,86,78 83 9. Japan 388 93,89,93,94,91 92 93,89,93,95,93 93 87,81,81,87,81 83 10. Netherlands 260 96,94,93,97,94 95 96,95,94,97,96 96 85,87,87,88,83 86 11. Slovakia 573 95,92,95,97,91 94 96,92,95,97,94 95 85,81,78,83,75 80 12. Spain 567 96,93,96,95,96 95 97,95,96,96,97 96 82,83,84,84,79 82 13. USA 97 94,77,84,82,85 84 93,82,87,92,88 88 86,81,85,84,81 83 Average 345 95,90,93,94,91 93 95,91,94,96,93 94 85,83,84,85,80 83
I¼Extraversion, II¼Agreeableness, III¼Conscientiousness, IV¼Emotional Stability, V¼Autonomy. Decimal points are omitted.
The
FFPI
acr
oss
cultur
es
361
#
2003
John
W
ile
y
&
Sons,
Ltd.
Eur
.
J.
P
ers.
17
:
347–373
DISCUSSION
Our first aim was to check whether the five-factor structure of the FFPI could be recovered in a variety of European and non-European countries. Our second aim was to check the generalizability of the five-factor structure. Our third aim was to establish an overall structure that can function as an international reference, if our findings regarding the first two aims were to warrant this. The results show that the FFPI has remarkably good and stable psychometric properties that generalize across cultures and demonstrate the validity of the final, international, FFPI reference structure. In other words, our aims have been fully achieved.
A difference was observed in the number of components to be retained for rotation according to the scree test, the -criterion, and parallel analysis. Whereas the former two criteria almost always suggested five components to be retained, parallel analysis suggested seven to nine. This difference can be attributed to the aim and stringency of the criteria: whereas parallel analysis indicates the absolute maximum number of components to be retained, both scree test and -criterion establish their optimal number, i.e., take parsimoniousness of the model into account. Parallel analysis shows at which point additionally extracted factors in the real data would explain less variance than those extracted in simulated random data and, thus, at which point it would no longer make sense retaining them (Reise et al., 2000). Both the scree test and the -criterion indicate the point of deminishing returns for additionally extracted factors in the real data, notwithstanding the fact that they may cover content: the scree test considers total amount of explained variance; the -criterion considers expected stability of the components. The-criterion is thus the most stringent one and, we think, should be given priority.
Amazingly, almost all items showed the same primary loadings in the varimax-rotated overall structure established using data from all 13 countries as in the Dutch normative structure. In only two cases were rotations of 30 observed, interchanging primary and secondary loadings. Indeed, it can be concluded that factor meaning has been preserved in the FFPI international reference structure.
The results of the present study contribute to our confidence in the FFPI as a valid and reliable instrument to compare personality and personality correlates across cultures, all the more so because the generalizability has been established at the level of the items, which is a far more stringent test than using facets or factors (McCrae et al., 1996). The partly deviating results in the USA study sample may be explained by its limited number of subjects. Low sample size can have a negative effect on component stability, just as a low variable to component ratio or low factor loading (component saturation) size can (Fava & Velicer, 1992). On the other hand, strong components (explaining large amounts of variance) can be found even when sample size is as low asN¼50 (Ten Berge, Kiers, & Van der Stel, 1992). Another explanation is that these subjects completed a large number of other items from various inventories, and that this could have affected their attention and therefore the resultant factor structure. They did have the highest Acquiescence of all samples; in an earlier study conducted with a large number of world view measures Acquiescence also seemed to be high.
& Akamine, 1996; McCrae & Costa, 1997). This means that imported (etic) personality measures can be useful tools, although they may not fully cover local reality (Yang & Bond, 1990). Moreover, the existence of cross-cultural equivalents for behaviours may point at the universality of personality constructs. It would be undue, however, to conclude from the results of the present study that the lexically based Big-Five factors, as represented and measured here by the FFPI,areuniversally the most important (basic) personality dimensions. Evidence regarding the universality of basic dimensions of personality must come primarily from trait-taxonomic (emic) studies. Comparisons among such studies suggest that lexically based cross-lingual universal Big Five factors are not to be expected (De Raad, Perugini, Hrˇebı´cˇkova´, & Szarota, 1998; De Raad et al., 1997; Hofstee, Kiers, De Raad, Goldberg, & Ostendorf, 1997). On the other hand, much method variance exists between trait-taxonomic studies, which seriously hampers conclusions on replicability of the Big Five factors (Goldberg & Somer, 2000; Saucier, Hampson, & Goldberg, 2000).
Although the results of the present study strengthen our confidence in the FFPI, no doubt much work remains to be done. The available samples consisted mainly of younger subjects with an above-average level of education. These sample characteristics are reflected in the relatively moderate percentages of Acquiescence variance (on average: 4.8%) in the data. Findings in samples showing a larger variety in age and educational level suggest that Acquiescence variance increases with age and decreases with higher levels of education (Hendriks et al., 1999a). Whether the same amount of replicability and generalizability of the factor structure holds for older people and lower levels of education is still to be investigated. Also, non-normal samples and specific settings (e.g. clinical and selection contexts) have not yet been included.
In the Netherlands, some data are available on non-psychiatric clinical subjects. In a relatively small (N¼99) sample of cancer patients under treatment (for details, see Van der Zee, Buunk, Sanderman, Botke, & Van den Bergh, 1999), the FFPI appeared internally consistent but factor congruence left something to be desired for Agreeableness, Conscientiousness, and Autonomy (Hendriks et al., 1999a). In a larger (N¼237) sample of hospital patients, good internal consistency reliability and excellent factor congruence for all five factors was found (Hendriks, 2000). However, extended instructions were used to tune respondents to a trait view rather than a state view, which may have arisen from having recently experienced a (major) threat to one’s health. Because other variables (sample size; severity of illness) may explain the difference in findings, more research is needed into whether instructions really need to be tailored to the situation in patient samples. Extended instructions may be thought of as inconvenient when it comes to general applicability of a questionnaire. On the other hand, they can be easily added as a brief extra introduction and, in patient samples, appear not uncommon (see e.g. Ulus¸ahin & Ulug˘, 1997).
explained by sample size. Nonetheless, clearly, additional research is needed to validate the FFPI in clinical samples.
In conclusion, the results of the present study suggest that the FFPI can be used with confidence in general-population samples in a large variety of countries. Its good psychometric properties may in part be due to the fact that, in contrast to other personality inventories, the FFPI relies, exclusively, on principal components scoring. That is, a person’s standing on each of the five dimensions is calculated by (differentially) weighted sums of this person’s 100 item responses, resulting in uncorrelated scale scores. Principal components explain a maximum of variance and are maximally reliable (Hofstee et al., 1998). As predictors, they are maximally efficient (Saucier, 2002). Unless the FFPI has been validated in a particular language and item weights have been established in a large (normative) sample, it is advised to make use of the matrix of item weights established in the Dutch normative structure, which can be obtained from the first author, together with a stand-alone (Pascal) scoring program to easily arrive at the intended (five) factor scores. A Windows version of the scoring program will be available in the near future.
However, given the results in the present study, the item weights of the FFPI international reference structure would be an even better alternative. This set of weights can also be obtained from the first author. The establishment of an international reference structure based on several thousands of respondents across several countries can facilitate standardized communications by using scores that are optimally weighted to maximize similarities between factorial structures across countries. Future research might establish the relationship between the international factor structure of the FFPI and the structure of other major measures such as the NEO-PI-R. This would allow translating scores on one inventory into the other inventory, which would truly facilitate standardized communica-tions across research programs.
ACKNOWLEDGEMENTS
The authors wish to thank Lewis R. Goldberg from the Oregon Research Institute for making available the American large-sample (N¼766) data set. Furthermore, they wish to thank the following colleagues for their contributions to the national projects in which the data were collected, and the following organizations for funding these projects: in Croatia, Iris Marusˇiæ and Goran Bubasˇ; in the Czech Republic, Ivo Cˇ erma´k, Tomas Urba´nek, and the Grant Agency of the Czech Republic (grant 406/99/1155 and partly grant 406/01/ 1507); in Hungary, Zso´fia Szirma´k (University of Bielefeld), Zsuzsanna Kulcsa´r (Lorand Eotvos University), and the National Scientific Research Projects of the Hungarian Academy of Sciences (OTKA T 018466); in Israel, Shiri Nussbaum; in Japan, Yasuko Nogami; in the Netherlands, Willem K. B. Hofstee, Boele De Raad; Mien Doddema-Winsemius, Jos M. F. Ten Berge, Henk A. L. Kiers, Henk Camstra, and the Netherlands Organization for Scientific Research, NWO (grant 575-68-068); in Slovakia, Grant Agency VEGA (grant 2/7140/20); in Spain, Urbano Lorenzo and Lluis Font.
REFERENCES
Benet-Martı´nez, V., & John, O. P. (1998).Los Cinco Grandesacross cultures and ethnic groups: Multitrait multimethod analyses of the Big Five in Spanish and English.Journal of Personality and Social Psychology, 75, 729–750.
Block, J. (1995). A contrarian view of the Five-Factor approach to personality description. Psychological Bulletin, 117, 187–215.
Caprara, G. V., Barbaranelli, C., Borgogni, L., & Perugini, M. (1993). The ‘Big Five Questionnaire’: A new questionnaire to assess the Five Factor Model.Personality and Individual Differences, 15, 281–288.
Cattell, R. B. (1943). The description of personality: Basic traits resolved into clusters.Journal of Abnormal and Social Psychology, 38, 476–506.
Cattell, R. B. (1966). The scree test for the number of factors.Multivariate Behavioral Research, 1, 245–276.
Costa, P. T., Jr., & McCrae, R. R. (1992). NEO PI-R: Professional manual. Odessa, FL: Psychological Assessment Recources.
De Fruyt, F. (1997). Gender and individual differences in adult crying.Personality and Individual Differences, 22, 937–940.
De Raad, B. (1994). An expedition in search of a fifth universal factor: Key issues in the lexical approach.European Journal of Personality, 8, 229–250.
De Raad, B. (2000).The Big Five personality factors: The psycholexical approach to personality. Go¨ttingen: Hogrefe & Huber.
De Raad, B., Hendriks, A. A. J., & Hofstee, W. K. B. (1992). Towards a refined structure of personality traits.European Journal of Personality, 6, 301–319.
De Raad, B., & Perugini, M. (Eds.). (2002).Big Five assessment.Go¨ttingen: Hogrefe & Huber. De Raad, B., Perugini, M., Hrˇebı´cˇkova´, M., & Szarota, P. (1998). Lingua franca of personality:
Taxonomies and structures based on the psycholexical approach. Journal of Cross-Cultural Psychology, 29, 212–232.
De Raad, B., Perugini, M., & Szirma´k, Z. (1997). In pursuit of a cross-lingual reference structure of personality traits: Comparisons among five languages.European Journal of Personality, 11, 167–185.
De Raad, B., & Van Heck, G. L. (Eds.). (1994). The fifth of the Big Five.European Journal of Personality, 8, Special Issue.
Digman, J. M. (1990). Personality structure: Emergence of the five-factor model. In M. R. Rosenzweig, & L. W. Porter (Eds.),Annual review of psychology(Vol. 41, pp. 417–440). Palo Alto, CA: Annual Reviews.
Eysenck, H. J. (1991). Dimensions of personality: 16, 5 or 3?—Criteria for a taxonomic paradigm. Personality and Individual Differences, 12, 773–790.
Fava, J. L., & Velicer, W. F. (1992). The effects of overextraction on factor and component analysis. Multivariate Behavioral Research, 27, 387–415.
Goldberg, L. R. (1981). Language and individual differences: The search for universals in personality lexicons. In L. Wheeler (Ed.),Review of personality and social psychology(Vol. 2, pp. 141–165). Beverly Hills, CA: Sage.
Goldberg, L. R. (1990). An alternative ‘Description of Personality’: The Big-Five factor structure. Journal of Personality and Social Psychology, 59, 1216–1229.
Goldberg, L. R. (1992). The development of markers of the Big-Five factor structure.Psychological Assessment, 4, 26–42.
Goldberg, L. R. (1999). A broad-bandwith, public-domain, personality inventory measuring the lower-level facets of several Five-Factor models. In I. Mervielde, I. Deary, F. De Fruyt, & F. Ostendorf (Eds.), Personality psychology in Europe (Vol. 7, pp. 7–28). Tilburg: Tilburg University Press.
Goldberg, L. R., & Somer, O. (2000). The hierarchical structure of common Turkish person-descriptive adjectives.European Journal of Personality, 14, 497–531.
Haven, S., & Ten Berge, J. M. F. (1977).Tucker’s coefficient of congruence as a measure of factorial invariance: An empirical study.Heymans Bulletins, HB-77–290 EX, Department of Psychology, University of Groningen.
Hendriks, A. A. J. (2000, July).The validity and reliability of the FFPI for assessing hospital (in)patients’ personality profiles. Poster presented at the 10th European Conference on Personality, Cracow.
Hendriks, A. A. J., Hofstee, W. K. B., & De Raad, B. (1999a). The Five-Factor Personality Inventory (FFPI).Personality and Individual Differences, 27, 307–325.
Hendriks, A. A. J., Hofstee, W. K. B., & De Raad, B. (1999b).Handleiding bij de Five-Factor Personality Inventory (FFPI) [The Five-Factor Personality Inventory: Professional manual]. Lisse: Swets.
Hendriks, A. A. J., Hofstee, W. K. B., & De Raad, B. (2002). The Five-Factor Personality Inventory: Assessing the Big Five by means of brief and concrete statements. In B. De Raad, & M. Perugini (Eds.),Big Five assessment(pp. 79–108). Go¨ttingen: Hogrefe & Huber.
Hofstee, W. K. B. (1991).Richtlijnen voor het schrijven van vragenlijstitems[Guidelines for writing inventory items]. Internal note. Department of Personality and Educational Psychology, University of Groningen.
Hofstee, W. K. B. (1999).Principes van beoordeling. Methodiek en ethiek van selectie, examinering en evaluatie[Principles of judgement. Methods and ethics of selection, testing and evaluation]. Lisse: Swets & Zeitlinger.
Hofstee, W. K. B., & De Raad, B. (1991). Persoonlijkheidsstructuur: De AB5C-taxonomie van Nederlandse eigenschapstermen [Personality structure: The AB5C taxonomy of Dutch trait terms].Nederlands Tijdschrift voor de Psychologie, 46, 262–274.
Hofstee, W. K. B., De Raad, B., & Goldberg, L. R. (1992). Integration of the Big Five and circumplex approaches to trait structure.Journal of Personality and Social Psychology, 63, 146–163. Hofstee, W. K. B., Kiers, H. A. L., De Raad, B., Goldberg, L. R., & Ostendorf, F. (1997). Comparison
of Big Five structures of personality traits in Dutch, English, and German.European Journal of Personality, 11, 15–31.
Hofstee, W. K. B., Ten Berge, J. M. F., & Hendriks, A. A. J. (1998). How to score questionnaires. Personality and Individual Differences, 25, 897–909.
John, O. P. (1990). The ‘Big Five’ factor taxonomy: Dimensions of personality in the natural language and in questionnaires. In L. A. Pervin (Ed.),Handbook of personality: Theory and research(pp. 66–100). New York: Guilford.
John, O. P., Angleitner, A., & Ostendorf, F. (1988). The lexical approach to personality: A historical review of trait taxonomic research.European Journal of Personality, 2, 171–203.
John, O. P., Donahue, E. M., & Kentle, R. L. (1991, July).The ‘Big Five’ Inventory: Versions 4a and 54. Technical Report. Berkeley, CA: Institute of Personality Assessment and Research. Johnson, J. A. (2000). Predicting observers’ratings of the Big Five from the CPI, HPI, and the
NEO-PI-R: A comparative validity study.European Journal of Personality, 14, 1–19.
Katigbak, M. S., Church, A. T., & Akamine, T. X. (1996). Cross-cultural generalizability of personality dimensions: Relating indigenous and imported dimensions in two cultures.Journal of Personality and Social Psychology, 70, 99–114.
McAdams, D. P. (1992). The five-factor model in personality: A critical appraisal. Journal of Personality, 60, 329–361.
McCrae, R. R. (1991). The Five-Factor Model and its assessment in clinical settings.Journal of Personality Assessment, 57, 399–414.
McCrae, R. R., & Costa, P. T., Jr. (1997). Personality structure as a human universal.American Psychologist, 52, 509–516.
McCrae, R. R., Zonderman, A. B., Costa, P. T., Jr., Bond, M. H., & Paunonen, S. V. (1996). Evaluating replicability of factors in the Revised NEO Personality Inventory: Confirmatory factor analysis versus Procrustes rotation.Journal of Personality and Social Psychology, 70, 552–566. Mervielde, I. (1992). The B5BBS-25: A Flemish set of bipolar markers for the ‘Big Five’ personality
factors.Psychologica Belgica, 32, 195–210.
Nussbaum, S., & Kreitler, S. (1998, July).The construction and validation of a Hebrew version of the Five Factor Personality Inventory (FFPI).Paper presented at the 9th European Conference on Personality (ECP-9), Guilford.
O’Connor, B. P. (2000). SPSS, SAS, and Matlab programs for determining the number of compo-nents using parallel analysis and Velicer’s MAP test. Behavior Research Methods, Instru-ments, & Computers, 32, 396–402. Retrieved December 7, 2002, from http : //flash:lakeheadu: ca/boconno2/nfactors:html.
Ostendorf, F. (1990).Sprache und perso¨nlichkeitsstruktur: Zur validita¨t des fu¨nf-faktoren-modells der perso¨nlichkeit[Language and personality structure: Towards the validity of the five-factor model of personality]. Regensburg: Roderer.
Ostendorf, F., Dieckmann, A., & Steiner, R. (1998, September).Perso¨nlichkeitssto¨rungen und das Fu¨nf-Faktoren-Modell der Perso¨nlichkeit [Personality disorders and the Five-Factor Model of personality]. Paper presented at the 41st Conference of the German Association of Psychology, Dresden.
Perugini, M., & Ercolani, A. P. (1998). Validity of the Five Factor Personality Inventory (FFPI): An investigation in Italy.European Journal of Psychological Assessment, 14, 234–248.
Reise, S. P., Waller, N. G., & Comrey, A. L. (2000). Factor analysis and scale revision.Psychological Assessment, 12, 287–297.
Rodrı´guez-Fornells, A., Lorenzo-Seva, U., & Andre´s-Pueyo, A. (2001). Psychometric properties of the Spanish adaptation of the Five-Factor Personality Inventory. European Journal of Psychological Assessment, 17, 145–153.
Saucier, G. (1992). Openness versus intellect: Much ado about nothing? European Journal of Personality, 6, 381–386.
Saucier, G. (2002). Gone too far—or not far enough? Comments on the article by Ashton and Lee (2001).European Journal of Personality, 16, 55–62.
Saucier, G., Hampson, S. E., & Goldberg, L. R. (2000). Cross-language studies of lexical personality factors. In S. E. Hampson (Ed.),Advances in personality psychology(Vol. 1, pp. 1–36). Hove: Psychology.
Ten Berge, J. M. F. (1999). A legitimate case of component analysis of ipsative measures, and partialling the mean as an alternative to ipsatization. Multivariate Behavioral Research, 34, 89–102.
Ten Berge, J. M. F., & Hofstee, W. K. B. (1999). Coefficients alpha and reliabilities of unrotated and rotated components.Psychometrika, 64, 83–90.
Ten Berge, J. M. F., Kiers, H. A. L., & Van der Stel, V. (1992). Simultaneous components analysis. Statistica Applicata, 4, 377–392.
Trapnell, P. D., & Wiggins, J. S. (1990). Extension of the Interpersonal Adjectives Scales to include the Big Five dimensions of personality.Journal of Personality and Social Psychology, 59, 781– 790.
Tucker, L. J. (1951).A method for synthesis of factor analysis studies.Personnel Research Section Report No. 984, Department of the Army, Washington, DC.
Tupes, E. C., & Christal, R. E. (1961).Recurrent personality factors based on trait ratings. Technical Report ASD-TR-61–97, Lackland Air Force Base, TX: U.S. Air Force. Republished inJournal of Personality, 60, 225–251 (1992).
Ulus¸ahin, A., & Ulug˘, B. (1997). Clinical and personality correlates of outcome in depressive disorders in a Turkish sample.Journal of Affective Disorders, 42, 1–8.
Van der Zee, K. I., Buunk, B. P., Sanderman, R., Botke, G., & Van den Bergh, F. (1999). The Big Five and identification–contrast processes in social comparison in adjustment to cancer treatment. European Journal of Personality, 13, 307–326.
Verplanken, B., & Herabadi, A. (2001). Individual differences in impulse buying tendency: Feeling and no thinking.European Journal of Personality, 15, S71–S83.
Wada, S. (1996). Construction of the Big Five Scales of personality trait terms and concurrent validity with NPI (Japanese, with English abstract).Japanese Journal of Psychology, 67, 61–67. Yang, K., & Bond, M. H. (1990). Exploring implicit personality theories with indigenous or imported
APPENDIX A: FIRST 10 EIGENVALUES
Eigenvalues
Country N 1 2 3 4 5 6 7 8 9 10
1. Belgium 265 15.5 8.9 6.3 5.7 3.3 2.4 2.1 1.8 1.7 1.6
2. Croatia 678 14.6 8.6 4.9 3.9 2.9 1.9 1.8 1.7 1.4 1.4
3. Czech Republic 258 12.4 8.7 6.4 5.6 4.0 2.1 2.0 2.0 1.7 1.6
4. England 277 13.4 9.8 5.5 4.9 3.6 2.0 1.9 1.9 1.8 1.6
5. Germany 417 26.3 8.8 6.0 4.4 4.2 1.8 1.7 1.6 1.5 1.3
6. Hungary 271 15.5 8.6 5.0 4.4 3.6 2.8 2.3 2.1 1.8 1.6
7. Israel 100 16.2 8.9 7.0 5.3 4.0 3.3 2.9 2.6 2.2 2.0
8. Italy 337 15.5 7.3 6.1 4.3 3.4 2.2 2.1 1.9 1.8 1.6
9. Japan 388 16.6 8.1 5.6 4.6 3.5 2.4 1.9 1.7 1.6 1.4
10. Netherlands 260 17.4 8.9 6.7 5.7 4.0 2.4 2.2 1.9 1.8 1.6
11. Slovakia 573 12.3 7.6 5.7 3.6 2.9 2.0 1.9 1.6 1.5 1.4
12. Spain 567 13.2 8.5 5.1 4.3 3.4 1.9 1.8 1.7 1.6 1.5
13. USA 97 11.7 8.2 5.4 4.6 3.8 3.5 3.1 2.7 2.4 2.2
APPENDIX B: INTERNAL CONSISTENCY RELIABILITIES () FOR THE VARIMAX-ROTATED COMPONENTS
Country N No. of components a
1. Belgium 265 4 88,87,91,86
5b 88,87,85,85,78
6 87,85,85,84,78,62
2. Croatia 678 4 84,84,83,87
5b 79,84,82,87,73
6 74,81,86,81,69,61
3. Czech Republic 258 4 86,87,88,88
5b 87,87,83,86,83
6 86,81,85,85,83,60
4. England 277 4 89,89,86,84
5b 84,87,84,85,80
6 84,85,84,84,80,54
5. Germany 417 4 90,90,85,83
5b 89,85,84,83,85
6 89,85,76,83,82,56
6. Hungary 271 4 85,87,84,87
5b 85,86,81,84,80
6 83,86,80,83,71,76
7. Israel 100 4 90,87,88,89
5b 86,87,86,86,84
6 86,86,86,86,84,71
8. Italy 337 4 89,88,84,83
5b 86,87,84,82,76
6 86,87,83,82,75,57
9. Japan 388 4 87,87,88,84
5b 88,81,85,81,82
6 87,81,85,81,78,63
10. Netherlands 260 4 91,88,87,88
5b 86,87,87,87,83
6 87,87,85,87,74,69
11. Slovakia 573 4 88,81,88,80
5b 83,81,87,78,73
6 87,80,83,78,71,55
12. Spain 567 4 86,85,84,85
5b 82,84,83,84,79
6 80,84,62,83,78,74
13. USA 97 4 88,86,87,82
5 87,83,83,81,81
6 87,84,83,81,78,74
7b 84,83,82,78,78,74,77
8 84,82,82,78,76,74,76,67
aNot necessarily in Big Five order; decimal points omitted.
APPENDIX C: ITEMS THAT FAILED ( <0.80) TO REPLICATE THE REFERENCE STRUCTURE IN THREE OR MORE COUNTRIES
Countries
B Cr Cz E G H Is It J NL Sl Sp US
Dutch reference (N¼2494)
1 Takes time out Is J Sl
to chat (Iþ)
5 Does as he/she G It US
is told (V)
9 Thinks that all Cz G H US
will be well (IVþ)
30 Is easily E It US
deterred (V)
43 Behaves Cr It J US
properly (IIIþ)
58 Wants everything Cz E G Is Sl US
to add up perfectly (IIIþ)
78 Is easily distracted G J Sl US
(III)
81 Lives in a world Cz G J Sl
of his/her own (I) American reference (N¼766)
3 Acts without planning NL Sl Sp
(III)
16 Feels uncomfortable G H J
(I)
25 Will believe anything B Cr Cz G Is
(V)
30 Is easily deterred B Cr Is NL Sl Sp
(V)
49 Can stand a great G H US
deal of stress (IVþ)
53 Seeks danger (II) G It US
56 Keeps apart from Cr H Is It J Sp
others (I)
58 Wants everything to Cz E G H Is Sl
add up perfectly (IIIþ)
70 Follows the crowd (V) B Cr Is
75 Reacts quickly (Vþ) G H Is J Sl
78 Is easily distracted (III) G Sl US