Chapter XIX
Chapter XIX
Factor Analysis
Chapter Outline
Chapter Outline
1) Overview
1) Overview
2) Basic Concept
2) Basic Concept
3) Factor Analysis Model
3) Factor Analysis Model
4) Statistics Associated with Factor Analysis
5) Conducting Factor Analysis
i. Problem Formulation
ii. Construction of the Correlation Matrix
iii. Method of Factor Analysis
iv. Number of of Factors
v. Rotation of Factors
vi. Interpretation of Factors
vii. Factor Scores
6) Applications of Common Factor Analysis
6) Applications of Common Factor Analysis
7) Internet and Computer Applications
7) Internet and Computer Applications
8) Focus on Burke
8) Focus on Burke
9) Summary
9) Summary
10) Key Terms and Concepts
10) Key Terms and Concepts
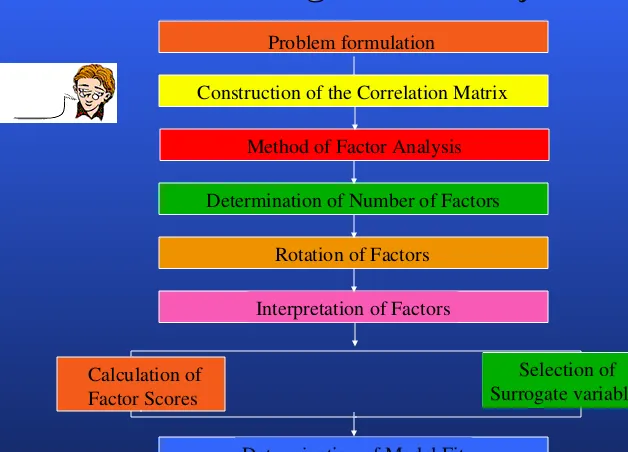
Conducting Factor Analysis
[image:5.720.51.679.51.503.2]Conducting Factor Analysis
Fig 19.1
Fig 19.1
Calculation of
Factor Scores
Problem formulation
Construction of the Correlation Matrix
Method of Factor Analysis
Determination of Number of Factors
Rotation of Factors
Interpretation of Factors
Selection of
Surrogate variables
RESPONDENT
NUMBER V1 V2 V3 V4 V5 V6
1 7.00 3.00 6.00 4.00 2.00 4.00
2 1.00 3.00 2.00 4.00 5.00 4.00
3 6.00 2.00 7.00 4.00 1.00 3.00
4 4.00 5.00 4.00 6.00 2.00 5.00
5 1.00 2.00 2.00 3.00 6.00 2.00
6 6.00 3.00 6.00 4.00 2.00 4.00
7 5.00 3.00 6.00 3.00 4.00 3.00
8 6.00 4.00 7.00 4.00 1.00 4.00
9 3.00 4.00 2.00 3.00 6.00 3.00
10 2.00 6.00 2.00 6.00 7.00 6.00
11 6.00 4.00 7.00 3.00 2.00 3.00
12 2.00 3.00 1.00 4.00 5.00 4.00
13 7.00 2.00 6.00 4.00 1.00 3.00
14 4.00 6.00 4.00 5.00 3.00 6.00
15 1.00 3.00 2.00 2.00 6.00 4.00
16 6.00 4.00 6.00 3.00 3.00 4.00
17 5.00 3.00 6.00 3.00 3.00 4.00
18 7.00 3.00 7.00 4.00 1.00 4.00
19 2.00 4.00 3.00 3.00 6.00 3.00
20 3.00 5.00 3.00 6.00 4.00 6.00
21 1.00 3.00 2.00 3.00 5.00 3.00
22 5.00 4.00 5.00 4.00 2.00 4.00
23 2.00 2.00 1.00 5.00 4.00 4.00
24 4.00 6.00 4.00 6.00 4.00 7.00
25 6.00 5.00 4.00 2.00 1.00 4.00
26 3.00 5.00 4.00 6.00 4.00 7.00
27 4.00 4.00 7.00 2.00 2.00 5.00
28 3.00 7.00 2.00 6.00 4.00 3.00
29 4.00 6.00 3.00 7.00 2.00 7.00
30 2.00 3.00 2.00 4.00 7.00 2.00
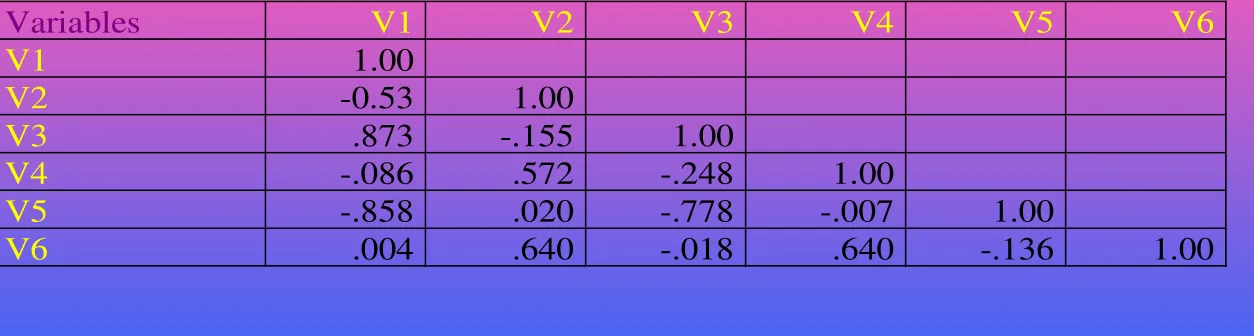
Correlation Matrix
[image:7.720.46.673.165.333.2]Correlation Matrix
Table 19.2
Table 19.2
Variables V1 V2 V3 V4 V5 V6
V1 1.00
V2 0.53 1.00
V3 .873 .155 1.00
V4 .086 .572 .248 1.00
V5 .858 .020 .778 .007 1.00
Results of Principal Components Analysis
Results of Principal Components Analysis
Table 19.3
Table 19.3
Communalities
Variables Initial Extraction
V1 1.000 .926
V2 1.000 .723
V3 1.000 .894
V4 1.000 .739
V5 1.000 .878
V6 1.000 .790
Barlett test of sphericity
• Approx. ChiSquare = 111.314
• df = 15
• Significance = .00000
• KaiserMeyerOlkin measure of
sampling adequacy = .660
Barlett test of sphericity
• Approx. ChiSquare = 111.314
• df = 15
• Significance = .00000
• KaiserMeyerOlkin measure of
sampling adequacy = .660
Initial Eigenvalues
Factor Eigenvalue % of variance Cumulat. %
1 2.731 45.520 45.520
2 2.218 36.969 82.488
3 0.442 7.360 89.848
4 0.341 5.688 95.536
5 0.183 3.044 98.580
Extraction Sums of Squared Loadings
Factor Eigenvalue % of variance Cumulat. %
1 2.731 45.520 45.520 2 2.218 36.969 82.488
Factor Matrix
Variables Factor 1 Factor 2
V1 .928 .253
V2 .301 .795
V3 .936 .131
V4 .342 .789
V5 .869 .351
V6 .177 .871
Rotation Sums of Squared Loadings
Factor Eigenvalue % of variance Cumulat. %
1 2.688 44.802 44.802 2 2.261 37.687 82.488
Table 19.2 Contd.
Rotated Factor Matrix
Variables Factor 1 Factor 2
V1 .962 .027
V2 .057 .848
V3 .934 .146
V4 .098 .845
V5 .933 .084
V6 .083 .885
Factor Score Coefficient Matrix
Variables Factor 1 Factor 2
V1 .358 .011
V2 .001 .375
V3 .345 .043
V4 .017 .377
V5 .350 .059
V6 .052 .395
Table 19.2 Contd.
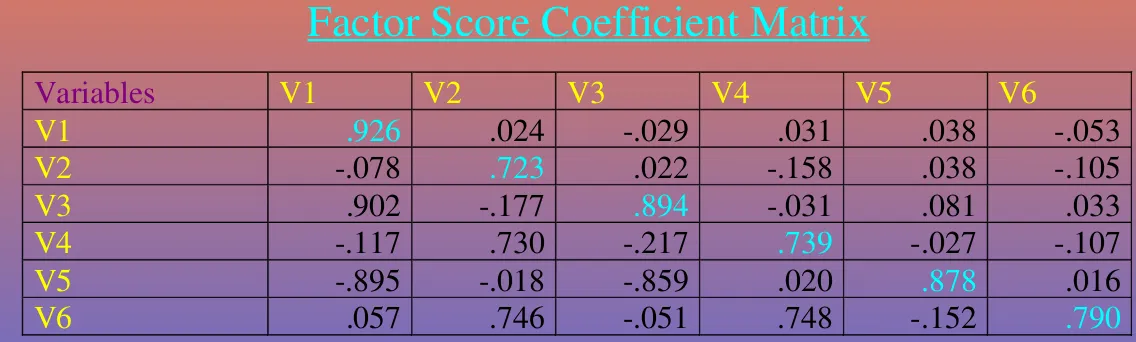
Factor Score Coefficient Matrix
Variables V1 V2 V3 V4 V5 V6
V1 .926 .024 .029 .031 .038 .053
V2 .078 .723 .022 .158 .038 .105
V3 .902 .177 .894 .031 .081 .033
V4 .117 .730 .217 .739 .027 .107
V5 .895 .018 .859 .020 .878 .016
V6 .057 .746 .051 .748 .152 .790
The lower left triangle contains the reproduced
correlation matrix; the diagonal, the communities; the
upper right triangle, the residuals between the
observed
correlations
and
the
reproduced
correlations.
[image:11.720.97.665.225.396.2]The lower left triangle contains the reproduced
correlation matrix; the diagonal, the communities; the
upper right triangle, the residuals between the
observed
correlations
and
the
reproduced
correlations.
Table 19.2 Contd.
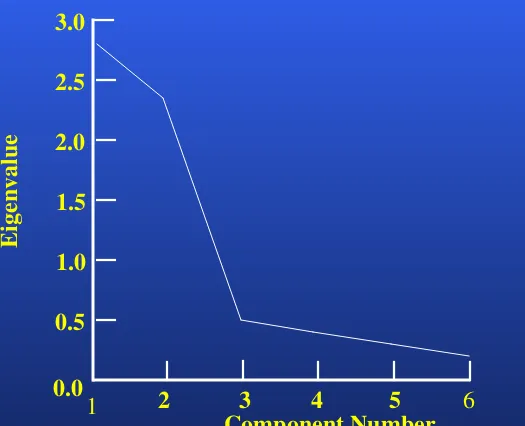
Screen Plot
[image:12.720.95.620.76.502.2]Screen Plot
Fig. 19.2
Fig. 19.2
0.5
2
3
4
5
6
Component Number
0.0
2.0
3.0
E
ig
en
va
lu
e
1.0
1.5
2.5
Factor Loading Plot
Factor Loading Plot
Fig. 19.3
Fig. 19.3
1.0
0.5
0.0
.5
1.0
C
om
po
ne
nt
2
Component 1
Component
Variable 1 2
V1
0.962 2.66E02
V2
5.72E02 .848
V3
0.934 .146
V4
9.83E02 .854
V5
.933 8.40E02
V6
8.337E02 0.885
Component Plot in Rotated Space
1.0
0.5
0.0
.5
1.0
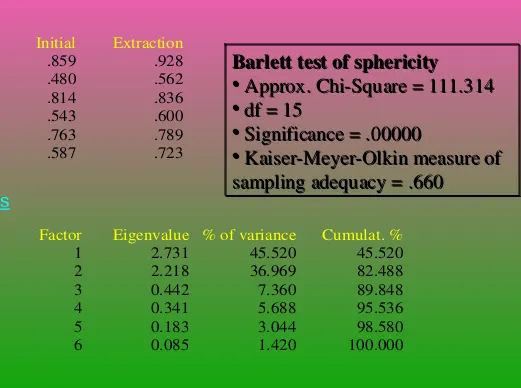
Results of Common Factor Analysis
[image:14.720.177.698.106.494.2]Results of Common Factor Analysis
Table 19.4
Table 19.4
Communalities
Variables Initial Extraction
V1 .859 .928
V2 .480 .562
V3 .814 .836
V4 .543 .600
V5 .763 .789
V6 .587 .723
Barlett test of sphericity
• Approx. ChiSquare = 111.314
• df = 15
• Significance = .00000
• KaiserMeyerOlkin measure of
sampling adequacy = .660
Barlett test of sphericity
• Approx. ChiSquare = 111.314
• df = 15
• Significance = .00000
• KaiserMeyerOlkin measure of
sampling adequacy = .660
Initial EigenvaluesFactor Eigenvalue % of variance Cumulat. %
Extraction Sums of Squared Loadings
Factor Eigenvalue % of variance Cumulat. %
1 2.570 42.837 42.837 2 1.868 31.126 73.964
Factor Matrix
Variables Factor 1 Factor 2
V1 .949 .168
V2 .206 .720
V3 .914 .038
V4 .246 .734
V5 .850 .259
V6 .101 .844
Rotation Sums of Squared Loadings
Factor Eigenvalue % of variance Cumulat. %
1 2.541 42.343 42.343 2 1.897 31.621 73.964
Table 19.4 Contd.
Rotated Factor Matrix
Variables Factor 1 Factor 2
V1 .963 .030
V2 .054 .747
V3 .902 .150
V4 .090 .769
V5 .885 .079
V6 .075 .847
Factor Score Coefficient Matrix
Variables Factor 1 Factor 2
V1 .628 .101
V2 .024 .253
V3 .217 .169
V4 .023 .271
V5 .166 .059
V6 .083 .500
Table 19.4 Contd.
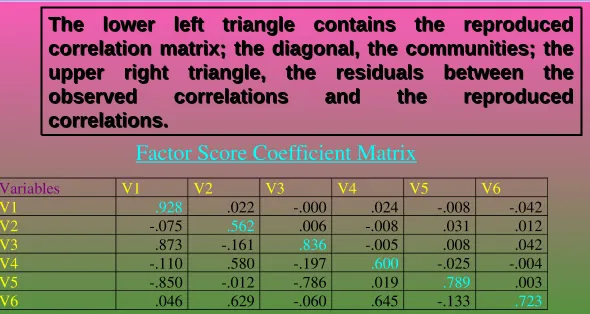
Factor Score Coefficient Matrix
Variables V1 V2 V3 V4 V5 V6
V1 .928 .022 .000 .024 .008 .042
V2 .075 .562 .006 .008 .031 .012
V3 .873 .161 .836 .005 .008 .042
V4 .110 .580 .197 .600 .025 .004
V5 .850 .012 .786 .019 .789 .003
V6 .046 .629 .060 .645 .133 .723
The lower left triangle contains the reproduced
correlation matrix; the diagonal, the communities; the
upper right triangle, the residuals between the
observed
correlations
and
the
reproduced
correlations.
[image:17.720.49.639.47.361.2]The lower left triangle contains the reproduced
correlation matrix; the diagonal, the communities; the
upper right triangle, the residuals between the
observed
correlations
and
the
reproduced
correlations.
Table 19.4 Contd.
Driving Nuts For Beetles
Driving Nuts For Beetles
RIP 19.1
RIP 19.1
Now old bugs are being sought everywhere. "The Japanese
are going absolutely nuts for Beetles," says Jack Finn, a
recycler of old Beetles in West Palm Beach, Florida.
Beetles are still made in Mexico, but they cannot be exported
to US or Europe because of safety and emission standards.
Because of faithful loyalty for the "bug", VW has repositioned
the beetle as a new shiny VW Passat, a premium quality car
which gives an image of sophistication and class as opposed
to the old one which symbolized lowpriced brand.
RIP 19.1 Contd.
Factors Predicting Unethical
Factors Predicting Unethical
Marketing Research
Marketing Research
Practices
Practices
RIP 19.2
RIP 19.2
A survey of 420 marketing professionals was conducted to
identify organizational variables that determine the incidence of
unethical marketing research practices. These marketing
professionals were asked to provide evaluations of the incidence
of fifteen marketing research practices that have been found to
pose ethical problems. They also provided responses on several
other scales, including an 11 item scale pertaining to the extent
to which ethical problems plagued the organization, and what
top management's actions were toward ethical situations. The
commonly used method of principal components analysis with
varimax rotation indicated that these 11 items could be
represented by two factors.
Factor Analysis of Ethical Problems and Top Management Action Scale Extent of Ethical
Problems within Top Management the organization actions on ethics (factor 1) (factor 2) 1. Successful executives in my company make rivals look bad in the eyes of
important people in my company. 0.66
2. Peer executives in my company often engage in behaviors that I consider unethical. 0.68
3. There are opportunities for peer executives in my company to engage in unethical behavior. 0.43
4. Successful executives in my company take credit for the ideas & accomplishment of others. 0.81
5. In order to succeed in my company, it is often necessary to compromise one's ethics. 0.66
6. Successful executives in my company are generally more unethical than unsuccessful
executives. 0.64
7. Successful executives in my company look for a "scapegoat" when they feel they may by associated with failure. 0.78
RIP 19.1 Contd
Factor Analysis of Ethical Problems and Top Management Action Scale Extent of Ethical
Problems within Top Management the organization actions on ethics (factor 1) (factor 2) 8. Successful executives in my company
withhold information that is detrimental to their self-interest. 0.68
9. Top management in my company has let it be known in no uncertain terms that
unethical behaviors will not be tolerated. 0.73
10. If an executive in my company engages in unethical behavior resulting in personal gain (rather than corporate gain), he/she will be
promptly reprimanded. 0.80
11. If an executive in my company engages in unethical behavior resulting in corporate
gain, he/she will be promptly reprimanded. 0.78 Eigenvalue 5.06 1.17 % of Variance Explained 46% 11% Coefficient Alpha 0.87 0.75
To simplify the table, only varimax-rotated loading of .40 or greater are
reported. Each was rated on a five-point scale with 1 = "strongly agree" and 5 = "strongly disagree”
RIP 19.1 Contd
Factor Analysis of Ethical Problems and Top Management Action Scale
The first factor could be interpreted as the incidence of unethical
practices, while the second factor denotes top management
actions related to unethical practices. The two factors together
account for more than half the variation in the data with the first
factor being dominant. These two factors were then used along
with four other variables as predictors in a multiple regression.
The results indicated that they were the two best predictors of
unethical marketing research practices.
RIP 19.1 Contd